Production and body composition traits of broilers in relation to
breast weight evaluated by path analysis
Leandro Homrich Lorentz
1; Leila de Genova Gaya
2; Raquel Lunedo
3; José Bento Sterman
Ferraz
4*; Fernanda Marcondes de Rezende
4; Tércio Michelan Filho
51
UNIPAMPA – Campus Itaqui, Rua Joaquim de Sá Britto, s/n – 97650-000 – Itaqui, RS – Brasil.
2
UFSJ/DEPEB – Pça. Dom Helvécio, 74 – 36301-160 – São João del-Rei, MG – Brasil.
3
UNESP – Programa de Pós Graduação em Zootecnia – Via de Acesso Prof. Paulo Donato Castellane, s/n – 14884-900 – Jaboticabal, SP – Brasil.
4
USP/FZEA – Av. Duque de Caxias Norte, 225 – 13635-970 – Pirassununga, SP – Brasil.
5
Aviagen do Brasil Ltda., Rod. SP 127, km 2,2 – 13500-970 – Rio Claro, SP – Brasil. *Corresponding author <[email protected]>
ABSTRACT: Breast weight has great economic importance in poultry industry, and may be associated with other variables. This work aimed to estimate phenotypic correlations between performance (live body weight at 7 and 28 days, and at slaughter, and depth of the breast muscle measured by ultrasonography), carcass (eviscerated body weight and leg weight) and body composition (heart, liver and abdominal fat weight) traits in a broiler line, and quantify the direct and indirect influence of these traits on breast weight. Path analysis was used by expanding the matrix of partial correlation in coefficients which give the direct influence of one trait on another, regardless the effect of the other traits. The simultaneous maintenance of live body weight at slaughter and eviscerated body weight in the matrix of correlations might be harmful for statistical analysis involving systems of normal equations, like path analysis, due to the observed multicollinearity. The live body weight at slaughter and the depth of the breast muscle as measured by ultrasonography directly affected breast weight and were identified as the most responsible factors for the magnitude of the correlation coefficients obtained between the studied traits and breast weight. Individual pre-selection for these traits could favor an increased breast weight in the future reproducer candidates of this line if the broilers’ environmental conditions and housing are maintained, since the live body weight at slaughter and the depth of breast muscle measured by ultrasonography were directly related to breast weight.
Key words: animal breeding, multivariate analysis, phenotypic correlation, poultry, pre-selection
Características de produção e de composição corporal de frangos em relação
ao peso de peito avaliada por análise de trilha
RESUMO: O peso do peito possui grande importância econômica na indústria de frangos, podendo estar associado a outras variáveis passíveis de seleção. Estimaram-se correlações fenotípicas entre características de desempenho (peso vivo aos 7, 28 dias e ao abate e profundidade de músculo peitoral por ultra-sonografia), carcaça (peso eviscerado e de pernas) e composição corporal (peso do coração, do fígado e da gordura abdominal), em uma linhagem de frangos, e quantificou-se a influência direta e indireta destas variáveis sobre o peso do peito. Para tanto, utilizou-se a análise de trilha, desdobrando-se a matriz de correlações parciais em coeficientes que forneceram a influência direta de uma variável sobre a outra, independentemente das demais. A manutenção das variáveis peso vivo ao abate e peso eviscerado na matriz de correlações pode ser prejudicial à análise estatística que envolve os sistemas de equações normais, como a análise de trilha, devido à multicolinearidade observada. O peso vivo ao abate e a profundidade do músculo peitoral por ultra-sonografia apresentaram efeitos diretos importantes sobre o peso de peito e foram identificadas como as principais responsáveis pela magnitude dos coeficientes de correlação obtidos. Assim, uma pré-seleção individual para estas características pode favorecer um aumento no peso de peito nesta linhagem, se mantidas as condições ambientais de criação dos frangos, uma vez que o peso vivo ao abate e a profundidade de músculo peitoral por ultra-sonografia afetam fenotipicamente e diretamente o peso de peito.
Palavras-chave:melhoramento animal, análise multivariada, correlação fenotípica, aves, pré-seleção
Introduction
Broiler production technology has presented high evolution rates in recent years, which is mainly due to the selection for specific traits of commercial interest. A selection method used in broiler breeding is the
The breast weight is one of the most economically im-portant traits in the poultry industry, but its selection requires a sib test, which is expensive (Schmidt et al., 2006). The phe-notypic individual selection is usually accomplished in juve-nile ages (Bijma et al., 2000), when called pre-selection, which can be used especially for traits previously identified as being favorably associated with breast weight may facilitate early re-moval of broilers with poorer quality. These associations may be evaluated by phenotypic correlations (Cheverud, 1988; Rance et al., 2002), since the confounding of genetic and en-vironmental effects on phenotype are low. Such situation can be assumed in poultry evaluation, because the individuals are reared in environmentally controlled housing (Willis et al., 1991; Morris and Pollott, 1997).
The identification of the traits that are able to affect di-rectly and positively the breast weight can be performed by path analysis, which expands the matrix of correlation in co-efficients that supplied the direct influence of one trait on another, regardless the other traits (Rao and Rice, 1998). Sev-eral reports on path analysis based on phenotypic correla-tions are found in the literature on vegetables and other sub-jects (Marchezan et al., 2005; Cargnelutti Filho et al., 2006; Ferreira et al., 2007; Gondim et al., 2008). However, reports about path analysis were not found in the literature on ani-mal science. Path analysis could be an important appeal for the understanding of cause-effect relationships between traits used in phenotypic or genetic selection of animals. There-fore, we quantified the direct and indirect effects of perfor-mance, carcass and body composition traits on breast weight in a broiler line evaluated by path analysis.
Material and Methods
Information on performance, carcass and body compo-sition traits from a sib test of a male broiler line was used. The data were collected in Pirassununga, state of São Paulo, Brazil, between the years 2001 and 2006. The considered traits were: (i) depth of the breast muscle (US), obtained by the average of the longitudinal and transversal accesses of the breast measured by ultrasonography at 38 days of age; (ii) live body weight at 7 days of age (BW7); (iii) live body weight at 28 days of age (BW28); (iv) live body weight at slaughter (SL) registered at 42 or 44 days of age at the slaugh-tering house prior to slaughter; (v). eviscerated body weight (EBW), corresponding to the warm eviscerated carcass weight, without neck and feet; (vi) skinless deboned breast weight (BRE), obtained after carcass cooling; (vii) leg weight (LEG), corresponding to thigh plus drumstick weight with bone and skin; (viii) heart weight (HE); (ix) liver weight (LI); and (x) abdominal fat weight (FAT), corresponding to ab-dominal fat pad plus the weight of fat adhered to the giz-zard. The original dataset was submitted to exploratory analy-sis in order to eliminate doubtful data and outliers. Only the information for males was used.
The partial correlation coefficients among the traits were estimated, using the software SAS®, version 6.12 (SAS In-stitute, 1999), fitting the same values of broiler mother ages (M, range between 32 to 59 weeks of age) and the broiler ages at slaughter (S, 42 and 44 days) by the equations 1 and
2, given by Snedecor and Cochran (1989).
(
')(
')
' ' , 2 2 1 1i i i i i i
i i
x x x M x M
x x M
x M x M
r r r
r
r r
− =
− − (1)
(
1 2) (
1 2)
' ' ' ' , , , , , ,
i i i i
i i
i i
x x M x S M x S M
x x MS
x M S x m S
r r r
r
r r
− =
− − − (2)
where: r is the partial correlation, M and S are the auxiliary variables used to adjust the traits xi and xi’.
This calculation generated a 10 × 10 matrix of par-tial correlation coefficients between the traits. The eigen-values of this matrix were then estimated in order to de-termine the matrix multicollinearity, keeping for the analysis a set of traits with a condition number (CN) lower than 100 and Variance Inflation Factors (VIF) lower than 10. The CN is given by the relation between the maximum and the minimum eigenvalue (CN = λmax/ λmin), obtained from the partial correlation coefficient matrix, and VIF = 1/(1 – R2
) was computed for each planatory trait as a function of all other remaining ex-planatory traits, and R2
is the coefficient of determina-tion from each generated multiple regression (Chatterjee and Hadi, 2006).
Thereafter the coefficients were expanded into the direct and indirect effects using the Path Analysis (Rao and Rice, 1998), given by equation 3.
'
; ; ;
1
ˆ ˆ
i i i i i
m
BRE x BRE x BRE x x x
i
r p p r
=
= +
∑
(3)where rBRE,xi is the partial correlation coefficient of the main trait (BRE) and the ith explicative trait (i = 1, 2, ..., m);
;
ˆ
i BRE x
p is the direct effect of the ith
trait on BRE and
' ;
ˆ
i i i
x BRE x x
p r is the indirect effect of ith
trait over BRE via the xi’th trait (for all xi≠ xi’), forming a system with m equations. The path coefficients were obtained solving the linear sys-tem using the Least Square Method, given by
(
) (
1)
ˆ X X' − X Y'
β = , where ˆβ is the vector of direct effects to be estimated; X is the partial correlation matrix between the explanatory traits and Y is the vector of the partial corre-lation of the BRE and the explanatory traits remained in the analysis, as follows:
1 2 1 3 1
1 1
2 2 1 2 3 2 2
3 3 1 3 2 3 3
1 3 2
; ; ; ; ; ; ; ; ; ; ; ; ; ; ; ; ; ; ; 1 ... 1 ...
1 ... .
... ... ... ... ... ... ...
... 1
m m m
m m m m
x x x x x x
BRE x BRE x
BRE x x x x x x x BRE x
BRE x x x x x x x BRE x
BRE x x x x x x x BRE
r r r
r p
r r r r p
r r r r p
r r r r p
⎡ ⎤ ⎡ ⎤ ⎢ ⎥ ⎢ ⎥ ⎢ ⎥ ⎢ ⎥ ⎢ ⎥ ⎢ ⎥ = ⎢ ⎥ ⎢ ⎥ ⎢ ⎥ ⎢ ⎥ ⎢ ⎥ ⎢ ⎥ ⎢ ⎥ ⎢ ⎥
⎣ ⎦ ⎣ ⎦ xm
⎡ ⎤ ⎢ ⎥ ⎢ ⎥ ⎢ ⎥ ⎢ ⎥ ⎢ ⎥ ⎢ ⎥ ⎢ ⎥ ⎣ ⎦
Results and Discussion
All traits have positive phenotypic correlations with breast weight, indicating that each trait may influence breast weight (Tables 1 and 2). The phenotypic correlations between BRE and the other traits were positive and moderate to high (0.378 to 0.832), except for the correlation between BRE and FAT, which was positive but low (0.188). Other studies show-ing important phenotypic correlations among performance, carcass and body composition traits are also reported (Rance et al., 2002; Vayego et al., 2008). However, there is a limita-tion in the evalualimita-tion of the obtained correlalimita-tion coefficients: they only indicate the magnitude and the direction of a lin-ear association between the traits (Kaps and Lamberson, 2004) without revealing the cause-effect relationships. There-fore, the obtained phenotypic correlations among perfor-mance, carcass and body composition traits in this broiler line are just indicators of the possibility of indirect pheno-typic selection, although some other effects inherent to ge-netic and environmental interactions might make this
selec-tion inefficient, even in the case of high phenotypic correla-tions as many of those obtained in this study. This limita-tion, according to Rao and Rice (1998), can be overcome by use of path analysis.
The path analysis has as intermediary calculation the nor-mal equation system (such as multiple regression), and its results can be influenced by the level of interrelation between the predictor variables, named multicollinearity. This multicollinearity is associated with unstable estimated regres-sion coefficients and originates from the strong linear rela-tionship among the explanatory measured traits (Chatterjee and Hadi, 2006) and is very harmful to the reliability of the inferences, because the regression coefficients have large sam-pling errors, creating erroneous coefficients and ambiguous results, affecting the inference based on this regression model. The problems caused by multicolinearity can somewhat be overcome by deleting one of a pair of explicative traits that are highly correlated (Johnson and Wichern, 1998) and can be detected observing simultaneously a correlation co-efficient of best correlated variables, the Condition
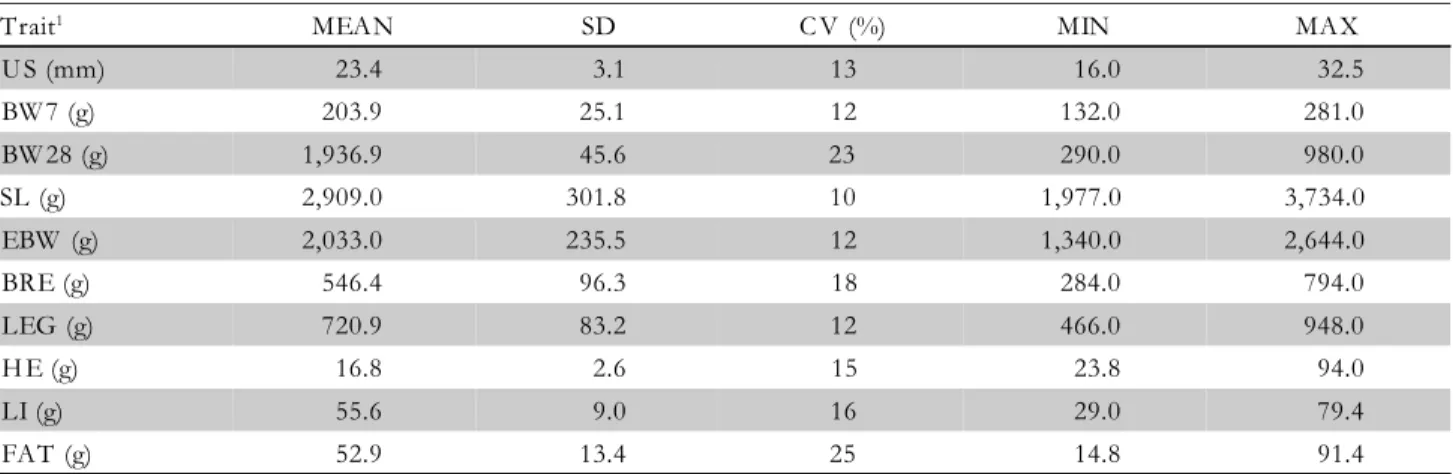
Num-Table 1 – Mean (MEAN), standard deviation (SD), coefficient of variation (CV), and minimum (MIN) and maximum (MAX) values for performance, carcass and body composition traits, with n = 3,950 observations.
Trait1 MEAN SD C V (%) MIN MAX
U S (mm) 23.4 3.1 13 16.0 32.5
BW 7 (g) 203.9 25.1 12 132.0 281.0
BW 28 (g) 1,936.9 45.6 23 290.0 980.0
SL (g) 2,909.0 301.8 10 1,977.0 3,734.0
EBW (g) 2,033.0 235.5 12 1,340.0 2,644.0
BRE (g) 546.4 96.3 18 284.0 794.0
LEG (g) 720.9 83.2 12 466.0 948.0
H E (g) 16.8 2.6 15 23.8 94.0
LI (g) 55.6 9.0 16 29.0 79.4
FAT (g) 52.9 13.4 25 14.8 91.4
1US: depth of breast muscle measured by ultrasonography; BW7: live body weight at 7 days of age; BW28: live body weight at 28 days of
age; SL: live body weight at slaughter; EBW: eviscerated body weight; BRE: breast weight; LEG: leg weight; HE: heart weight; LI: liver weight; FAT abdominal fat weight.
Table 2 – Coefficients of partial phenotypic correlation between performance, carcass and body composition traits.
1US: depth of breast muscle measured by ultrasonography; BW7: live body weight at 7 days of age; BW28: live body weight at 28 days of
age; SL: live body weight at slaughter; EBW: eviscerated body weight; BRE: breast weight; LEG: leg weight; HE: heart weight; LI: liver weight; FAT: abdominal fat weight. *Significant at the 5% level.
Trait1 BW 7 BW 28 SL EBW BRE LEG H E LI FAT
U S 0.386* 0.672* 0.555* 0.600* 0.718* 0.405* 0.308* 0.315* 0.079*
BW 7 0.557* 0.401* 0.411* 0.378* 0.342* 0.242* 0.205* 0.073*
BW 28 0.812* 0.821* 0.707* 0.688* 0.410* 0.404* 0.280*
SL 0.967* 0.786* 0.848* 0.508* 0.481* 0.399*
EBW 0.832* 0.857* 0.481* 0.442* 0.374*
BRE 0.680* 0.440* 0.428* 0.188*
LEG 0.421* 0.362* 0.355*
H E 0.490* 0.143*
ber (CN, ratio between the maximum and minimum eigen-value of the correlation matrix) and the eigen-value of the Vari-ance Inflation Factor (VIF). Both the CN and VIF must be lower than 100 and 10, respectively. Besides, the number of eigenvalues (λ) lower than 0.05 (Draper and Smith, 1981) indicate the number of sets of multicollinearity in the data. Moreover, the simultaneous observation of the highly as-sociated variables, with higher load in the last eigenvalue and with higher VIF’s will support the decision to delete the prob-lematic variable (Chatterjee and Hadi, 2006).
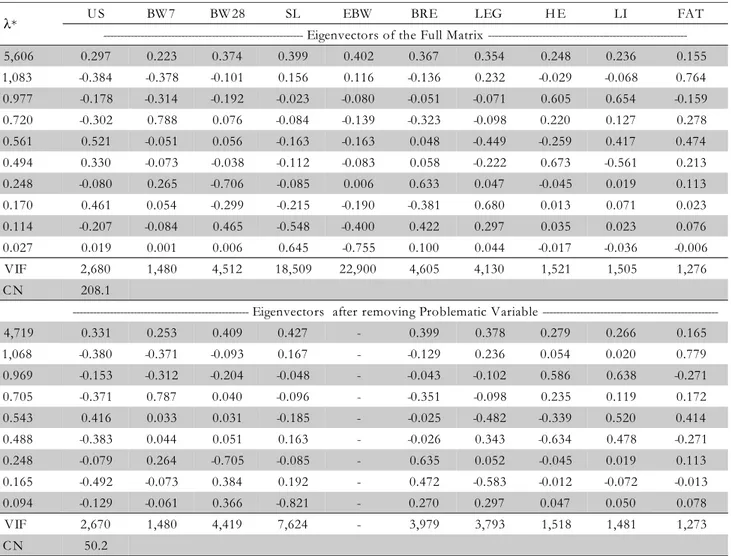
A moderate multicollinearity in the full matrix of partial correlation was identified, with the ten traits given by the condition number 208.1, higher than the acceptable value (Table 3). The lowest eigenvalue of this matrix was 0.02, sug-gesting the presence of multicollinearity in only one set of variables. This set was identified as EBW and BRE, because to them a higher correlation coefficient is associated (Table 2), the higher VIFs (22.89 and 18.51, respectively) and the highest pair of eigenvector of the last eigenvalue (0.645 and -0.755, respectively) (Table 3).
The identification of the degree of multicollinearity is necessary to guarantee a reliable estimate of the coefficients that can be used to make an appropriate and biologically safe interpretation (Coimbra et al., 2005). Based on these esti-mates, the variable Eviscerate Body Weight was deleted, since the Breast Weight is the main variable. The same presented analysis was made without the EBW and no problem was identified, because the CN was lower than 100 (50.2), there are no VIF higher than 10, no eigenvalue near to zero (Table 3), and no set of variables had high weight in the last eigen-value indicating no problem in the posterior analysis, thus, not resulting in misestimating or a lack of biological inter-pretation for the obtained path coefficients.
The expansions of the partial correlation coefficients into direct and indirect effects on the main trait (breast weight) are presented in Table 4. The multiple R-squared value of 0.749 was observed for the standardized equations of the path analysis, indicating that breast weight might be explained in terms of the eight remaining explanatory traits.
Table 3 – Eigenvalues (λi), eigenvectors, Variance Inflation Factor (VIF) and Condition Number (CN), of the full partial
matrix and without the problematic variables.
*Eigenvalues of the partial correlation matrix. US: depth of breast muscle measured by ultrasonography; BW7: live body weight at 7 days of age; BW28: live body weight at 28 days of age; SL: live body weight at slaughter; EBW: eviscerated body weight; BRE: breast weight; LEG: leg weight; HE: heart weight; LI: liver weight; FAT: abdominal fat weight.
λ* U S BW 7 BW 28 SL EBW BRE LEG H E LI FAT
Eigenvectors of the Full Matrix
---5,606 0.297 0.223 0.374 0.399 0.402 0.367 0.354 0.248 0.236 0.155
1,083 -0.384 -0.378 -0.101 0.156 0.116 -0.136 0.232 -0.029 -0.068 0.764
0.977 -0.178 -0.314 -0.192 -0.023 -0.080 -0.051 -0.071 0.605 0.654 -0.159
0.720 -0.302 0.788 0.076 -0.084 -0.139 -0.323 -0.098 0.220 0.127 0.278
0.561 0.521 -0.051 0.056 -0.163 -0.163 0.048 -0.449 -0.259 0.417 0.474
0.494 0.330 -0.073 -0.038 -0.112 -0.083 0.058 -0.222 0.673 -0.561 0.213
0.248 -0.080 0.265 -0.706 -0.085 0.006 0.633 0.047 -0.045 0.019 0.113
0.170 0.461 0.054 -0.299 -0.215 -0.190 -0.381 0.680 0.013 0.071 0.023
0.114 -0.207 -0.084 0.465 -0.548 -0.400 0.422 0.297 0.035 0.023 0.076
0.027 0.019 0.001 0.006 0.645 -0.755 0.100 0.044 -0.017 -0.036 -0.006
VIF 2,680 1,480 4,512 18,509 22,900 4,605 4,130 1,521 1,505 1,276
C N 208.1
Eigenvectors after removing Problematic Variable
---4,719 0.331 0.253 0.409 0.427 - 0.399 0.378 0.279 0.266 0.165
1,068 -0.380 -0.371 -0.093 0.167 - -0.129 0.236 0.054 0.020 0.779
0.969 -0.153 -0.312 -0.204 -0.048 - -0.043 -0.102 0.586 0.638 -0.271
0.705 -0.371 0.787 0.040 -0.096 - -0.351 -0.098 0.235 0.119 0.172
0.543 0.416 0.033 0.031 -0.185 - -0.025 -0.482 -0.339 0.520 0.414
0.488 -0.383 0.044 0.051 0.163 - -0.026 0.343 -0.634 0.478 -0.271
0.248 -0.079 0.264 -0.705 -0.085 - 0.635 0.052 -0.045 0.019 0.113
0.165 -0.492 -0.073 0.384 0.192 - 0.472 -0.583 -0.012 -0.072 -0.013
0.094 -0.129 -0.061 0.366 -0.821 - 0.270 0.297 0.047 0.050 0.078
VIF 2,670 1,480 4,419 7,624 - 3,979 3,793 1,518 1,481 1,273
The direct effects on BRE were mainly caused by US, SL and, to a lower degree, by LEG. The direct effect of US on BRE (0.432), associated with the indirect effect of SL on BRE, via US (0.273), might have been responsible for the high phenotypic correlation obtained between US and BRE. The direct effect of SL on BRE (0.492), associated with the indirect effects of US on BRE (0.240), via SL, was the factor responsible for the high phenotypic correlation obtained be-tween SL and BRE. For LEG, direct and indirect effects on BRE were also found, but to a lower degree in comparison to SL and US.
Aside the positive phenotypic correlations of BW7, BW28, HE, LI and FAT with BRE, their direct effects of these traits were negligible (close to zero). These correlations were there-fore due to the indirect effects of US, SL and LEG on BRE via BW7, BW28, HE, LI and FAT. The effects of BW7 and BW28 over BRE were due to indirect effects of SL, suggest-ing a positive relation of the variable body weight with itself over successive time intervals (autocorrelation), as already re-ported for weight variables in broiler (Mehmet, 2009).
Despite the fact that BW7 and BW28 are usual measures in juvenile phenotypic individual selections in poultry, both are used as animal growth indicators and are correlated posi-tively with BRE. They cannot be considered direct pheno-typic predictors of breast weight, as such an association is the result of the indirect effect of the US and SL traits. This is possibly because bone growth is a priority at the begin-ning of animal’s life, and only later intense muscular and adi-pose growth happen (Lawrie, 1991). Thus, higher weight in young individuals would not be phenotypically associated with a higher deposition of breast muscle in these individuals at slaughter age. SL and US were thus identified as the fac-tors mainly responsible for the magnitude of the correla-tion coefficients obtained between the studied traits and BRE, presenting direct and indirect genetic and/or environmental effects on breast weight. This result is possibly due to the fact that US is found from the longitudinal and transversal accesses of breast muscles measured by ultrasonography, ob-taining the muscle volume, which may be inherently
associ-ated with breast weight. SL is the body weight moments be-fore slaughter, and BRE is measured just after slaughter, and in selected lines, like the analyzed one, the breast weight is proportionally a great part of slaughter weight. As a result, these two traits may be inherently associated. Therefore, path analysis allowed the understanding of which variables affect breast composition directly. SL may thus be considered an important and adequate predictor for BRE and for US.
US presents moderate to high heritability, as Gaya et al. (2006) reported heritability coefficients of 0.28 and 0.29 for the depth of breast muscle measured by ultrasonography. For slaughter weight in chicken, heritability coefficients be-tween 0.24 and 0.37 have been reported (Le Bihan-Duval et al., 1999; Gaya et al., 2006; Vayego et al., 2008). These values indicate that the individual pre-selection for any of these traits could lead to a good response in the selection, since they have additive genetic components in their expression. Therefore, individual pre-selection for SL or US might bring more ef-fectively increase BRE than pre-selection of the other traits. This is possible because SL and US present moderate to high heritabilities (Morris and Pollott, 1997; Rishell, 1997) and an important phenotypic cause-effect relationship with BRE. This means that they are of the same genetic and/or ronmental origin (Van Vleck et al., 1987), and if the envi-ronmental conditions are maintained (Willis et al., 1991; Morris and Pollott, 1997), we could use phenotypic selection for SL or US as a pre-selection recourse, which can be useful for the breeding of this broiler line and for other broiler breeding programs. However, the use of individual pre-se-lection for US especially is recommended, as its evaluation can be performed early (38 days of age) and in vivo for check-ing the breast measures, which may be used as an alternative to slaughtering. SL is also an adequate predictor for BRE, but it is an expensive trait to measure, since, as is the case for BRE, gathering data on SL requires slaughtering the birds.
Aside its use for vegetables and other areas, path analy-sis may be used to identify traits with a direct influence on economic traits in broilers. The phenotypic selection (massal
Table 4 – Estimation of path coefficients of the effect of the depth of breast muscle measured by ultrasonography (US), live body weight at 7 days of age (BW7), live body weight at 28 days of age (BW28), live body weight at slaughter (SL), leg weight (LEG), hearth weight (HE), liver weight (LI), and abdominal fat weight (FAT) on breast weight.
Explanatory traits
Direct effects U S BW 7 BW 28 SL LEG H E LI FAT
0.432 0.006 -0.095 0.492 0.158 0.023 0.033 -0.080
Indirect effects via
U S - 0.167 0.290 0.240 0.175 0.133 0.136 0.034
BW 7 0.002 - 0.003 0.002 0.002 0.001 0.001 0.000
BW 28 -0.064 -0.053 - -0.077 -0.066 -0.039 -0.039 -0.027
SL 0.273 0.197 0.400 - 0.417 0.250 0.237 0.196
LEG 0.064 0.054 0.109 0.134 - 0.066 0.057 0.056
H E 0.007 0.006 0.009 0.012 0.010 - 0.011 0.003
LI 0.011 0.007 0.014 0.016 0.012 0.016 - 0.004
FAT -0.006 -0.006 -0.022 -0.032 -0.028 -0.011 -0.010
selection) in broilers could, so, be used in the analyzed line, as commonly used in poultry breeding industries (Emmerson, 1997; Bijma et al., 2000; McMillan and Quinton, 2002; Loywyck et al., 2005). The massal selection may be ac-complished prior to reproductive age (Bijma et al., 2000) and could also bring rapid responses for several economic traits in broiler breeding programs (Emmerson, 1997; Morris and Pollott, 1997; Rishell, 1997). After a pre-selection in the stud-ied line, the genetic evaluation for sire and dam candidates and the definition of selection criteria by BLUP would be made (McMillan and Quinton, 2002). Then, only the broil-ers that present a first evaluation of superiority would be maintained in the flock, and in the genetic selection process, and path analysis could indicate what selection criteria are to be used in pre-selection that can be directly associated with traits of economic interest.
Conclusion
The simultaneous maintenance of live body weight at slaughter and eviscerated body weight in the matrix of cor-relations might be harmful to statistical analysis involving systems of normal equations in the analyzed line due to the resulting multicollinearity. For broilers raised in environmen-tally controlled housing, it is possible to use the slaughter weight and the depth of breast muscle measured by ultra-sonography for individual pre-selection to favor breast weight in the analyzed line. The depth of breast muscle measured by ultrasonography is the most feasible. Juvenile body weight and body composition traits in the analyzed line are not di-rectly phenotypically associated with breast weight; conse-quently, the individual pre-selection of broilers for these traits could not favor a direct increase of breast weight. Path analy-sis can contribute to the understanding of the composition of traits of economic interest, indicating the most useful traits for accomplishing pre-selection.
References
Bijma, P.; Van Arendonk, J.A.M.; Woolliams, J.A. 2000. A general pro cedure for predi cting rates of i nbree ding in pop ulati ons undergoing mass selection. Genetics 154: 1865-1877.
Carg nelutt i Filh o, A.; Maluf, J.R.T.; Mat zenauer, R.; Stolz A.P. 2006. Altitude and geographic coordinates in the ten-day mean minimum air temperature estimation in the State of Rio Grande do Sul, Brazil. Pesquisa Agropecuária Brasileira 41: 893-901. (in Portuguese, with abstract in English).
Chatterjee, S.; Hadi, A.S. 2006. Regression analysis by exemple. 4ed. John Wiley, Hoboken, NJ, USA.
Che verud , J.M . 1988. A comp ariso n of genet ic and ph enoty pic correlations. Evolution 42: 958-968.
Coimbra, J.L.M.; Benin, G.; Vieira, E.A.; Oliveira, A.C.; Carvalho, F.I.F.; Guidolin, A.F.; Soares, A.P. 2005. Multicolinearity consequence on path analysis in canola. Ciência Rural 35: 347-352. (in Portuguese, with abstract in English).
Cruz, C.D. 1998. GENES: software for experimental statistics in ge net ics. Genet ics an d M ole cul ar Bio log y 21: 135-138. ( in Portuguese, with abstract in English).
Draper, N.R.; Smith, R. 1981. Applied Regression Analysis. John Wiley, New York, NY, USA.
Emmerson, D.A. 1997. Commercial approaches to genetic selection for g rowth and feed conversion in domestic poultry. Poultry Science 76: 1121-1125.
Ferreira, F.M.; Barros, W.S.; Silva, F.L.; Barbosa, M.H.P.; Cruz, C.D.; Bastos, I.T. 2007. Phenotypic and genetic relationships among yi eld co mpo nent s i n sugarcane. Braganti a 66: 605-610. ( in Portuguese, with abstract in English).
Gaya, L.G.; Ferraz, J.B.S.; Rezende, F.M.; Mourão, G.B.; Mattos, E.C.; El er, J.P.; Mi che lan Fil ho, T. 2006. He rit abi lit y and Gene tic Correlatio n Estimates fo r Perfo rmance and Carcass and Body Composition Traits in a Male Broiler Line. Poultry Science 85: 837-843.
Go ndi m, T.C.O.; R och a, V.S .; Sed iyama, C.S.; Mi ran da, G.V. 2008. Path analysis for yield components and agronomic traits of wheat under defoliation. Pesquisa Agropecuária Brasileira 43: 487-493. (in Portuguese, with abstract in English). Johnson, R.A.; Wichern, D.W. 1998. Applied Multivariate Statistical
Analysis. 4ed. Prentice-Hall, Upper Saddle River, NJ, USA. Kaps, M.; Lamberson, W.R. 2004. Bioestatistics for Animal Science.
CABI, Cambrid ge, MA, USA.
Lawrie, R.A. 1991. Meat Science. 5ed. Pergamon Press, New York, NY , US A.
Le Bihan-Duval, E.; Millet, N.; Remignon, H. 1999. Broiler meat qual ity: ef fect o f selec tion fo r incre ased carcass quality and estimates of genetic parameters. Poultry Science 78: 822-826. Loywyck, V.; Bijma, P.; Pinard van der-Laan, M.H.; Arendonk, J.;
Verrier, E. 2005. A comparision of two methods for prediction of response and rat es of i nbreedi ng in selected populat ions with the results obtained in two selection experiments. Genetics, Selection, Evolution 37: 273-289.
Marchezan, E.; Martin, T.N.; Santos, F.M.; Camargo, E.R. 2005. Path coefficient analysis of rice yield components. Ciência Rural 35: 1027-1033. (in Portuguese, with abstract in English). McMillan, I.; Quinton, V.M. 2002. Selection strategies for limiting
th e i ncrease i n ascit es whi le inc reasin g g rowt h i n b roi lers. Poultry Science 81: 737-744.
Mehmet, M. 2009. Growth curves for body weight and some body measurement of Ross 308 broiler chickens. Journal of Applied Animal Research 36: 85-88.
Morris, A.J.; Pollott, G.E. 1997. Comparison of selection based on phenotype, selection index and best linear unbiased prediction using data from closed broiler line. British Poultry Science 38: 249-254.
Rance, K.A.; McEntee, G.M.; McDevitt, R.M. 2002. Genetic and ph eno typ ic rel ati onship s b etween an d with in sup port and demand tissues in a single line of broiler chicken. British Poultry Science 43: 518-527.
Rao, D.C.; Rice, T. 1998. Path analysis in genetics. p. 3285-3297. In: Armitage, P.; Colton, T., eds. Encyclopedia of biostatistics. vol. 4. Wiley, Sussex, UK.
Rishell, W.A. 1997. Symposium: genetic selection; strategies for the future breeding and genetics; historical perspective. Poultry Science 76: 1057-1061.
Statistical Analysis System [SAS]. 1999. Statistical Analysis Systems User’s Guide: Version 8. SAS Institute, Cary, NC, USA. Schmidt, G.S.; Figueiredo, E.A.P.; Ledur, M.C. 2006. Genetic gain
for body weight, feed conversion and carcass traits in selected broiler strains. Revista Brasileira de Ciência Avícola 8: 29-32. Snede cor, G.W.; Cochran, W.G. S tatistic al Method s. 1989. 8ed.
Iowa State University Press, Ames, IA, USA.
Van Vleck, L.D.; Pollak, E.J.; Oltenacu, E.A.B. 1987. Genetics for the animal sciences. W. H. Freeman, New York, NY, USA.
Vayego, S.A.; Dionello, N.J.L.; Figueiredo, E.A.P. 2008. Estimates of genetic parameters and trends for performance traits in paternal broiler lineages under selection Revista Brasileira de Zootecnia. 37: 1230-1235. (in Portuguese, with abstract in English). Willis, J.H.; Coyne, J.A.; Kirkpatrick, M. 1991. Can one predict the
evolution of quantitative characters without genetics? Evolution 45: 441-444.