A R C H I V E S
o f
F O U N D R Y E N G I N E E R I N G
Published quarterly as the organ of the Foundry Commission of the Polish Academy of Sciences
ISSN (1897-3310)
Volume 8
Issue 4/2008
9 – 14
1/4
Calorimetric and Mössbauer spectroscopy
examinations of ADI
F. Binczyk
a,*, A. Hanc
b, A. Kowalski
ca
Department of Metal Alloys and Composites Engineering, Silesian University of Technology,
Krasi
ń
skiego Str. 8, 40-019 Katowice, Poland
b
Institute of Materials Science, University of Silesia, Bankowa Str. 12
,
40-007 Katowice, Poland
c
Foundry Research Institute, Zakopia
ń
ska Str. 73, 30-418 Kraków, Poland
*
Corresponding author. E-mail address: franciszek.binczyk@polsl.pl
Received 23.06.2008; accepted in revised form 27.06.2008
Abstract
The study presents a new approach to the mechanism of isothermal transformation in ADI. The discussion was based on the results of calorimetric analysis of the thermal effects that take place in the specimen when heated after austempering and on the results of analysis of the phase composition of cast iron examined by Mössbauer spectroscopy. The examinations were carried out on specimens taken from
casting of 60 mm diameter subjected to austempering at 280, 330 and 380oC. Upon heating, on the DSC diagram, a strong exothermic
effect of about 20oC range was observed to take place (it was not observed in the common cast iron), and its beginning, depending on the
austempering temperature, fell to the range of 469 to 490oC. The heat of this effect was proportional to the austenite content in matrix. The
Mössbauer examination of phase composition in a specimen „frozen” from 650oC revealed the decay of austenite and the appearance of
products of its decomposition, i.e. α3 ferrite and Fe2,4C type carbides. So, it has been concluded that the exothermic effect present upon
heating of cast iron during austempering (and due to the decomposition of austenite) should correspond to the endothermic effect due to
the energy absorption necessary for carbon to be „retained” in γst austenite during stage I of the transformation (γo→γst + α1).
Keywords: Mössbauer spectroscopy, Scanning calorimetric, Austenite, Ferrite, Carbides
1. Introduction
Very advantageous mechanical properties of ADI (Austempered Ductile Iron) are due to a unique metallic matrix of this cast iron, composed of carbon-saturated austenite and ferrite.
The morphology of this matrix depends on the heat treatment parameters, i.e. on the temperature and time of austenitising treatment and austempering [1-3]. The mechanical properties of ADI depend to a great extent on the starting chemical composition and morphological features of matrix and graphite (the content and size) [4]. Though the effect of cast iron austempering is well-known, the thermal effects leading to the formation of ausferritic matrix have not been explained so far. Because of quite specific
effect spectroscopy [8, 9]. The Mössbauer effect spectroscopy
uses the changing capacity to transmit γ rays and energy emitted
during nuclear transitions of absorbent, depending on the type of chemical bonds and crystal structure.
The high energy resolution of the Mössbauer effect enables detecting a relatively weak effect of the crystallochemical environment on the energy levels of atomic nuclei. It helps drawing conclusions on atomic movements in the crystal lattice, on the behaviour of dopant atoms and the nature of chemical bonds, and on the valency and ionic coordination; it also enables investigation of the internal magnetic fields and electric field gradients acting on the atomic nuclei in crystals [10, 11].
2. Materials and methods of investigation
Tests were made on ductile iron containing: 3,75 % C, 2,55% Si, 0,19% Mn, 0,08% Mg, 0,62 % Cu, 1,42% Ni and 0,008% S as well as 0,03% P. Bars of 10, 20, 40 and 60 mm diameter were cast and used for specimens subjected later to heat treatment. The
austenitising process was carried out at the temperature of 900oC
for 2h. Austempering was made in a salt bath (50% KNO3 and
50%NaNO3)at the temperatures of 280, 330 and 380
o
C. After this process, specimens were taken for calorimetric examinations and for evaluation of phase composition by the Mössbauer spectroscopy.
The thermal effects related with phase transformations were investigated on a differential scanning calorimeter, type Multi
HTC S60. Its construction and principle of operation were described in [5, 6]. The specimens for calorimetric examinations were taken from casting of 60 mm diameter. The specimens had similar weight comprised in the range of 310 to 340 mg.
Tests were carried out under argon atmosphere at the heating
and cooling rate of 10oC/min. The specimens were heated to the
temperature of 880oC (above the point of eutectoid
transformation) and up to 650oC (below the point of eutectoid
transformation), and were held at that temperature for about 20
minutes. The experiment of double heating up to 650oC was also
carried out.
The Mössbauer investigations were carried out by CEMS (Conversion Electron Mossbauer Spectroscopy) technique. It enabled examinations of a surface layer about 100 nm thick. Gas detector, volume-filled (0.98% He +0.02% Ar) at a pressure of 0.9
At, was applied. The source of Mössbauer radiation was Co57/Rh
of about 10 mCi activity. The measurements were carried out on specimens after austempering (ADI) and on a specimen subjected
to double heating up to the temperature of 650oC.
3. The results of investigations
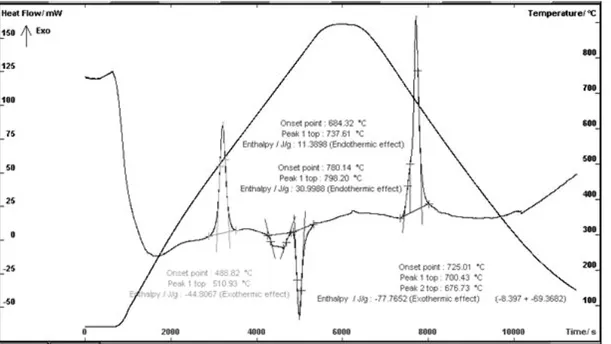
An example of the calorimetric DSC curve plotted for a
specimen heated to 880oC (the temperature above the eutectoid
point of transformation) and cooled after austempering at 380oC is
shown in Figure 1
.
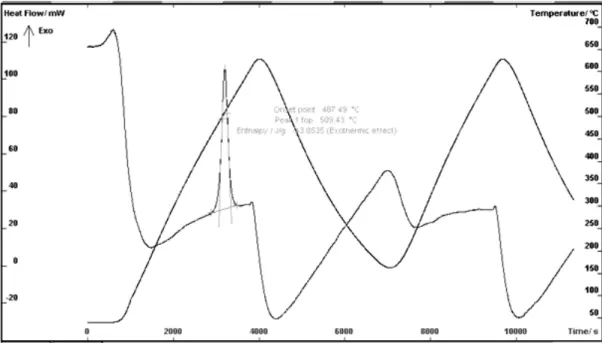
Fig. 2. The DSC diagram for specimen 6 after 2x650oC of heating and cooling
From diagram plotted in Figure 1 it follows that the endothermic effects present on heating and accompanying the
eutectoid transformation (700 to 800oC) become exothermic in
nature on cooling. Compared with the DSC diagram plotted for ductile iron before austempering [12], the heating curve reveals a strong exothermic effect at a temperature well above 460°C. The same effect but characterised by lower energy occurs in
specimens after austempering at 280oC and 330oC. The
appearance of the exothermic effect on heating suggests that during austempering of base cast iron a process related with heat absorption by the specimen (the endothermic effect) takes place. To exclude the effect of eutectoid transformation, two experiments were carried out. They consisted in single and
double heating of the specimen up to 650oC followed by
cooling. The DSC diagram after double heating cycle and cooling is plotted in Figure 2.
The values of temperature range and of the exothermic effect read out from the DSC curves for individual experiments are shown in Table 1.
Table 1.
The temperature and thermal effect of transformation
Specimen State T1, oC T2, oC Q, J/g
1 as- cast no data available
2 Austempering at
280oC
468 490 -21,46
3 Austempering at
330oC
480 500 -38,55
4 Austempering at
380oC
489 511 -44,81
5 specimen 4 +
1x650oC
488 510 -44,14
6 specimen 4 +
2x650oC
488 510 -43,85
T1 - initial temperature, T2 - end temperature
Examples of solutions of Mössbauer spectrum for specimen
after austempering at 380oC and additional double heating up to
650oC are shown in Figures 3 and 4.
-8 -6 -4 -2 0 2 4 6 8
V,mm/s
E
m
issi
o
n
exp Z1 Z2 Z3 Q L
Fig. 3. Solution of Mössbauer spectrum for specimen after
austempering at 380oC
-8 -6 -4 -2 0 2 4 6 8
V, mm/s
E
m
issi
on
exp. Z1 Z2 Z3 Z4
Fig. 4. Solution of Mössbauer spectrum for specimen after
The phase composition of metallic matrix examined by Mössbauer spectroscopy was determined by discrete analysis of the experimental Mössbauer spectra using an MOSDS program. In this program, the shape of Mössbauer spectrum is described by a transmission integer computed according to Gauss-Legandre numerical procedure. The program enables very accurate determination of the following parameters:
• isomer shift - (IS),
• quadrupole splitting - (QS),
• hyperfine effective magnetic field - (H),
• intensity of fitted components - (S).
Using this program and a numerical analysis, the deconvolution (decomposition) of the experimental spectrum into its components (subspectra) related with the local
environment of Mössbauer 57Fe nuclide was carried out. Due to
this, it was possible to analyse the phase composition of the
examined material. Using a set of parameters, i.e. IS, QS, H, describing the individual components (subspectra), it was possible to identify the magnetic and non-magnetic phases (the IS and QS parameters only).
For specimen after austempering at 380oC (Fig. 3), three
magnetic components (Zeeman components) designated as Z1, Z2 and Z3 and two non-magnetic components (single line L and a quadrupole doublet Q) were distinguished.
In the solution of a spectrum obtained for specimen after
additional double heating to 650oC, the fourth magnetic
component Z4 was detected, while components L and Q from the non-magnetic phase disappeared. The phase compositions of the specimens computed from the intensities of individual component spectra were designated as S and compiled in Table 2.
Table 2.
Phase compositions computed for the metallic matrix of the examined specimens State Spectrum
component H kGs
IS mm/s
QS mm/s
S -
Structural constituent
Fraction %
Z1 323,9 0,023 0,009 0,75 Ferrite α1 75
Z2 294,0 0,032 0,011 0,11 Ferrite α2 11
Q - 0,18 0,276 0,08 Austenite 14
Specimen 2 Austempered
at 280
oC
L - -0,12 - 0,06
Z1 327,3 0,009 0,017 0,64 Ferrite α1 63
Z2 284,2 0,032 0,014 0,12 Ferrite α2 12
Z3 189,7 0,14 0,03 0,05 Carbides 5
Q - 0,19 0,48 0,14 Austenite 20
Specimen 3 Austempered
at 330
oC
L - -0,14 - 0,06
Z1 332,1 0,02 0,026 0,45 Ferrite α1 45
Z2 294,6 0,03 0,021 0,14 Ferrite α2 14
Z3 262,1 0,16 0,024 0,06 Carbides 6
Q - 0,13 0,191 0,31
Specimen 4 Austempered
at 380
oC
L - -0,09 - 0,04
Austenite
35
Z1 309.8 0,04 0,07 0,16 Ferrite α1 16
Z2 276,4 0,16 0,13 0,31 Ferrite α3 31
Z3 189.7 0,11 0.16 0,29 Carbides 29
Specimen 4
and 2x650oC
heating and
cooling Z4 224,3 0,18 0,11 0,24 Carbides 24
Note: The values stated above were determined for the following error intervals:
ΔH = +/-0,2 kGs, ΔIS = ΔQS = +/-0,002 mm/s and ΔS = +/-0,2
Basing on the data given in literature [13] and on the analysis of the calculated values of the parameters of hyperfine interactions, i.e. isomer shift IS, quadrupole splitting QS, and hyperfine magnetic field H, it has been concluded that the Zeeman
component Z1 has its source in 57Fe atoms, present in the
structure of α1 ferrite, which is formed during stage I of the
isothermal transformation (γo→α1 + γst,). The Zeeman
component Z2 originates from α2 ferrite (a product of γst→α2 +
carbides transformation), whereas the component Z3 originates
from 57Fe atoms present in the structure of carbides (Fe3C or
Fe2C).
On the other hand, the magnetic component Z4 can serve as an
evidence of the presence of Fe2,4C carbide in the specimen. This
statement is further supported by a comparison of the values of hyperfine parameters (obtained for a stoichiometric composition
of Fe3C and Fe2C carbides) with the values of IS and QS
obtained for component Z4 and amounting to 0,18 and 0,11, respectively.
An analysis of the parameters (specimen 4 after austempering) describing the non-magnetic components (L and
Q) indicates that they are typical of the stable γst austenite
saturated with carbon and formed at stage I of the isothermal
transformation (γo→α1 + γst). Differences in the values of the
parameters H, IS and QS for given phase constituents (e.g.
Fe3C, Fe2C or Fe2,4C carbides acting as pearlite constituents)
may be due to different morphologies, to the effect of hyperfine
magnetic field H from α1 and α2 ferrite, and to the presence or
4. Discussion of results
The aim of the studies was to explain the phenomena that take place during austempering and that are responsible for the formation of ausferritic matrix, the presence of which ensures a complex of very advantageous mechanical properties in ADI. Concerning the above, the following questions were asked:
1. Of what type are the thermal effects that accompany the formation of austenite during austempering? 2. Is this transformation similar to the eutectoid
transformation on cooling, which is of exothermic character?
On the DSC curve plotted for ADI specimen during heating (Fig. 1) there are two endothermic effects related with transformation of pearlite into austenite and one strong exothermic effect which does not occur in the as-cast iron. The
exothermic effect is of about 20oC range and, depending on the
austempering temperature, its beginning falls to the range of 468
to 489oC. A comparison of temperature ranges and exothermic
effect values with the austenite content in matrix (Table 2) in function of the austempering temperature is shown in Figure 5. The relationships are of a similar character, especially changes in the values of exothermic effect and of austenite content. So, it can be assumed that the occurrence of an exothermic effect on the DSC diagram during heating is related with austenite.
460 475 490 505 520
230 280 330 380 430
Austempering temperature, oC
Tra
nsf
orma
tion t
e
mper
at
ure
,
oC
10 20 30 40 50
H
eat
(-H)
,
J
/g
, A
u
st
eni
te,
%
T1, °C T2, °C ciepło (-H), J/g % austenite
Fig. 5. Austenite content in matrix vs heat of exothermic effect
The exothermic effect also appears on the DSC curve of a
specimen heated to 650oC, i.e. below the point of eutectoid
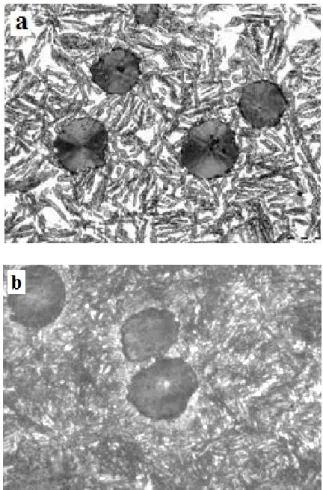
transformation, although it takes place only during the first heating cycle. No other thermal effects take place during cooling and reheating. Hence it may be concluded that the process is of an irreversible nature and its exothermic character indicates the decomposition of one of the metallic matrix constitutents; in this particular case it will be austenite. The conclusion is further confirmed by a comparison of the specimen microstructure before and after heating to the
temperature of 650oC, and so below the range of eutectoid
transformation, as shown in Figure 6. One can observe some important changes in the matrix, which from ausferritic passes into pearlitic with small amounts of free ferrite.
Fig. 6. Comparison of ADI microstructures: a) after
austempering at 380oC, b) after heating to 650oC
Summing up the results of calorimetric and Mössbauer spectroscopy examinations, the following facts should be stressed:
1. The content of austenite in metallic matrix increases with increasing temperature of austempering.
2. On the DSC diagram of an ADI specimen subjected to
heating there is a strong exothermic effect of about 20oC
range; depending on the austempering temperature, its
beginning falls to the range of 468 to 489oC.
3. No such effect has been observed in common grey and ductile cast irons [5, 6].
4. The initial temperature of exothermic effect increases proportionally to the austempering temperature.
5. The calorific value of the exothermic effect increases proportionally to the austenite content increasing in ausferritic matrix.
6. The exothermic effect is irreversible as proved by the DSC
curves plotted from the experiments of single and double
heating of the ADI specimens to the temperature of 650oC,
i.e. below the pearlite eutectoid transformation.
8. In specimens heated to 650oC total absence of the non-magnetic components Q and L was stated. This fact excludes the presence of a non-magnetic phase (austenite in this particular case) in matrix.
9. For this specimen, the spectrum revealed the presence of an
additional component Z4. From a comparison of the values of hyperfine parameters (for the stoichiometric
composition of Fe3C and Fe2C carbides) with the values of
IS and QS obtained for the component Z4 (the values of 0,18 and 0,11, respectively) one can conclude about the
presence of Fe2,4C carbide in the specimen.
10. The magnetic component Z3 proves the presence of Fe3C
cementite as a pearlite constitutent. The high value of QS (0,16) may prove disturbances in the concentrations of Fe and C, and hence changes in the crystal lattice of cementite.
11. The component Z1 results from the presence in specimen
of an α1 ferrite, while the magnetic component Z2 probably
describes a metastable ferrite α3 (high values of IS and QS,
i.e. 0,16 and 0,13, respectively), formed from the austenite decomposition on heating of the specimen. The decomposition of austenite is accompanied by an exothermic effect visible on the DSC diagram.
5. Resume
Considering the above mentioned facts it can be concluded that the exothermic effect observed on the heating curve is due
to the decomposition of γst austenite, formed during
austempering of austenite.
So, the answers to the questions put in the article are as follows:
Answer 1:
The formation of austenite during austempering is a metastable process of an endothermic character. It is probably due to the fact that retaining excess carbon in the crystal lattice
of γst austenite is related with absorption of external energy
following the mechanism:
γ→γst + ferrite (α1) (+Q1)
On heating, at a temperature depending on the conditions of austempering, the metastable austenite undergoes a decomposition, while the excess accumulated energy is given away according to the following mechanism:
γst → ferrite (α3) + carbides (Fe2,4C) (-Q2)
Answer 2:
The mechanism is different as it is not accompanied by the formation of iron carbides and the transformation is of a partial character only:
γ→α.
Only when the critical time of austempering is exceeded, the
exothermic process of γst austenite decomposition takes place
according to the following mechanism:
γst → ferrite (α2) + carbides (Fe3C or Fe2C) (-Q2)
This means that we should exclude the possibility of an exothermic effect taking place on heating of ADI along with the process of carbon precipitation from saturated austenite, or with the effect of stresses being relieved in the crystal lattice of austenite. If this happened, austenite should be present in specimens after cooling to room temperature.
References
[1] J. Piaskowski, A. Jankowski, Nodular cast iron, WNT, Warsaw, 1974 (in Polish).
[2] E. Guzik, Some selected problems concerning the processes of cast iron improvement, Archives of Foundry, No. 1M, (2001) (in Polish).
[3] F. Binczyk, Constructional casting alloys. Silesian Technical University, Gliwice, 2003 (in Polish).
[4] D. Myszka, Structural research of direct austempered ductile irons obtained in sand mould, Archives of Foundry, vol.1, No. 1(2/2), (2001), 263-270 (in Polish). [5] F. Binczyk, R. Przeliorz, J. Furmanek, J. Kulasa, The
definition of scanning calorimetric method the enthalpy of phase change in nodular cast iron, Archives of Foundry, No. 19, (2006), 31-36 (in Polish).
[6] F. Binczyk, J. Furmanek, R. Przeliorz, The definition of scanning calorimetric method the enthalpy of the phase change in al;-grey cast iron, Archives of Foundry, No. 22, (2006), 49-55 (in Polish).
[7] F. Binczyk, J. Furmanek, A. Smoliński, Calorimetric
examinations of austempered ductile iron ADI, Archives of Foundry Engineering, Vol. 7, Issue 4, (2007). pp. 5-8. [8] A. K. Sinha, Physical metallurgy handbook. The
McGraw-Hill Companies, Inc. (2003).
[9] Z. Nishiyama, Martensitic transformation. Academic Press, edited by M.E. Fine, M. Meshii, C.E. Wayman, 1978.
[10] A. Oleś, The methods of solid-state physics. Issue 2, WNT,
Warszawa (1998) (in Polish).
[11] A. Hrynkiewicz, D. Kuglawczuk, Mössbauer
Spectroskopy, Geologiy Publ., Warsaw (1988) (in Polish).
[12] F. Binczyk, A. Hanc, A. Kowalski, Austempering
transformation kinetics of ADI iron obtained by Mössbauer Spectroscopy, Archives of Foundry Engineering, vol. 8, Issue 3, (2008), pp.15-21.