ACPD
10, 4143–4188, 2010Impacts of HONO sources on the photochemistry in
Mexico City
G. Li et al.
Title Page
Abstract Introduction
Conclusions References
Tables Figures
◭ ◮
◭ ◮
Back Close
Full Screen / Esc
Printer-friendly Version
Interactive Discussion Atmos. Chem. Phys. Discuss., 10, 4143–4188, 2010
www.atmos-chem-phys-discuss.net/10/4143/2010/ © Author(s) 2010. This work is distributed under the Creative Commons Attribution 3.0 License.
Atmospheric Chemistry and Physics Discussions
This discussion paper is/has been under review for the journal Atmospheric Chemistry and Physics (ACP). Please refer to the corresponding final paper in ACP if available.
Impacts of HONO sources on the
photochemistry in Mexico City during the
MCMA-2006/MILAGO Campaign
G. Li1,2, W. Lei1,2, M. Zavala1, R. Volkamer3,4, S. Dusanter5, P. Stevens5, and L. T. Molina1,2
1
Molina Center for the Energy and the Environment, La Jolla, CA 92037, USA 2
Massachusetts Institute of Technology, Cambridge, MA 02139, USA 3
Department of Chemistry, University of Colorado at Boulder, 215 UCB, Boulder, CO 80309, USA
4
Cooperative Institute for Research in the Environmental Sciences (CIRES), University of Colorado at Boulder, 216 UCB, Boulder, CO 80309, USA
5
Center for Research in Environmental Science, School of Public and Environmental Affairs, and Department of Chemistry, Indiana University, Bloomington, IN 47405, USA
Received: 14 January 2010 – Accepted: 19 January 2010 – Published: 11 February 2010
Correspondence to: G. Li (lgh@mce2.org)
ACPD
10, 4143–4188, 2010Impacts of HONO sources on the photochemistry in
Mexico City
G. Li et al.
Title Page
Abstract Introduction
Conclusions References
Tables Figures
◭ ◮
◭ ◮
Back Close
Full Screen / Esc
Printer-friendly Version
Interactive Discussion
Abstract
The contribution of HONO sources to the photochemistry in Mexico City is investigated during the MCMA-2006/MILAGO Campaign using the WRF-CHEM model. Besides the homogeneous reaction of NO with OH, four additional HONO sources are consid-ered in the WRF-CHEM model: secondary HONO formation from NO2heterogeneous
5
reaction with semivolatile organics, NO2 reaction with freshly emitted soot, NO2
het-erogeneous reaction on aerosol and ground surfaces. The WRF-CHEM model with the five HONO sources performs reasonably well in tracking the observed diurnal variation of HONO concentrations. The HONO sources included are found to significantly im-prove the HOx(OH+HO2) simulations during daytime and the partition of NO/NO2 in 10
the morning. The HONO sources also accelerate the accumulation of O3 concentra-tions in the morning by about 2 h and subsequently result in a noticeable enhancement of O3concentrations over the course of the day with a midday average of about 6 ppb.
Furthermore, these HONO sources play a very important role in the formation of sec-ondary aerosols in the morning. They substantially enhance the secsec-ondary organic 15
aerosol concentrations by a factor of 2 on average in the morning, although contribute less during the rest of the day. The simulated nitrate and ammonium aerosols are also remarkably enhanced in the morning when the four HONO sources are added, in good agreement with the measurements. The impact of the HONO sources on the sulfate aerosols is negligible because of the inefficient conversion of H2SO4from SO2reacting 20
with OH.
1 Introduction
Nitrous acid (HONO) plays an important role in the photochemistry of the troposphere, especially in the polluted urban atmosphere, because HONO is a significant photo-chemical precursor of the hydroxyl radical (OH), the key oxidant in the degradation of 25
ACPD
10, 4143–4188, 2010Impacts of HONO sources on the photochemistry in
Mexico City
G. Li et al.
Title Page
Abstract Introduction
Conclusions References
Tables Figures
◭ ◮
◭ ◮
Back Close
Full Screen / Esc
Printer-friendly Version
Interactive Discussion Stemmler et al., 2006; Volkamer et al., 2007). Photolysis of HONO by sun light in the
wavelength range from 300 to 405 nm leads to the production of NO and OH (e.g., Stutz et al., 2000):
HONO+hv→NO+OH (300nm< λ <405nm) (R1) Therefore, the formation and photolysis of HONO cloud enhance the production of 5
ozone (O3) and other secondary pollutants, particularly in the early morning when
other OH sources are less important in the polluted atmosphere (Lammel and Perner, 1988; Harrison et al., 1996; Kurtenbach et al., 2001).
A wide range of HONO concentrations in the atmosphere have been reported, with maximum at night and minimum during daytime (Kleffmann et al., 2006). For example, 10
a maximum of 15 ppb was observed in Los Angeles (Winer and Biermann, 1994) and 10 ppb was measured in Milan, Italy (Febo et al., 1996). High values of HONO (100– 400 ppt) are also detected during the day in urban areas (e.g., Febo et al., 1996) and rural regions (53–110 ppt) (e.g., Staffelbach et al., 1997; Zhou et al., 2002; Acker et al., 2005)
15
The main gas phase source of HONO is the reaction of NO with OH, which frequently fails to explain the observed high daytime and nighttime HONO concentrations (Au-mont et al., 1999; Stafelbach et al., 1997). Although the HONO formation mechanism in the atmosphere is still poorly understood at present, it is well established that het-erogeneous conversion processes of nitrogen dioxide (NO2) on different surfaces are
20
involved (Febo et al., 1987; Svensson et al., 1987; Saliba et al., 2000; Kleffmann et al., 1998; Lammel and Cape, 1996). Direct emissions from vehicles may also play a role in atmospheric HONO levels, depending on vehicle engines and traffic distributions, with a molar emission ratio of HONO/NOx ranging from 10−
4
to 10−2 (Kurtenbach et al., 2001).
25
ACPD
10, 4143–4188, 2010Impacts of HONO sources on the photochemistry in
Mexico City
G. Li et al.
Title Page
Abstract Introduction
Conclusions References
Tables Figures
◭ ◮
◭ ◮
Back Close
Full Screen / Esc
Printer-friendly Version
Interactive Discussion Alicke et al. (2002; 2003) found that the photolysis of HONO produced up to 34% of
the total OH formed during a 24-h period during BERLIOZ in Germany. Volkamer et al. (2007) also showed that photo-induced HONO sources made an important contri-bution to the OH level in the early morning during the MCMA-2003 field campaign in Mexico City.
5
Modeling results reported in the literature indicate that the contribution of HONO to the atmospheric photochemistry depends on multiple conditions, such as NOx con-centration, season, etc. In the pioneering modeling study by Harris et al. (1982) using a trajectory model, various levels of HONO were included in the early morning at the beginning of the simulations. The initial HONO input was found to remarkably enhance 10
the production rate of O3but not significantly influence the maximum O3yield, except under high NOx conditions. Using a box model, Jenkin et al. (1988) found that the
photolysis of HONO in the early morning led to a 50% increase of OH at 06:00 GMT, a 14% increase in the daily maximum OH and a 16% increase in net photochemical O3 production when a heterogeneous HONO source was added. Similar results were also 15
obtained by Kotamarthi et al. (2001) using a box model, showing that HONO formation on aerosols substantially influenced O3, OH, and HO2 concentrations in the polluted planetary boundary layer (PBL). Furthermore, employing a photochemical trajectory model, Clapp and Jenkin (2001) suggested that direct emission of HONO may have an important impact on the level of oxidant (O3+NO2), especially under more polluted 20
conditions. Based on the simulations with a chemical transport model, Lei et al. (2004) concluded that heterogeneous conversion of NO2 to HONO on the surfaces of soot
aerosol accelerated the O3 production by about 1 h in the morning and led to a no-ticeable increase of 7 ppb on average in the daytime O3level. However, in the
simula-tions performed by Aumont et al. (1999) using a two-layer box model, the photolysis of 25
HONO did not contribute significantly to summertime O3concentrations of polluted air masses. Furthermore, Aumont et al. (2003) conducted simulations with a two-layer box model to verify the impact of the photolysis of HONO on the NOx/HOx/O3 chemistry
ACPD
10, 4143–4188, 2010Impacts of HONO sources on the photochemistry in
Mexico City
G. Li et al.
Title Page
Abstract Introduction
Conclusions References
Tables Figures
◭ ◮
◭ ◮
Back Close
Full Screen / Esc
Printer-friendly Version
Interactive Discussion including direct emissions of HONO, NO2 heterogeneous production of HONO on the
ground surface and the aerosol surface. Their simulation results varied with the sea-son: HONO sources were found to slightly influence the NOx/HOx/O3 concentration
profiles during summer, but the photolysis of HONO appeared to be a significant source of OH during winter.
5
As an important contributor of OH in the polluted atmosphere, HONO sources poten-tially affect the formation of secondary aerosols by enhancing the VOC oxidation due to the increased OH level. However, few studies have been conducted to investigate the impacts of HONO sources on the formation of secondary aerosols in the polluted atmosphere.
10
During the MCMA-2006 (Mexico City Metropolitan Area) field campaign as part of the MILAGRO (Megacity Initiative: Local and Global Research Observations) project in March 2006, an extensive data set was obtained, including highly time-resolved ambient gas phase species and aerosols (Molina et al., 2008; 2010), which provides a unique opportunity to investigate the impacts of HONO sources on the photochem-15
istry in a polluted urban area. The objective of the present study is to examine the relative importance of different HONO sources and evaluate their contributions to the HOx/NOx/O3chemistry and secondary aerosols using the WRF-CHEM model based
on the measurements taken during MCMA-2006 field campaign. The WRF-CHEM model and the model configuration are described in Sect. 2. Results of the modeling 20
experiments and comparisons are presented in Sect. 3. The discussion and summary are given in Sect. 4.
2 Model description
2.1 WRF-CHEM model
The WRF Model (Skamarock et al., 2005) is a next-generation mesoscale numerical 25
ACPD
10, 4143–4188, 2010Impacts of HONO sources on the photochemistry in
Mexico City
G. Li et al.
Title Page
Abstract Introduction
Conclusions References
Tables Figures
◭ ◮
◭ ◮
Back Close
Full Screen / Esc
Printer-friendly Version
Interactive Discussion atmospheric research needs. A detailed description of the WRF model can be found
in the WRF web-site http://www.wrf-model.org/index.php.
Additionally, a chemical model is also fully implemented into the WRF model (WRF-CHEM) (Grell et al., 2005; Tie et al., 2007). Based on the framework of the current WRF-CHEM model and the available emissions inventory in Mexico City (Song et 5
al., 2009), a new flexible gas phase chemical module has been developed and im-plemented into the WRF-CHEM model, which can be utilized with different chemical mechanisms, including CBIV, RADM2, and SAPRC. The chemistry is solved by an Eulerian backward Gauss-Seidel iterative technique with a number of iterations, inher-ited from NCAR-HANK (Hess et al., 1999). The short-lived species, such as OH and 10
O(1D), are assumed to be in the steady state. The solution is iterated until all species are within 0.1% of their previous iterative values. For the aerosol simulations, the CMAQ/models3 (version 4.6) aerosol module developed by EPA, which is designed to be an efficient and economical depiction of aerosol dynamics in the atmosphere, has also been incorporated into the WRF-CHEM model (Binkowski and Roselle, 2003). In 15
this aerosol component, the particle size distribution is represented as the superposi-tion of three lognormal sub-distribusuperposi-tions called modes. The processes of coagulasuperposi-tion, particle growth by the addition of mass, and new particle formation are included. In addition, the wet deposition also follows the method used in the CMAQ/models3. Sur-face deposition of chemical species is parameterized following Wesely (1989). The 20
photolysis rates are calculated using the FTUV (Tie et al., 2003; Li et al., 2005). An-thropogenic emissions used in the WRF-CHEM model are constructed from the official emissions inventory for the MCMA-2006 (Song et al., 2009). Biogenic emissions are estimated using the MEGAN v2.04 model (Model of Emissions of Gases and Aerosols from Nature) developed by Guenther et al. (2006, 2007); the on-line biogenic emis-25
ACPD
10, 4143–4188, 2010Impacts of HONO sources on the photochemistry in
Mexico City
G. Li et al.
Title Page
Abstract Introduction
Conclusions References
Tables Figures
◭ ◮
◭ ◮
Back Close
Full Screen / Esc
Printer-friendly Version
Interactive Discussion
2.2 Parameterization of HONO sources
In addition to the homogeneous reaction of NO with OH, four sources of HONO are included: secondary HONO formation from NO2 heterogeneous reaction with semivolatile organics, NO2reaction with freshly emitted soot, NO2 heterogeneous
re-action on aerosols and ground surface. 5
With regard to the secondary HONO formation from NO2 heterogeneous reaction with semivolatile organics, we follow the results of a recent experimental study per-formed by Gutzwiller et al. (2002) and assume that a fraction of 0.023 of the NOx
emitted is heterogeneously converted to HONO. It is worthy to note that the fraction suggested by Gutzwiller et al. (2002) was obtained in diesel exhaust. Considering the 10
emission contributions from diesel engines and the variation in the fraction of NO2 in
NOx emissions in Mexico City, the fraction of 0.023 used in the study is likely an
up-per limit for the HONO formation from NO2 heterogeneous reaction with semivolatile organics.
Ammann et al. (1998) found an efficient conversion of NO2to HONO on suspended
15
soot particles with a reaction probability ranging from 1.1×10⁻²to 3.3×10⁻⁴, but they did not conclude whether the conversion process is catalytic or not. Subsequently, Kalberer et al. (1999) concluded that the NO2 to HONO conversion on soot particles
rapidly saturates because of consumption of the reactive sites. They suggested an upper limit for HONO formation of 1018 HONO molecules mg−1 freshly emitted soot. 20
However, Arens et al. (2001) estimated that the total HONO formation potential of soot particles was about 1.3×10¹⁷ HONO molecules mg−1 of diesel soot, and suggested that the reaction between NO2 and diesel soot particles does not provide a
signifi-cant secondary HONO source in the atmosphere. We employ the value of 1.3×10¹⁷ HONO mg−1of freshly emitted soot to calculate the conversion of NO2to HONO based
25
on the black carbon emissions in the WRF-CHEM model.
Several heterogeneous reactions on different surfaces involving NO2 as a reactant
ACPD
10, 4143–4188, 2010Impacts of HONO sources on the photochemistry in
Mexico City
G. Li et al.
Title Page
Abstract Introduction
Conclusions References
Tables Figures
◭ ◮
◭ ◮
Back Close
Full Screen / Esc
Printer-friendly Version
Interactive Discussion (Febo et al., 1987; Svensson et al., 1987; Saliba et al., 2000; Kleffmann et al., 1998;
Lammel and Cape, 1996):
2NO2+H2O→HONO+HNO3 (R2)
NO+NO2+H2O→2HONO (R3)
NO+HNO3→NO2+HONO (R4)
5
However, most laboratory studies suggest that the reaction of NO2to HONO is first
order in NO2 concentration, thus the HONO formation can be parameterized by the
following reactions (Aumont et al., 2003):
NO2→HONO, ka (R5)
NO2→HONO, kg (R6)
10
Where, ka and kg are the first order rate constants for aerosol and ground surface
reactions, respectively.
For the reaction on aerosols, the first order rate constantkais estimated by
ka=
1 4vNO2
S V
ra (R7)
WherevNO2 is the mean molecular speed of NO2,S/V is the surface to volume ratio,
15
and ra is the reactive uptake coefficient. We use a low value of ra=1×10 −6
at the nighttime (Aumont et al., 2003) and increase it to 5×10⁻⁶ at the daytime (George, 2005; Stemmler et al., 2007; Ndour et al., 2008). With regard to the NO2 reaction on ground surface, the rate constant is calculated by
kg=
1 8vNO2
S V
rg (R8)
ACPD
10, 4143–4188, 2010Impacts of HONO sources on the photochemistry in
Mexico City
G. Li et al.
Title Page
Abstract Introduction
Conclusions References
Tables Figures
◭ ◮
◭ ◮
Back Close
Full Screen / Esc
Printer-friendly Version
Interactive Discussion Where rg is the reactive uptake coefficient of ground surface. According to the
tun-nel measurements and experiments by Kurtenbach et al. (2001), we use a value of rg=1×10−
6
at the nighttime. Stemmler et al. (2006) showed that NO2is effectively
re-duced to HONO on light activated surfaces containing humic acids, soils or selected sythetic aromatic compounds. A relatively large uptake coefficient of 2×10⁻⁵ is sug-5
gested, with dependence on the light intensity. When the sunlight is available and the light density is less than 400 W m−2, the uptake coefficient is set to be 2×10⁻⁵. When the light density is more than 400 W m−2, the uptake coefficient of 2×10⁻⁵ is scaled by a factor defined as (light density)/400. We use an effective surface of 1.7 m2 per geometric surface in the model surface layer to calculate the surface to volume ratio 10
(Vogel et al., 2003).
2.3 Model configuration
Two three-day episodes from 24 to 26 and from 27 to 29 March 2006 are selected in the present study, representing typical “O3-Convection South” and “O3-Convection North”
meteorological conditions in Mexico City, respectively (de Foy et al., 2008). The WRF-15
CHEM model is configured with one grid with spacing of 3 km (99×99 grid points) cen-tered at 19.538◦N and 99◦E (Fig. 1). Thirty-five vertical levels are used in a stretched vertical grid with spacing ranging from 50 m near the surface, to 500 m at 2.5 km Above Ground Level (AGL) and 1 km above 14 km. The modeling system employs the micro-physics scheme of Lin et al. (1983), the Yonsei University (YSU) PBL scheme (Noh et 20
al., 2001), the Noah land-surface model (Chen and Dudhia, 2000), the RRTM longwave radiation parameterization (Mlawer et al., 1997), and a shortwave radiation parameter-ization (Dudhia, 1989). Meteorological initial and boundary conditions are from NCEP 1◦×1◦ reanalysis data. Chemical initial and boundary conditions are interpolated from MOZART 3-h output (Horowitz et al., 2003).
25
ACPD
10, 4143–4188, 2010Impacts of HONO sources on the photochemistry in
Mexico City
G. Li et al.
Title Page
Abstract Introduction
Conclusions References
Tables Figures
◭ ◮
◭ ◮
Back Close
Full Screen / Esc
Printer-friendly Version
Interactive Discussion HONO sources described in Sect. 2.2 are included together with the gas phase
reac-tion. We compare the model results from the H-case and E-case with measurements obtained at the T0 urban supersite (Table 1).
3 Results
3.1 HONO measurements
5
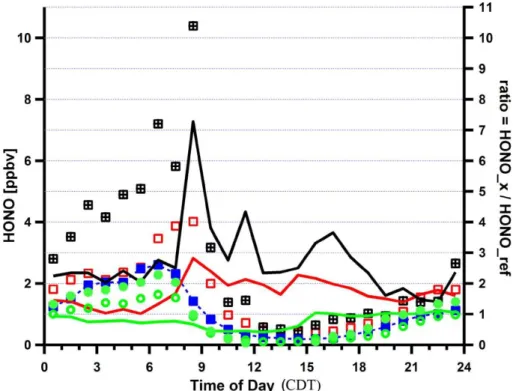
Figure 2 compares diurnal profiles of HONO concentrations measured by LP-DOAS during the MCMA-2003 and MCMA-2006 field campaigns. Two LP-DOAS instruments were deployed at a mean height of 16 m and 70 m above ground at CENICA during MCMA-2003 (Volkamer et al., 2007). During MCMA-2006, the LP-DOAS measured at about 14 m above ground at T0. Mean diurnal profiles are shown for the entire 10
campaign duration for the two instruments from MCMA-2003, and for different data subsets for MCMA-2006. We define the reference case as the mean diurnal profile calculated from measurements for all MCMA-2006 campaign days except the modeling period. If measurements are compared at a comparable mean height of the LP-DOAS light path above ground, the mean HONO diurnal profiles during MCMA-2003 and the 15
reference case agree within 10% at night. Somewhat larger differences are observed during daytime, with up to 50% lower daytime HONO observed during MCMA-2003 compared to the reference case. Vertical concentration gradients can explain up to 40% lower HONO at 70 m compared to 16 m above ground at night during MCMA-2003; this is consistent with HONO formation on urban surfaces as it has been invoked 20
in other studies (Olaguer et al., 2009). The onset of convective vertical mixing of air shortly after sunrise quickly reduced any vertical concentration gradients of HONO in the early morning, and no evidence for vertical gradients was observable 2–3 h after sunrise during MCMA-2003. Figure 2 shows that on a mean basis the combination of horizontal and vertical HONO gradients can explain a variability of up to 50% in HONO 25
ACPD
10, 4143–4188, 2010Impacts of HONO sources on the photochemistry in
Mexico City
G. Li et al.
Title Page
Abstract Introduction
Conclusions References
Tables Figures
◭ ◮
◭ ◮
Back Close
Full Screen / Esc
Printer-friendly Version
Interactive Discussion During the period from 24 to 29 March 2006 HONO was systematically higher than
could be explained based on typical concentration gradients. While nighttime HONO agreed reasonably well with that observed in the reference scenario (with the excep-tion of 29 March), significantly higher HONO was observed primarily during daytime. The mean daytime HONO during 24–29 March was 2–3 times higher than during the 5
rest of the MCMA-2006 field campaign, and 4–5 times higher than during MCMA-2003. Differences were particularly large on 29 March, when nighttime HONO was 2–3 times higher, and daytime HONO was up to 7 times higher than observed during the refer-ence scenario. The largest enhancements in daytime HONO over the referrefer-ence case were observed in the mid-morning, but differences persisted for most of the day. This 10
modeling paper does not attempt to explain why periods of enhanced daytime HONO are observed in the MCMA. Rather, the focus is on the study of the role that such pe-riods can play to accelerate the formation of secondary pollutants such as ozone and secondary aerosol formation within the MCMA. However, it should be emphasized that no events of elevated daytime HONO were observed during MCMA-2003 (Volkamer et 15
al., 2007), and for the most part of MCMA-2006. The frequency with which events of enhanced daytime HONO occur within the MCMA is presently not well established.
3.2 HONO simulations
Figure 3 shows the diurnal variation of the modeled HONO concentrations in the H-case and E-H-case compared with the measurement at T0 from 24 to 29 March 2006. 20
In the H-case with only the gas phase reaction as the HONO source, the HONO con-centrations are underestimated by a factor of 10 on average compared with the ob-servations, particularly during nighttime. The simulation results are fairly consistent with previous studies, which show that the pure gas phase reaction fails to explain the observed high HONO concentrations (Aumont et al., 1999; Stafelbach et al., 1997; 25
Vogel et al., 2003). Additionally, the recent ROx (OH+HO2+RO2) modeling study for
day-ACPD
10, 4143–4188, 2010Impacts of HONO sources on the photochemistry in
Mexico City
G. Li et al.
Title Page
Abstract Introduction
Conclusions References
Tables Figures
◭ ◮
◭ ◮
Back Close
Full Screen / Esc
Printer-friendly Version
Interactive Discussion time if only the homogeneous gas-phase reaction is considered as the HONO source.
Moreover, the simulated peak HONO concentrations in the H-case occur at 0900 CDT, one or two hours later than the observed value.
When the four additional sources of HONO are considered in the E-case, the WRF-CHEM model tracks reasonably well the HONO diurnal variability compared with the 5
measurement. For example, the occurrence of peak HONO concentrations is well repli-cated, and the accumulation of nighttime HONO concentrations and the rapid falloffof morning HONO concentrations are also reproduced. However, the E-case frequently underestimates the HONO levels during the afternoon, particularly on 28 and 29 March, indicating either unawareness of unknown sources or uncertainties from meteorolog-10
ical field simulations. For example, Zhou et al. (2002) speculated that the photolysis of HNO3 might contribute significantly to the missing daytime HONO sources. In the
simulations of Vogel et al. (2003), although the direct emission of HONO and the NO2
heterogeneous reaction on aerosol and ground surfaces were included, the simulated daytime HONO concentrations were also underestimated by 30–50% compared with 15
the observations. An artificial photolytic HONO source had to be introduced to improve the HONO simulations during daytime. In the present study, a photochemical source of HONO on ground surfaces has been incorporated into the WRF-CHEM model with a relatively large uptake coefficient. Meteorological conditions play also a key role in air pollution simulations principally through determining the dispersion or accumulation 20
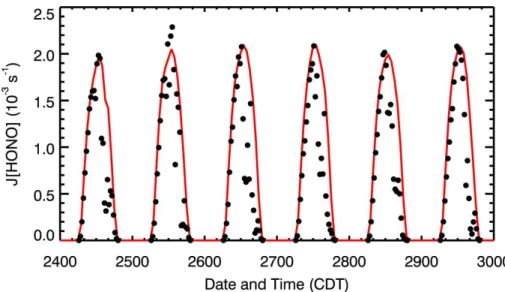
of pollutant emissions and also influencing their lifetime via changing chemical pro-cesses (Bei et al., 2008). Convections were active during the period from 24 to 29 March (de Foy et al., 2009), which may significantly influence the HONO simulation in the WRF-CHEM model. The frequent cumulus cloud formation and development remarkably affect the photolysis rates of HONO. Figure 4 presents the comparison of 25
resolu-ACPD
10, 4143–4188, 2010Impacts of HONO sources on the photochemistry in
Mexico City
G. Li et al.
Title Page
Abstract Introduction
Conclusions References
Tables Figures
◭ ◮
◭ ◮
Back Close
Full Screen / Esc
Printer-friendly Version
Interactive Discussion tion. Therefore, in the afternoon, the WRF-CHEM model frequently overestimates the
HONO photolysis rates, and likely underestimates HONO concentrations during that time. Moreover, the uncertainties in the parameterization of HONO sources used in the study also influence the HONO simulations.
Figure 5a and b presents the comparisons between simulated and observed HONO 5
concentrations (hourly averaged) during nighttime and daytime. In order to further evaluate the performance of the HONO simulation in the H-case and E-case against the measurements at T0, an “index of agreement” (IOA) to describe the relative diff er-ence between the model and observation is calculated during nighttime and daytime (Willmott and Wicks, 1980). IOA is defined as:
10
IOA=1−
N
P
i=1
(pi−oi)2
N
P
i=1
(|pi−o|¯ +|oi−o|)¯ 2
(R9)
wherepi andoi are the simulated and observed variable, respectively. N is the
num-ber of cases and ¯odenotes the average of the observation. The model index ranges from 0 to 1, with 1 indicating perfect agreement between model and observation. Dur-ing daytime, the IOA in the E-case is 0.94, showDur-ing good performance in the HONO 15
simulation in the E-case. However, the E-case has difficulties in the nighttime HONO simulations, with IOA of 0.62. In contrast, whether during daytime or nighttime, the small IOA in the H-case shows the failure of the homogeneous source to interpret the observed high levels of HONO.
The most important HONO source in the E-case is the secondary HONO formation 20
ACPD
10, 4143–4188, 2010Impacts of HONO sources on the photochemistry in
Mexico City
G. Li et al.
Title Page
Abstract Introduction
Conclusions References
Tables Figures
◭ ◮
◭ ◮
Back Close
Full Screen / Esc
Printer-friendly Version
Interactive Discussion than 2%. The model simulations conducted by Aumont et al. (1999) that considered
the deactivation of fresh soot surfaces, also showed that the NO2+soot reaction is not a significant atmospheric source of HONO (Arens et al., 2001). We have used a relatively higher NO2reaction probability on aerosol surfaces during daytime, but the
contribution of HONO at the aerosol surface is still negligible compared to the ground 5
surface, which is in good agreement with the results obtained by Vogel et al. (2003). Near the ground level, the contribution of HONO from the homogeneous source in the E-case is about 5% during daytime, which is inconsistent with the re-sults presented by Dusanter et al. (2009b). Using a box model constrained by the measurements at T0, they calculated the loss rate of HONO from photoly-10
sis to be 11.4×10⁶molecule cm−3s−1 while the production rate from OH+NO is 6.5×10⁶molecule cm−3s−1 on average between 08:40 a.m. and 06:40 p.m. They concluded that the homogeneous source accounts for more than 50% of the HONO formation rate during this time period. In the WRF-CHEM model, HONO is transported and dispersed due to its relatively long lifetime ranging from half an hour in the early 15
morning to around 10 min in the noontime. Particularly, HONO is efficiently mixed in the PBL by the vertical turbulent exchange. The HONO sources of secondary HONO for-mation from NO2reaction with semivolatile organics and NO2reactions with the freshly
emitted soot and ground surface are all included in the surface level in the WRF-CHEM model, hence the three sources play a dominant role in the ground level. If the three 20
sources are assumed to be distributed in the PBL, and considering that the simulated mean PBL height between 08:40 a.m. and 06:40 p.m. is about 1.5 km and the height of the model ground level is about 50 m, the homogeneous source contributes more than 50% to the HONO production, comparable to the box model results from Dusanter et al. (2009b).
25
ACPD
10, 4143–4188, 2010Impacts of HONO sources on the photochemistry in
Mexico City
G. Li et al.
Title Page
Abstract Introduction
Conclusions References
Tables Figures
◭ ◮
◭ ◮
Back Close
Full Screen / Esc
Printer-friendly Version
Interactive Discussion sources on the photochemistry in the following section.
3.3 Impacts on HOx/NOx/O3chemistry
In the polluted urban atmosphere, the major reactions that are responsible for the O3
formation can be described as follows (Brasseur et al., 1999):
OH+RH→R+H2O (R10)
5
R+O2+M→RO2+M (R11)
RO2+NO→RO+NO2 (R12)
RO+O2→HO2+R′CHO (R13)
HO2+NO→OH+NO2 (R14)
2(NO2+hv→NO+O) (R15)
10
2(O+O2+M→O3+M) (R16)
Overall: RH+4O2+hv→R′CHO+H2O+2O3 (R17)
where RH represents non-methane hydrocarbons, R′CHO denotes carbonyl products, and R′designates an organic fragment having one carbon atom fewer than R. The OH plays a key role in the initialization of the O3 formation process. The most important
15
primary sources of OH in the polluted atmosphere includes the reaction of H2O with O(1D) which comes from the photolysis of O3, the reaction of O3with alkenes and bio-genic VOCs-like isoprene and monoterpenes, and the photolysis of HONO. When the additional HONO sources are considered in the WRF-CHEM model, the OH concen-tration will be increased to further impact the HO2/RO2 concentration, the NO/NO2
20
ACPD
10, 4143–4188, 2010Impacts of HONO sources on the photochemistry in
Mexico City
G. Li et al.
Title Page
Abstract Introduction
Conclusions References
Tables Figures
◭ ◮
◭ ◮
Back Close
Full Screen / Esc
Printer-friendly Version
Interactive Discussion Due to the variability and uncertainties of observed HOx the six-day averaged
mod-eled and observed HOx (2-h averaged for OH and 1-h averaged for HO2) at T0 are
presented in Fig. 6. Although the WRF-CHEM model follows well the variation of OH concentrations, it underestimates the OH concentrations in the late morning and early afternoon, regardless of whether the HONO sources are considered. However, when 5
the HONO sources are accounted for, the simulation of OH concentrations in the E-case substantially improves compared to the measurement, especially in the morning. The E-case yields about 86% of the observed OH concentration averaged during the daytime from 0800 to 1800 CDT; but in the H-case, the simulated OH concentration is only about 52% of the observation on average. In addition, the HONO sources play 10
a dominant role in the OH concentration in the morning, consistent with previous model results (Aumont et al., 2003; Vogel et al., 2003). The inclusion of the HONO sources in the WRF-CHEM model also increases the HO2 concentrations in the E-case,
particu-larly in the early morning and late afternoon, but still underestimates the HO2 concen-tration by a factor of 2 during the noontime (Fig. 5b). On average, the E-case produces 15
55% of the observed HO2 concentration during the daytime from 08:00 to 18:00 CDT,
but the H-case only simulates 34% of the observed HO2 concentration. Although the E-case simulates the HOx concentrations more consistently with the measurements
than the H-case, the modeled HO2 concentrations in the E-case remains about 45%
lower than the observations during daytime, indicating either missing radical sources 20
or incomplete chemical mechanism (Hofzumahaus et al., 2009). The underestimation of VOC concentrations in the model is able to lead to the underestimation of HO2
con-centrations. It would cause an underestimation of the reactivity of OH with VOCs which in turn would result in an underestimation of peroxy radicals. Dusanter et al. (2009b) have calculated a median noontime OH reactivity of 20–22 s−1 due to VOCs at T0 us-25
ACPD
10, 4143–4188, 2010Impacts of HONO sources on the photochemistry in
Mexico City
G. Li et al.
Title Page
Abstract Introduction
Conclusions References
Tables Figures
◭ ◮
◭ ◮
Back Close
Full Screen / Esc
Printer-friendly Version
Interactive Discussion the HOx sources is from photolysis of oxygenated VOCs, which may potentially help
resolve the lack of peroxy radicals. In addition, the uncertainties from measurements also need to be taken into account when the comparison is performed between simu-lations and observations. Dusanter et al. (2009a) have reported that the accuracy of the HOx measurements is about 18% (1σ).
5
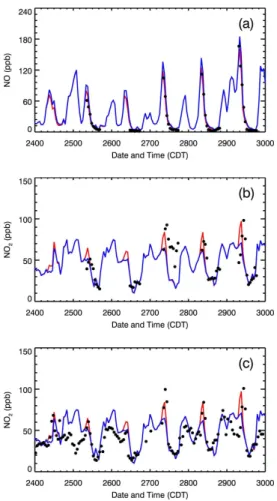
The enhancement of HO2 will increase NO2 concentrations and decrease NO
con-centrations by accelerating the conversion from NO to NO2in the polluted atmosphere. When the four HONO sources are considered, in the early morning, the WRF-CHEM model performs well in the simulation of the NO concentrations compared with the mea-surement at T0 in the E-case; the NO concentrations are also considerably reduced 10
compared to that in the H-case (Fig. 7a). However, the WRF-CHEM model overes-timates the NO concentrations in the late morning and afternoon in both the E-case and H-case, which may be caused by the underestimation of HO2 concentrations or
other reasons, such as PBL evolution and emission temporal variations. Although the peak NO2 concentrations in the morning are comparable to the measurements in the
15
E-case in Fig. 7b and c, the occurrence of the peak NO2concentrations is about one
hour later than the observation. Without the HONO sources, the H-case substantially underestimates the peak NO2concentrations from 27 to 29 March. It is worthy noting
that, on 25 and 26 March, the WRF-CHEM model fails to follow the observed NO2
vari-ation during the nighttime and also significantly overestimates the observvari-ation in the 20
early morning, which is probably caused by the failure of boundary layer simulations in these two days.
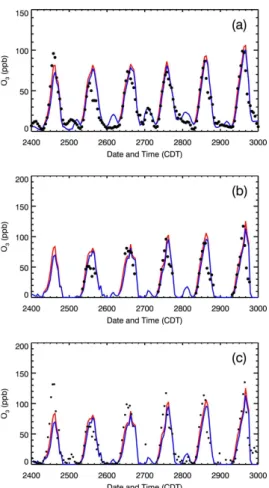
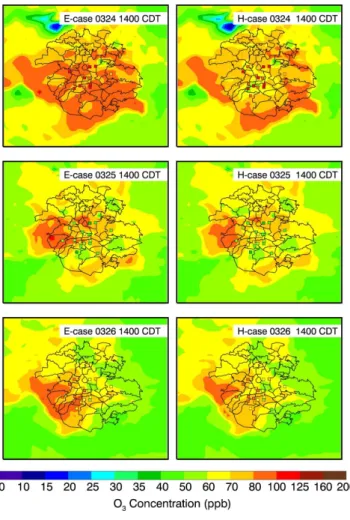
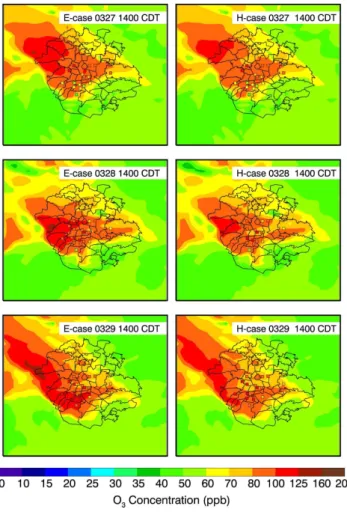
Figure 8a presents the impact of the HONO sources on the diurnal variation of near-surface O3concentrations averaged over all monitoring sites from 24 to 29 March 2006.
Apparently, the additional HONO sources accelerate the accumulation of O3
concen-25
ACPD
10, 4143–4188, 2010Impacts of HONO sources on the photochemistry in
Mexico City
G. Li et al.
Title Page
Abstract Introduction
Conclusions References
Tables Figures
◭ ◮
◭ ◮
Back Close
Full Screen / Esc
Printer-friendly Version
Interactive Discussion in the E-case become negligible. The 6-day midday average of O3 enhancement is
about 6 ppb, which is comparable to the previous CTM study from Lei et al. (2004) in Houston. They included the HONO source from the NO2 conversion on the surfaces
of soot aerosol in a CTM and found that the HONO source speeds up the build-up of morning O3concentrations by about 1 h and leads to an appreciable increase of the O3
5
concentration over the course of the day with a midday average of 7 ppb. In addition, both the E-case and H-case considerably overestimate the O3 concentrations in the late afternoon, which is attributed to the slow movement of the simulated plume and the overestimation of photolysis rates in the afternoon (Fig. 4). Figure 8b and c show the comparisons of modeled and observed diurnal variation of O3concentrations at T0. 10
The results are similar to that at ambient monitoring sites, except that inclusion of the HONO sources in the WRF-CHEM model improves the simulations of peak O3
concen-trations. Figure 9 displays the spatial distributions of calculated (in color contours) and observed (in colored dots) near surface O3concentrations at 14:00 CDT in the E-case and H-case, respectively. In general, the simulated and observed O3patterns are well
15
matched, but, clearly, the predicted plumes moves more slowly than the observation. For example, at 14:00 CDT in 27 March, the observed plume has moved to the north of Mexico City, but the part of the modeled plume remains stagnant in the center of the city. Furthermore, the HONO sources do not alter the O3pattern, but considerably
enhance the O3level in the center of the plumes. 20
3.4 Impacts on secondary aerosols
3.4.1 Secondary organic aerosols
In the WRF-CHEM model, a traditional 2-product aerosol module is applied to predict the aerosol distribution and variation. In the aerosol module, the secondary organic aerosols (SOA) are calculated using the method developed by Schell et al. (2001), 25
ACPD
10, 4143–4188, 2010Impacts of HONO sources on the photochemistry in
Mexico City
G. Li et al.
Title Page
Abstract Introduction
Conclusions References
Tables Figures
◭ ◮
◭ ◮
Back Close
Full Screen / Esc
Printer-friendly Version
Interactive Discussion using empirical 2-product parameterizations in which saturation vapor pressures and
mass-based stoichiometric yield coefficients (αi) of semi-VOC (SVOC) are obtained
from either smog chamber experiments or from published estimates in cases where smog chamber data are unavailable:
VOC+oxidant→α1SVOC1+α2SVOC2 (R18)
5
The oxidants mainly include the OH radical, the nitrate radical NO3, and O3. When the
organic gas/aerosol equilibrium has been established, gas and aerosol-phase concen-trations of each SVOC are calculated iteratively using a globally convergent variation of Newton’s method. Therefore, the enhancement of the oxidants will augment the pro-duction of SVOCs, especially in the morning when the VOCs accumulate in the PBL. 10
The increase of SVOCs is apt to partition more to aerosol phase and further escalate the SOA concentrations.
Figure 10 shows the comparison of modeled SOA and observed OOA diurnal vari-ation at T0. In the morning, the SOA concentrvari-ations are substantially enhanced in the E-case compared to the H-case, with an increase of more than 100% on average. 15
However, in the rest of the day, the enhancement of the SOA concentrations is not very significant, particularly during nighttime. The observed OOA exhibits clearly two peaks around 10:00 and 14:00 CDT from 25 to 29 March. The E-case replicates reasonably well the two peaks, but the H-case fails to reproduce the first peak on 28 and 29 March. Although the E-case yields about 40% more SOA than the H-case averaged in the six 20
days, both the E-case and H-case significantly underestimate the observed OOA con-centrations. The E-case produces about 13% of the observed OOA concentrations, consistent with the previous study performed by Volkamer et al. (2006). They have reported much larger amounts of SOA formed from reactive anthropogenic VOCs than the estimation from a SOA model based on empirical parameterization of chamber ex-25
ACPD
10, 4143–4188, 2010Impacts of HONO sources on the photochemistry in
Mexico City
G. Li et al.
Title Page
Abstract Introduction
Conclusions References
Tables Figures
◭ ◮
◭ ◮
Back Close
Full Screen / Esc
Printer-friendly Version
Interactive Discussion et al. (2009) also reported that less than 15% of the observed SOA within Mexico City
can be explained by the traditional mechanism based on oxidation of anthropogenic precursors.
The large discrepancies between the modeled SOA and observed OOA concentra-tions demonstrate that there are other mechanisms that contribute to the SOA forma-5
tion, in addition to the one used in this study. Robinson et al. (2007) suggested the for-mation of SOA from primary semivolatile and intermediate volatility species. Dzepina et al. (2009) have shown that the mechanism can help to close the gap in SOA mass between measurements and models in Mexico City. Additionally, Volkamer et al. (2007) pointed out that glyoxal is also a source of SOA. In the next study, we will evaluate the 10
contributions of the above mechanisms to the SOA concentrations.
3.4.2 Inorganic aerosols
The inorganic aerosols are predicted in the WRF-CHEM model using ISORROPIA Version 1.7 (http://nenes.eas.gatech.edu/ISORROPIA/). ISORROPIA calculates the composition and phase state of an ammonium-sulfate-nitrate-chloride-sodium-calcium-15
potassium-magnesium-water inorganic aerosol in thermodynamic equilibrium with gas phase precursors. The kind of thermodynamic equilibrium is delicately dependent on the environmental humidity and temperature. In this study, ISORROPIA is mainly uti-lized to predict the thermodynamic equilibrium between the ammonia-sulfate-nitrate-water aerosols and their gas phase precursors of H2SO4-HNO3-NH3-water vapor.
Ac-20
cordingly, the increase of the OH level due to the HONO sources will impact the inor-ganic aerosols in the WRF-CHEM model through varying H2SO4 and HNO3
concen-trations.
Figure 11a provides the diurnal variation of HNO3concentrations in the E-case and H-case compared with the measurements at T0. In the early morning, the E-case 25
and H-case reproduce well the observed slow accumulation of HNO3 concentrations
ACPD
10, 4143–4188, 2010Impacts of HONO sources on the photochemistry in
Mexico City
G. Li et al.
Title Page
Abstract Introduction
Conclusions References
Tables Figures
◭ ◮
◭ ◮
Back Close
Full Screen / Esc
Printer-friendly Version
Interactive Discussion caused by the slow movement of plumes. The impacts of the HONO sources on the
HNO3 concentrations are insignificant in the morning, although the enhancement of
the OH concentrations due to the HONO sources is supposed to increase the HNO3
concentrations in the E-case. These results indicate that there are sufficient NH3 to balance the enhanced HNO3into the aerosol phase through the thermodynamic
equi-5
librium. Figure 10b shows the comparison of NH3concentrations between the E-case
and H-case at T0. Both the E-case and H-case obtain high levels of NH3 concen-trations in the morning and the NH3 concentrations in the E-case are also decreased
compared to that in the H-case. Therefore, as shown in Fig. 12, the nitrate and ammo-nium aerosols are significantly enhanced in the E-case compared to that in the H-case 10
in the morning. The observed nitrate and ammonium aerosols show two peaks around 10:00 and 14:00 CDT from 25 to 29 March and the concentrations in the first peak are much higher than those in the second one. When the HONO sources are considered in the E-case, the WRF-CHEM model reasonably well simulates the first peak but re-mains underestimation from 27 to 29 March compared to the observation. In addition, 15
the HONO sources cause overestimation of the first peak on 25 and 26 March. The nitrate and ammonia are increased by almost 100% in the E-case compared to the H-case in the morning, but the enhancement is not significant in the afternoon; the slow movement of plumes also results in the overestimation of nitrate and ammonia in the late afternoon.
20
The formation of H2SO4 in the atmosphere through the gas phase reaction of SO2
with OH is not efficient due to the slow reaction rate. Therefore, the enhancement of the OH concentrations due to the HONO sources cannot efficiently convert SO2 into H2SO4 to increase the sulfate aerosols. Figure 13a displays the diurnal variations
of SO2 concentrations in the E-case and H-case compared with the measurement at
25
T0. The impacts of the HONO sources on the SO2concentrations are negligible and the reduction of SO2 concentrations in the E-case is less than 1% during the daytime
ACPD
10, 4143–4188, 2010Impacts of HONO sources on the photochemistry in
Mexico City
G. Li et al.
Title Page
Abstract Introduction
Conclusions References
Tables Figures
◭ ◮
◭ ◮
Back Close
Full Screen / Esc
Printer-friendly Version
Interactive Discussion reproduce the large fluctuations of the observations during the afternoon and night.
The impacts of the HONO sources on the sulfate at T0 are also negligible, indicating that the gas phase reaction of SO2with OH plays a minor role in the sulfate formation
(Fig. 13b). Other sources, such as direct emissions from the Tula industrial complex and the volcano as well as the transport from outside of Mexico City, may play a key 5
role in the sulfate concentrations (de Foy et al., 2009).
4 Conclusions
The present study investigates the contribution of HONO sources to the photochem-istry in Mexico City during the MCMA-2006/MILAGO Campaign using the WRF-CHEM model. In addition to the gas phase reaction of NO with OH, four additional HONO 10
sources are considered in the WRF-CHEM model, including secondary HONO forma-tion from NO2 heterogeneous reaction with semivolatile organics, NO2 reaction with
freshly emitted soot, NO2 heterogeneous reaction on aerosol and ground surfaces.
When only the gas phase reaction is considered, the WRF-CHEM model fails to pre-dict the high levels of HONO concentrations observed at T0 by a factor of 10, consis-15
tent with previous studies. In contrast, the WRF-CHEM model with the four additional HONO sources performs well in tracking the diurnal variation of the HONO concen-trations, although it frequently underestimates HONO concentrations in the afternoon. Quantification of the contribution from individual sources in the ground level shows that secondary HONO formation from NO2 heterogeneous reaction with semivolatile 20
organics is the most important sources in Mexico City, providing about 75% of the HONO formation. The NO2reaction on ground surfaces also plays an important role in
the HONO formation, with about 18% contribution near the surface. The contributions form the NO2reaction with newly emitted soot and heterogeneous reaction on aerosol
surfaces is negligible. 25
ACPD
10, 4143–4188, 2010Impacts of HONO sources on the photochemistry in
Mexico City
G. Li et al.
Title Page
Abstract Introduction
Conclusions References
Tables Figures
◭ ◮
◭ ◮
Back Close
Full Screen / Esc
Printer-friendly Version
Interactive Discussion chemistry and secondary aerosols. When the additional HONO sources are
consid-ered, the WRF-CHEM model significantly increases the HOx concentration, yielding
better agreement with the measurements than that if only the gas phase reaction source is considered. Inclusion of the additional HONO sources alters the partition of NO/NO2and converts more NO into NO2, particularly in the morning. Although the
5
WRF-CHEM model including the five HONO sources cannot improve the simulations of the occurrence of peak NO2 concentrations, it performs quite well in modeling the NO variability compared to the observations at T0. The HONO sources accelerate the accumulation of O3 concentrations averaged over all the ambient monitoring sites in
the morning by about 2 h and subsequently lead to a noticeable enhancement of O3 10
concentrations over the course of the day with a midday average of about 6 ppb. The WRF-CHEM model considerably overestimates O3concentrations in the late afternoon
whether the additional HONO sources are considered or not, which is mainly caused by the slow movement of the simulated plumes and overestimation of the photolysis rates.
15
The HONO sources also play a very important role in the formation of secondary aerosols in the morning. The HONO sources substantially enhance the SOA concen-trations by a factor of 2 on average in the morning, but contribute less in the rest of the day. It is worthy to note that the traditional 2-product SOA mechanism fails to predict high levels of SOA mass comparable to the observations at T0, which agrees well with 20
the other studies in Mexico City (Volkamer et al., 2006; Dzepina et al., 2009; Hodzic et al., 2009). The nitrate and ammonium aerosols are significantly enhanced in the morning when all five HONO sources are included, and more consistent with the mea-surements at T0 compared to the results with only gas phase HONO source. Due to the inefficient conversion of H2SO4 from SO2 reaction with OH, the impact of the
25
HONO sources to the sulfate aerosols is negligible.
ACPD
10, 4143–4188, 2010Impacts of HONO sources on the photochemistry in
Mexico City
G. Li et al.
Title Page
Abstract Introduction
Conclusions References
Tables Figures
◭ ◮
◭ ◮
Back Close
Full Screen / Esc
Printer-friendly Version
Interactive Discussion formation of secondary pollutants has a particular sensitivity to HONO concentrations.
Additionally, meteorological conditions also play a key role in determining the accumu-lation or dispersion of HONO (as well as other species), also influencing its lifetime via changing chemical processes. Therefore, meteorological conditions significantly influence the evaluation of the impact of HONO sources on the photochemistry in the 5
polluted urban atmosphere.
Acknowledgement. We are indebted to the large number of people involved in the MILAGRO field campaign as well as those involved in long-term air quality monitoring and the emissions inventory in the Mexico City metropolitan area, which made this study possible. This work was supported by the US National Science Foundation’s Atmospheric Chemistry Program (ATM-10
0528227) and the Molina Center for Energy and the Environment. Acknowledgment is also made to the National Center for Atmospheric Research, which is sponsored by the National Science Foundation, for the computing time used in this research.
References
Acker, K., M ¨oller, D., Auel, R., Wieprecht, W., and Kala, D.: Concentrations of nitrous acid, nitric 15
acid, nitrite and nitrate in the gas and aerosol phase at a site in the emission zone during ESCOMPTE 2001 experiment, Atmos. Res., 74(1–4), 507–524, 2005.
Aiken, A. C., Salcedo, D., Cubison, M. J., Huffman, J. A., DeCarlo, P. F., Ulbrich, I. M., Docherty, K. S., Sueper, D., Kimmel, J. R., Worsnop, D. R., Trimborn, A., Northway, M., Stone, E. A., Schauer, J. J., Volkamer, R. M., Fortner, E., de Foy, B., Wang, J., Laskin, A., 20
Shutthanandan, V., Zheng, J., Zhang, R., Gaffney, J., Marley, N. A., Paredes-Miranda, G., Arnott, W. P., Molina, L. T., Sosa, G., and Jimenez, J. L.: Mexico City aerosol analysis during MILAGRO using high resolution aerosol mass spectrometry at the urban supersite (T0) – Part 1: Fine particle composition and organic source apportionment, Atmos. Chem. Phys., 9, 6633–6653, 2009, http://www.atmos-chem-phys.net/9/6633/2009/.
25
ACPD
10, 4143–4188, 2010Impacts of HONO sources on the photochemistry in
Mexico City
G. Li et al.
Title Page
Abstract Introduction
Conclusions References
Tables Figures
◭ ◮
◭ ◮
Back Close
Full Screen / Esc
Printer-friendly Version
Interactive Discussion Alicke, B., Geyer, A., Hofzumahaus, A., Holland, F., Konrad, S., P ¨atz, H. W., Sch ¨afer, J.,
Stutz, J., Volz-Thomas, A., Platt, U.: OH formation by HONO photolysis during the BERLIOZ experiment, J. Geophys. Res., 108(D4), 8247, doi:10.1029/2001JD000579, 2003.
Ammann, M., Kalberer, M., Jost, D. T., Tobler, L., Rossler, E., Piguet, D., Gaggeler, H. W., and Baltensperger, U.: Hetergeneous production of nitrous acid on soot in polluted air masses, Nature, 395, 157–160, 1998.
5
Arens, F., Gutzwiller, L., Baltensperger, U., Gaggeler, H. W., and Ammann M.: Heterogeneous reaction of NO2on diesel soot particles, Environ. Sci. Technol., 35, 2191–2199, 2001. Aumont, B., Chervier, F., and Laval, S.: Contribution of HONO sources to the NOx/HOx/O3
chemistry in the polluted boundary layer, Atmos. Environ., 37, 487–498, 2003.
Aumont, B., Madronich, S., Ammann, M., Kalberer, M., Baltensberger, U., Hauglustine, D., and 10
Brocheton, F.: On the reaction of NO2+ soot in the atmosphere, J. Geophys. Res., 104, 1729–1736, 1999.
Bei, N., de Foy, B., Lei, W., Zavala, M., and Molina, L. T.: Using 3DVAR data assimilation system to improve ozone simulations in the Mexico City basin, Atmos. Chem. Phys., 8, 7353–7366, 2008, http://www.atmos-chem-phys.net/8/7353/2008/.
15
Binkowski, F. S. and Roselle, S. J.: Models-3 Community Multiscale Air Quality (CMAQ) model aerosol component: 1. Model description, J. Geophys. Res., 108(D6), 4183, doi:10.1029/2001JD001409, 2003.
Brasseur, G. P., Orlando, J. J., and Tyndall, G. S.: Atmospheric Chemistry and Global Change, Oxford University Press, New York, USA, 654 pp., 1999.
20
Calvert, J. G., Yarwood, G., and Dunker, A. M.: An evaluation of the mechanism of nitrous acid formation in the urban atmosphere, Res. Chem. Intermediat., 20(3–5), 463–502,1994. Chen, F., and Dudia, J.: Coupling an advanced land-surface/hydrology model with the Penn
State/NCAR MM5 modeling system. Part I: Model description and implementation, Mon. Weather Rev., 129, 569–585, 2001.
25
Clapp, L. J. and Jenkin, M.: Analysis of the relationship between ambient levels of O3, NO2and NO as a function of NOx in the UK, Atmos. Environ., 35, 6391–6405, 2001.
de Foy, B., Fast, J. D., Paech, S. J., Phillips, D., Walters, J. T., Coulter, R. L., Martin, T. J., Pekour, M. S., Shaw, W. J., Kastendeuch, P. P., Marley, N. A., Retama, A., and Molina, L. T.: Basin-scale wind transport during the MILAGRO field campaign and comparison to climatol-30
ACPD
10, 4143–4188, 2010Impacts of HONO sources on the photochemistry in
Mexico City
G. Li et al.
Title Page
Abstract Introduction
Conclusions References
Tables Figures
◭ ◮
◭ ◮
Back Close
Full Screen / Esc
Printer-friendly Version
Interactive Discussion de Foy, B., Krotkov, N. A., Bei, N., Herndon, S. C., Huey, L. G., Mart´ınez, A.-P.,
Ruiz-Su ´arez, L. G., Wood, E. C., Zavala, M., and Molina, L. T.: Hit from both sides: tracking industrial and volcanic plumes in Mexico City with surface measurements and OMI SO2 re-trievals during the MILAGRO field campaign, Atmos. Chem. Phys., 9, 9599–9617, 2009, http://www.atmos-chem-phys.net/9/9599/2009/.
Dudia, J.: Numerical study of convection observed during the winter monsoon experiment using 5
a mesoscale two-dimensional model, J. Atmos. Sci., 46, 3077–3107, 1989.
Dusanter, S., Vimal, D., Stevens, P. S., Volkamer, R., and Molina, L. T.: Measurements of OH and HO2concentrations during the MCMA-2006 field campaign – Part 1: Deployment of the Indiana University laser-induced fluorescence instrument, Atmos. Chem. Phys., 9, 1665– 1685, 2009a, http://www.atmos-chem-phys.net/9/1665/2009/.
10
Dusanter, S., Vimal, D., Stevens, P. S., Volkamer, R., Molina, L. T., Baker, A., Meinardi, S., Blake, D., Sheehy, P., Merten, A., Zhang, R., Zheng, J., Fortner, E. C., Junkermann, W., Dubey, M., Rahn, T., Eichinger, B., Lewandowski, P., Prueger, J., and Holder, H.: Measure-ments of OH and HO2concentrations during the MCMA-2006 field campaign – Part 2: Model comparison and radical budget, Atmos. Chem. Phys., 9, 6655–6675, 2009b,
15
http://www.atmos-chem-phys.net/9/6655/2009/.
Dzepina, K., Volkamer, R. M., Madronich, S., Tulet, P., Ulbrich, I. M., Zhang, Q., Cappa, C. D., Ziemann, P. J., and Jimenez, J. L.: Evaluation of recently-proposed secondary organic aerosol models for a case study in Mexico City, Atmos. Chem. Phys., 9, 5681–5709, 2009, http://www.atmos-chem-phys.net/9/5681/2009/.
20
Febo, A., De Santis, F., Perrino, C., and Liberti, A.: The study of the reaction between nitrogen oxides and water vapor by means of annular denuder tubes, in: Tropospheric NOx Chemistry-Gas Phase and Multiphase Aspects, CEC Air Pollut. Res. Rep. 9, Nielsen & Cox, Rosklide, Denmark, 61–67, 1987.
Febo, A., Perrino, C., and Allegrini, I.: Measurement of nitrous acid in Milan, Italy, by DOAS and 25
diffusion denuders, Atmos. Environ., 30, 3599–3609, 1996.
Grell, G. A., Peckham, S. E., Schmitz, R., McKeen, S. A., Wilczak, J., and Eder, B.: Fully coupled “online” chemistry within the WRF model, Atmos. Environ., 39, 6957–6975, 2005. George, C., Strekowski, R. S., Kleffmann, J., Stemmler, K., and Bencze, L.: Photoenhanced
uptake of gaseous NO2 on solid organic compounds: A photochemical source of HONO?, 30
Faraday Discuss, 130, 195–210, 2005.
ACPD
10, 4143–4188, 2010Impacts of HONO sources on the photochemistry in
Mexico City
G. Li et al.
Title Page
Abstract Introduction
Conclusions References
Tables Figures
◭ ◮
◭ ◮
Back Close
Full Screen / Esc
Printer-friendly Version
Interactive Discussion of global terrestrial isoprene emissions using MEGAN (Model of Emissions of Gases and
Aerosols from Nature), Atmos. Chem. Phys., 6, 3181–3210, 2006, http://www.atmos-chem-phys.net/6/3181/2006/.
Guenther, A.: Corrigendum to “Estimates of global terrestrial isoprene emissions using MEGAN (Model of Emissions of Gases and Aerosols from Nature)” published in Atmos. Chem. Phys., 6, 3181–3210, 2006, Atmos. Chem. Phys., 7, 4327–4327, 2007,
5
http://www.atmos-chem-phys.net/7/4327/2007/.
Gutzwiller, L., Arens, F., Baltensperger, U., Gaggeler, H. W., and Ammann, M.: Significance of semivolatile diesel exhaust organics for secondary HONO formation, Environ. Sci. Technol., 36, 677–682, 2002.
Harris, G. W., Carter, W. P. L., Winer, A. M., Pitts Jr., J. N., Platt, U., and Perner, D.: Observation 10
of nitrous acid in the Los Angeles atmosphere and implications for predictions of ozone-precursor relationships, Environ. Sci. Technol., 16, 414–419, 1982.
Harrison, R. M., Peak, J. D., and Collins, G. M.: Tropospheric cycle of nitrous acid, J. Geophys. Res., 101, 14429–14439, 1996.
Hess, P. G., Flocke, S., Lamarque, J. F., Barth, M. C., and Madronich, S.: Episodic modeling of 15
the chemical structure of the troposphere as revealed during the spring MLOPEX 2 intensive, J. Geophys. Res., 105, 26809–26839, 2000.
Hofzumahaus, A., Rohrer, F., Lu, K., Bohn, B., Brauers, T., Chang, C., Fuchs, H., Holland, F., Kita, K., Dondo, Y., Li, X., Lou, S., Shao, M., Zeng, L., Wahner, A., and Zhang, Y.: Amplified trace gas removal in the troposphere, Science, 324, 1702–1704, 2009.
20
Horowitz, L. W., Walters, S., Mauzerall, D. L., Emmons, L. K., Rasch, P. J., Granier, C., Tie, X., Lamarque, J.-F., Schultz, M. G., Tyndall, G. S., Orlando, J. J., and Brasseur, G. P.: A global simulation of tropospheric ozone and related tracers: Description and evaluation of MOZART, version 2, J. Geophys. Res., 108(D24), 4784, doi:10.1029/2002JD002853, 2003.
Hodzic, A., Jimenez, J. L., Madronich, S., Aiken, A. C., Bessagnet, B., Curci, G., Fast, J., Lamar-25
que, J.-F., Onasch, T. B., Roux, G., Schauer, J. J., Stone, E. A., and Ulbrich, I. M.: Modeling organic aerosols during MILAGRO: importance of biogenic secondary organic aerosols, At-mos. Chem. Phys., 9, 6949–6981, 2009, http://www.atmos-chem-phys.net/9/6949/2009/. Jenkin, M. E., Cox, R. A., and Williams, D. J.: Laboratory studies of the kinetics of formation of
nitrous acid from the thermal reaction of nitrogen dioxide and water vapor, Atmos. Environ., 30
22, 487–498, 1988.
ACPD
10, 4143–4188, 2010Impacts of HONO sources on the photochemistry in
Mexico City
G. Li et al.
Title Page
Abstract Introduction
Conclusions References
Tables Figures
◭ ◮
◭ ◮
Back Close
Full Screen / Esc
Printer-friendly Version
Interactive Discussion formation of nitrous acid (HONO) on soot aerosol particles, J. Geophys. Res., 104, 13825–
13832, 1999.
Kleffmann, J., Becker, K. H., and Wiesen, P.: heterogeneous NO2conversion process on acid surfaces: possible atmospheric implications, Atmos. Environ., 32, 2721—2729, 1998. Kleffmann, J., Becker, K. H., Lackhoff, M., and Wiesen, P.: Heterogeneous conversion of NO2
and HONO on carbonaceous surfaces, Phys. Chem. Chem. Phys., 1, 5443–5450, 1999. 5
Kleffmann, J., Lorzer, J. C., Wiesen, P., Kern, C., Trick, S., Volkamer, R., Rodenas, M., and Wirtz, K.: Intercomparison of the DOAS and LOPAP techniques for the detection of nitrous acid (HONO), Atmos. Environ., 40, 3640–3652, 2006.
Kotamarthi, V. R., Gaffney, J. S., Marley, N. A., and Doskey, P. V.: Heterogeneous NOx chem-istry in the polluted PBL, Atmos. Environ., 35, 4489–4498, 2001.
10
Kurtenbach, R., Becker, K. H., Gomes, J. A. G., Kleffmann, J., Lorzer, J. C., Spittler, M., Wiesen, P., Ackermann, R., Geyer, A., and Platt, U.: Investigations of emissions and het-erogeneous formation of HONO in a road traffic tunnel, Atmos. Environ., 35, 3385—3394, 2001.
Lammel, G. and Cape, J. N.: Nitrous acid and nitrite in the atmosphere, Chem. Soc. Rev., 25, 15
361–369, 1996.
Lammel, G. and Perner, D.: The atmospheric aerosols as a source of nitrous acid in the polluted troposphere, J. Aerosol Sci., 19, 1199–1202, 1988.
Li, G., Zhang, R., Fan, J., and Tie, X.:, Impacts of black carbon aerosol on photolysis and ozone, J. Geophys. Res., 110, D23206, doi:10.1029/2005JD005898, 2005.
20
Lei, W., Zhang, R., Tie, X., and Hess, P.: Chemical characterization of ozone formation in the Houston-Galveston area, J. Geophys. Res., 109, D12301, doi:10.1029/2003JD004219, 2004.
Lin, Y.-L., Farley, R. D., and Orville, H. D.: Bulk parameterization of the snow field in a cloud model, J. Appl. Meteorol., 22, 1065–1092, 1983.
25
Merten, A.: New design of Long path-DOAS instruments based on fibre optics and applications in the study of the urban atmosphere, Thesis, Heidelberg Univ., Germany, 2008.
Mlawer, E. J., Taubman, S. J., Brown, P. D., Iacono, M. J., and Clough, S. A.: Radiative transfer for inhomogeneous atmosphere: RRTM, a validated correlated-k model for the long-wave, J. Geophys. Res., 102(D14), 16663–16682, 1997.
30
ACPD
10, 4143–4188, 2010Impacts of HONO sources on the photochemistry in
Mexico City
G. Li et al.
Title Page
Abstract Introduction
Conclusions References
Tables Figures
◭ ◮
◭ ◮
Back Close
Full Screen / Esc
Printer-friendly Version
Interactive Discussion Molina, L. T., Madronich, S., and Gaffney, J. S., et al.: An Overview of MILAGRO 2006
cam-paign: Mexico City emissions and their transport and transformation, to be submitted to Atmos. Chem. Phys., 2010.
Ndour, M., D’Anna, B., George, C., Ka, O., Balkanski, Y., Kleffmann, J., Stemmler, K., and Ammann, M.: Photoenhanced uptake of NO2on mineral dust: Laboratory experiments and model simulations, Geophys. Res. Lett., 35(5), L05812,, doi:10.1029/2007GL032006, 2008. 5
Ng, N. L., Kroll, J. H., Chan, A. W. H., Chhabra, P. S., Flagan, R. C., and Seinfeld, J. H.: Secondary organic aerosol formation fromm-xylene, toluene, and benzene, Atmos. Chem. Phys., 7, 3909–3922, 2007, http://www.atmos-chem-phys.net/7/3909/2007/.
Noh Y., Cheon, W. G., and Raasch, S.: The improvement of the K-profile model for the PBL using LES. Preprints, Int. Workshop of Next Generation NWP Models, Seoul, South Korea, 10
Laboratory for Atmospheric Modeling Research, 65–66, 2001.
Odum, J. R., Hoffman, T., Bowman, F., Collins, D., Flagan, R. C., and Seinfeld, J. H.:, Gas/particle partitioning and secondary organic aerosol yields, Environ. Sci. Technol., 30, 2580–2585, 1996.
Olaguer, E. P., Rappengluck, B., Lefer, B., Stutz, J., Dibb, J., Griffin, R., Brune, W. H., 15
Shauck, M., Buhr, M., Jeffries, H., Vizuete, W., and Pinto, J. P.: Deciphering the role of radical precursors during the second Texas air quality study, J. Air Waste Manage., 59, 1258–1277, 2009.
Pankow, J. F.: An absorption model of gas/particle partitioning involved in the formation of secondary organic aerosol, Atmos. Environ., 28, 189–193, 1994.
20
Robinson, A. L., Donahue, N. M., Shrivastava, M. K., Weitkamp, E. A., Sage, A. M., Grieshop, A. P., Lane, T. E., Pandis, S. N., and Pierce, J. R.: Rethinking organic aerosols: semivolatile emissions and photochemical aging, Science, 315, 1259–1262, 2007.
Saliba, N. J., Mochiba, M., and Finlayson-Pitts, B. J.: Laboratory studies of sources of HONO in polluted urban atmospheres, Geophys. Res. Lett., 27, 3229–3232, 2000.
25
Schell, B., Ackermann, I. J., Hass, H., Binkowski, F. S., and Ebel, A.: Modeling the formation of secondary organic aerosol within a comprehensive air quality modeling system, J. Geophys. Res., 106, 28275–28293, 2001.
Svensson, R., Ljungstrom, E., and Lindquist, O.: Kinetics of the reaction between nitrogen dioxide and water vapour, Atmos. Environ., 21, 1529–1539, 1987.
30