EQUITY REPORT AIRBUS GROUP
Josephine Kittner - 2371
A Project carried out on the Master in Finance Program, under the supervision of: Xanthi Gkougkousi
Index
Recommendation ... 1
Executive summary ... 2
Airbus Group Company Overview ... 3
Airbus Group faces increasing competitive landscape in the A&D industry ...5
Drivers and trends of Airbus’ commercial aerospace business ... 7
Key drivers for Airbus value creation and the industry ...7
Trends driving the commercial aerospace industry ...9
Airbus’ Space and Defence business ... 10
Airbus Helicopter business ... 11
Macroeconomic trends and model imperatives ... 12
Valuation ... 14
Discounted Cash Flow Valuation ...14
Multiples valuation ...20
Financials ...22
Bibliography ... 26
List of Tables and Figures
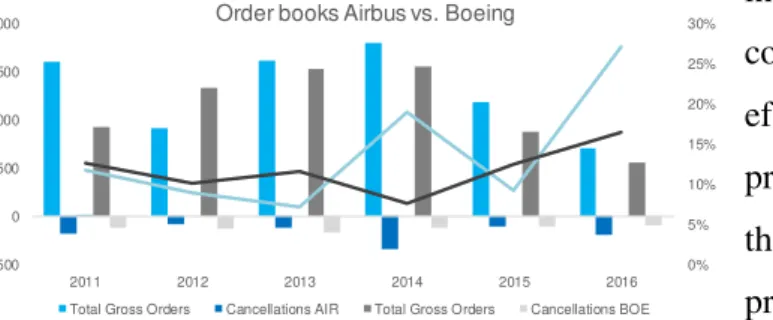
Figure 1- Airbus vs. Boeing backlog (order) battle development, 2011-2016, Sources: Boeing, Airbus, Statista . 5
Figure 2 – Global leading A&D manufacturers 2015 by sales in USD mn, Source: Statista, 2016 ... 5
Figure 3 – Overview European and Main Global Competitors of Airbus Operating Business, Sources: Own research, Statista, Airbus ... 6
Figure 4 – Global backlog breakdown development by OEM, 2004 vs. 2015, Sources: Airbus, Boeing, Bombardier, Flightglobal, 2016 ... 6
Figure 5 – List of leading airlines by RPK bn, Source: Statista, 2016 ... 8
Figure 6 – Air passenger traffic from 1995 to 2035, by region (in billion RPKs), Source: Statista, 2016 ... 8
Figure 7 – Projected aircraft deliveries from 2016 to 2035, Source: Statista, 2016 ... 8
Figure 8 – Change in military spending 2006-2015, Source: Statista, 2016 ... 10
Figure 9 - The 15 countries with the highest military spending worldwide in 2015 (in USD bn), Source: Statista, 2016 ... 10
Figure 10 – Deliveries developments by helicopter type, Source: Airbus Helicopters, Analyst research ... 12
Figure 11 – 2015 market share Airbus Helicopters in civil and military market, Source: Airbus Helicopters ... 12
Figure 13 - Backlog development at Airbus from 1998 to 2015, Source: Airbus company filings ... 12
Figure 12 – Worldwide air traffic passenger revenue from 2004 to 016 in USD bn, Source: Statista ... 12
Figure 14 - Average annual Europe Brent crude spot price and 24M MA from 1990 to 2015 in USD per barrel 12 Figure 15 – Comparison global GDP growth and airline traffic growth (in RPK), Source:Statista, Airbus, Flightglobal, Analyst assumptions ... 13
Figure 16 – Crude oil prices per barrel and moving average between 1980 and 2015, Source: Statista ... 13
Figure 17 – Enterprise Value and sensitivity analysis, Source: Analyst assumptions, Airbus company filings ... 20
Table 1 – Overview key financial metrics... 2
Table 2 – Revenue split and year-on-year growth of three major business units ... 3
Table 3 – Geographic revenue split at Airbus Group, 2012 to 2016 ... 4
Table 4 – Income statement with revenue division breakdown, Source: Airbus Group Annual reports 2012 to 2016, Source: Airbus company filings, Analyst assumptions ... 15
Table 5 - PP&E breakdown through base forecast D&A and Capital Expenditure as % of revenues forecast, Source Airbus company filings, Analyst assumption and research ... 18
Table 6 – Forecasting operating working capital items and business unit breakdown, Sources: Analyst assumptions, Airbus company filings ... 19
1
AIRBUS GROUP (EADSY, AIR.PA)
Industrials I Aerospace & Defence
Analyst: Josephine Kittner Dec 27, 2016
Recommendation
Our Airbus Group (AIR:PA) buy recommendation derives mostly from strong
backlog performance in 2016 with above industry average revenue growth rate
expectations and better than expected management execution risks. While
reported Q3 ’16 results were less than expected, delivery rates and deals closed
increased again towards the end of the year, leading the market with a very
positive tendency for 2017. The current target price is set at EUR 64.54,
resulting into an expected return over a period of 12 months of 16.6%. Airbus
restructuring announcement further strengthened the management’s proactive steps towards a concentration on its well performing core business:
commercial aircraft manufacturing.
Positive
Commercial Aerospace markets see a strong upward trend due to
increasing passenger numbers and number of newly arising aviation mega
cities for next decade, especially in markets with high GDP and population
growth, such as Asia-Pacific, Latin America, and the Middle East. Airbus
is expected to capture growth in terms of sales of new aircraft and
replacements, leaving the market at a current 50-50 weight.
Helicopters business shows stable revenues and market leadership in the
commercial helicopters segment is preserved for the FY 2016.
Airbus closes an historic aircraft order contract end of 2016 with Iranian
Air after receiving necessary export permissions from US export agency.
The order encompasses 100 new aircrafts with 46 single-aisle aircrafts.
Together with strong backlog value, 2016 prepares Airbus for a strong
2017.
Negative
This year Airbus faced increased execution risks due to longer backlog
periods and operational problems to finalize the new engine option program
for the A320 family of Airbus Commercial Aerospace. Coupled with
decision to cut the A380 lossmaking program, high penalty payments for
the long-term delivery delay of the A400M, and construction issues for the
A350 XWB, the pressure on Airbus rises to avoid similar challenges in the
future and to increase build rates.
Low oil prices, the increasing dollar appreciation, and low financing costs
render airline financing as a high risk for Airbus, especially considering the
historically high backlog value and average backlog length. As soon as
prices increase more and financing becomes more expensive, Airbus could
face a strong cancellation wave.
AIR:PA stock price development
Global Aerospace & Defence industry
Shareholding structure
Stock Rating Buy
Consensus Buy
Industry Positive
Vs. FY 2015 Unchanged
Price Target EUR 64.54
Current Stock Price EUR 60.02
52-week range (EUR) 48.07 - 62.83
Market Cap (EUR mn) 46,410
Outstanding shares (mn) 772.712
583.9 617.8 637.6 649.7 674.4 2% 6% 3% 2% 4% 0% 1% 2% 3% 4% 5% 6% 7% 520 540 560 580 600 620 640 660 680 700
2011 2012 2013 2014 2015
Global A&D sector revenue Revenue growth (%)
62.84 € 30 € 40 € 50 € 60 € 70 73.60% 11% 11% 4.400% 0%
2
AIRBUS GROUP (EADSY, AIR.PA)
Industrials I Aerospace & Defence
Analyst: Josephine Kittner Dec 27, 2016
Table 1 – Overview key financial metrics
Executive summary
The purpose of this report is to provide a comprehensive business and financial
analysis of Airbus Group and deliver an investment recommendation based on
the current price and the expected return for the period of the next 12 months.
The expected upside is 16.6% for the 12 next months’ period. In order to derive the target price of the business, we applied a sum-of-the-parts DCF valuation
for the two parts we defined: Airbus Commercial Aerospace/HQ, and Defence
& Space combined with the Helicopters business unit. The valuation results
were confirmed by a multiple based valuation. Overall, we observed the
potential for positive growth for all three business units, in particular, for the
revenue driving Airbus Commercial Aerospace.
Airbus Commercial Aerospace was determined as the main revenue
contributor within the Group by currently contributing more than 70% to total
revenues. Despite the challenges associated with an appreciating dollar, low
interest rates and fluctuating oil prices, we follow the market dynamics and
forecast very attractive revenue growth for the next 5 years. We strongly
believe that Airbus is taking the right steps towards eliminating execution risks
and towards slowly increasing build rates and operating margins to decrease
high average backlog periods. CA has excellent market opportunities in the
Middle East, Asia Pacific and Latin America, were welfare increases and air
traffic demand grows. Given Airbus’ leading market position in aircraft manufacturing, we expect Airbus to outperform the Aerospace & Defence
industry in the coming years.
Airbus Defence & Space saw some major hiccups this year caused by A400M
delivery delays that the company has been dragging along for several years.
We observed how D&S revenues decreased this year due to significant penalty
payments to Germany. This weakened the business for the A400M once more.
The remaining business demonstrated positive trends and could grow. We
expect D&S sales to stagnate more in the future, partly due to the fierce
competition and competitive advantages of US companies within that business.
Airbus Helicopters shows stable, yet low growth but retains its market
leadership in the commercial helicopter business. The general outlook is more
conservative motivated by decreasing order intakes.
Our target price for Airbus (AIR.PA) was set at EUR 64.54 for the FY 2016.
Key financial metrics
Source: Airbus company data, Analyst research & assumptions
Income statement
in EUR mn 2014A 2015A 2016F 2017F 2018F CAGR
Sales 60,713 64,450 65,682 69,662 73,968 5.1% EBITDA (adj) 5,999 6,487 5,569 6,076 6,409 1.7% EBIT 3,849 4,021 3,625 4,016 4,225 2.4% Net income (adj) 2,208 2,534 2,111 2,256 2,415 2.3% EPS (adj) (in EUR) 2.82 3.23 2.73 2.89 3.08 2.3% Diluted shares (mn) 784.3 783.9 772.7 781.5 783.5 0.0%
Margins and returns
in % 2014A 2015A 2016F 2017F 2018F Avg
Sales growth 5.5% 6.2% 2.0% 6.1% 6.2% 5.2% EBITDA margin 9.8% 9.7% 8.5% 8.7% 8.7% 9.1% EBIT margin 6.3% 6.2% 5.5% 5.8% 5.7% 5.9% ROIC 15.9% 15.1% 10.3% 9.9% 9.6% 12% ROA 2.4% 2.5% 1.9% 2.0% 2.1% 2% ROE 23.8% 35.7% 37.1% 33.8% 30.4% 32% ROCE 7.9% 7.6% 6.4% 7.1% 7.1% 7%
Balance sheet and cash flows
in EUR mn 2014A 2015A 2016F 2017F 2018F CAGR
Tangible fixed assets 16,388 17,193 18,154 19,172 20,136 5.3% Intangible fixed assets 12,758 12,555 12,555 12,555 12,555 -0.4% Cash & cash equivalents 7,271 6,590 4,950 3,337 6,892 -1.3% Short & long-term debt 7,351 9,125 11,319 11,319 11,319 11.4%
Operating ratios
in % 2014A 2015A 2016F 2017F 2018F Avg
3
Airbus Group Company Overview
Airbus is a multinational company that operates globally in the Aerospace & Defence (A&D) market. Airbus Group encompasses three major business units, Airbus Commercial Aerospace (CA), Airbus Helicopters and Defence & Space (D&S). In 2015, the Group generated annual revenues of EUR 64,5bn (2014: EUR 60,7bn), showing a compounded annual growth rate (CAGR) of 4% since 2012. From its three divisions, Airbus CA remains the leading revenue driver contributing to 70% to annual Group revenues with an increasing trend, followed by D&S services that currently generate around 20% of revenues and Helicopters generating the final 10%. Formerly named EADS (European Aeronautic Defence and Space Company), Airbus Group changed its name in 2013 to better reflect the importance and historical strength of the CA division (named Airbus) within the company. Airbus CA aircraft product portfolio currently encompasses three commercial aircraft families (A320, A330, and A340), the newest aircraft A350XWB, and the jumbo jet A380, as well as one freighter aircraft model. The aircraft families differ in fuel-efficiency, size (narrow and wide body aircraft), and passenger capacity (100-400).
In October 2016, Airbus Group announced a major restructuring plan which will merge the
company’s headquarters with the Airbus Commercial Aircraft unit in order to lever efficiencies
after encountering difficulties in maintaining and improving operating margins at Airbus. We regard this as a positive change for Airbus, helping the Group to refocus on its growing core business, commercial aircraft manufacturing, and increase cost efficiencies and profitability which suffered heavily since 2015. The latter was mostly due to major failure of the jumbo jet A380. Restructuring changes have already been accounted for in the valuation model by considering Airbus CA and the headquarters as one part in the the sum-of-the-parts valuation. While in terms of backlog and sales the Commercial Aerospace industry is dominated by Boeing (market leader) and Airbus, its other business units D&S as well as Helicopters operate in a denser and more competitive landscape, competing against market giants such as Textron and Lockheed Martin, but also Boeing. It is noteworthy, that Airbus was originally founded as
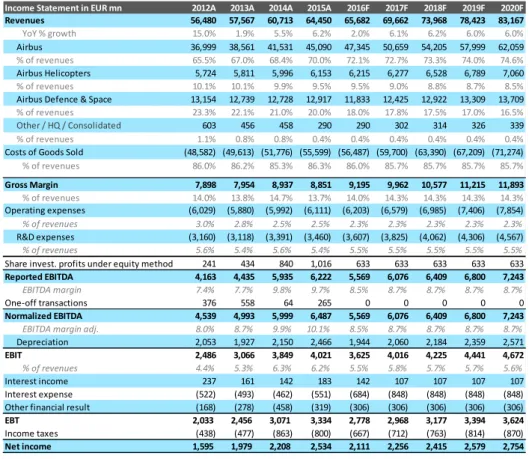
Income Statement in m EUR 2012a 2013a 2014a 2015a 2016f 2017f 2018f 2019f 2020f Revenues 56,480 57,567 60,713 64,450 65,682 69,662 73,968 78,423 83,167
YoY % growth 15.0% 1.9% 5.5% 6.2% 2.0% 6.1% 6.2% 6.0% 6.0%
Airbus 36,999 38,561 41,531 45,090 47,345 50,659 54,205 57,999 62,059
% of revenues 65.5% 67.0% 68.4% 70.0% 72.1% 72.7% 73.3% 74.0% 74.6%
Airbus Helicopters 5,724 5,811 5,996 6,153 6,215 6,277 6,528 6,789 7,060
% of revenues 10.1% 10.1% 9.9% 9.5% 9.5% 9.0% 8.8% 8.7% 8.5%
Airbus Defence & Space 13,154 12,739 12,728 12,917 11,833 12,425 12,922 13,309 13,709
% of revenues 23.3% 22.1% 21.0% 20.0% 18.0% 17.8% 17.5% 17.0% 16.5%
Other / HQ / Consolidated 603 456 458 290 290 302 314 326 339
% of revenues 1.1% 0.8% 0.8% 0.4% 0.4% 0.4% 0.4% 0.4% 0.4%
Table 2 – Revenue split and year-on-year growth of three major business units
4
European Aeronautic Defence and Space (EADS), a consortium of several European aerospace companies, with the objective of competing against strong US competitors such as Boeing and Lockheed Martin in all branches of the aerospace and defence industry. The battle was clearly won from a commercial aerospace perspective, since Airbus established itself as the real European counterpart to the traditional market leader Boeing. The remainders of the former
EADS construct can be recognized in today’s shareholding structure, where the French,
German and Spanish government form a blocking minority with a combined share of 26.4% of the company (see Recommendation).
Despite market entry of Original Equipment Manufacturers (OEMs, explained below), Airbus is expected to maintain a leading market position for at least the next 10 years. However, we saw D&S revenues declining again this year contributing to only 18% of the increased revenues, compared to a more than 23% share in 2012. This negative trend is also reflected in the forecast of the D&S division, which result in a CAGR of only 1% from 2012 to 2020.
The Helicopters business seems more stable and shows steady, yet low growth rates at only 1% for the financial year 2016 (vs. 2.6% in 2015). In comparison, D&S is expected to experience a true revenue dip until end of 2016, mostly due to delicate A400M delivery delay issues and penalty payments thereof.
Airbus Group operates and sells aircrafts globally on all continents. Europe and North America are still the strongest markets for Airbus in terms of percentage of revenue contribution. Nonetheless, both geographical areas have been in decline in terms of revenues this year. In case of Europe the growth rate has even been negative since 2013 and is expected to follow this trend to a certain extend during the forecasting period (until 2020). In accordance to what the market tells us in the form of new contracts formed, we observe strong revenue growth in Asia, Middle East and Latin America. The increase comes from a positive trend in sales numbers of Airbus CA to Middle Eastern and Asian airlines companies, that heavily invest in fleet expansion and attract and retain customers by offering mostly long-distance, high quality aircraft flights.
Geographic revenue split 2012a 2013A 2014A 2015A 2016F
Europe 21,006 20,724 20,254 20,060 19,705
% of revenues 37.2% 36.0% 33.4% 31.1% 30.0%
% yoy growth -1.3% -2.3% -1.0% -1.8%
Asia-Pacific 18,344 18,997 19,379 18,755 19,705
% of revenues 32.5% 33.0% 31.9% 29.1% 30.0%
% yoy growth 3.6% 2.0% -3.2% 5.1%
North America 7,681 8,635 9,731 10,217 9,524
% of revenues 13.6% 15.0% 16.0% 15.9% 14.5%
% yoy growth 12.4% 12.7% 5.0% -6.8%
Middle East 5,413 5,181 6,520 8,612 9,852
% of revenues 9.6% 9.0% 10.7% 13.4% 15.0%
% yoy growth -4.3% 25.8% 32.1% 14.4%
Latin America 3,540 4,030 3,844 4,096 4,598
% of revenues 6.3% 7.0% 6.3% 6.4% 7.0%
% yoy growth 13.8% -4.6% 6.6% 12.2%
Other countries 496 882 985 2,710 2,299
% of revenues 0.9% 1.5% 1.6% 4.2% 3.5%
% yoy growth 77.8% 11.7% 175.1% -15.2%
Table 3 – Geographic revenue split at Airbus Group, 2012 to 2016
5
For 2016, the yearly backlog battle between Boeing and Airbus seems to have been won by Boeing, but the outlook is in favour of Airbus in 2017, due to the expected resolution of many manufacturing execution problems, facilitating more deliveries in the coming year. Nonetheless, the delivery targets for commercial aircrafts have not been met for all aircraft families/types. Airbus Group recently announced the increase of the annual delivery target from 650 aircraft to 670 aircrafts for 2017 onwards. This is supposed to send a positive signal to investors and stakeholders, that the company expects to increase production efficiencies after some important production and delivery delays, mostly in the A350 XWB program and in the provision of the new engine option (neo) upgrade for the A320 family, which had caused many customers to convert orders within the A320 family to the current engine option (ceo).
Airbus Group faces increasing competitive landscape in the A&D industry
The industry of Aerospace and Defence in which Airbus Group operates varies entirely from the other two divisions in terms of competitive landscape. Within the A&D industry, Airbus additionally faces an increased competitive influence of technology-focused, multinational OEMs, such as BAE Systems, Safran, or L-3 Communications.
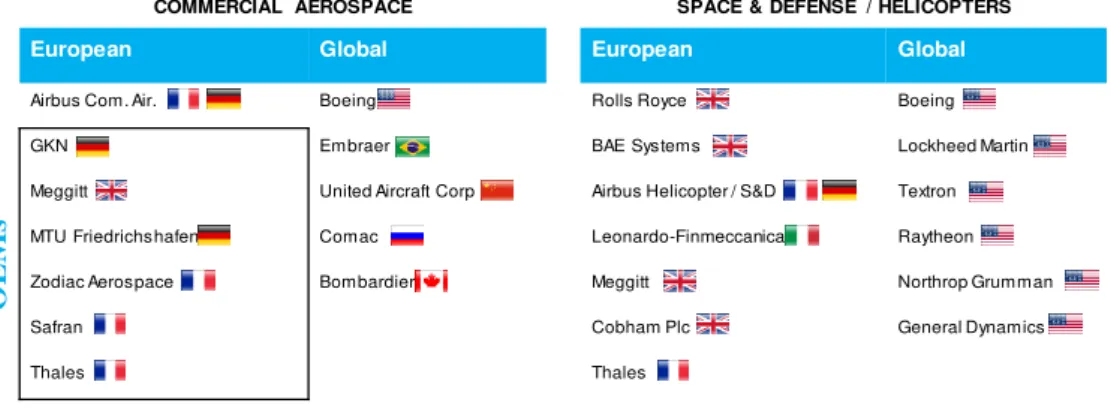
The A&D industry competition map (Figure 3) distinguishes between commercial aircraft jet manufacturers for passenger and freight transport
(commercial aerospace) and defence and space technologies, services and aircraft manufacturers (encompassing helicopters for commercial and defence use). Figure 2 shows the explained market split with leading listed European and other global market leaders. Generally speaking, the US market is financially the most active and risk-prone market. Therefore, US companies tend to outperform European competitors on a pure multiple basis and in terms of market value. This is also
reflected in the regression of comparable companies’ stock returns on the Euro STOXX 50
96,114 71,516 46,132 31,469 28,176 27,368 24,660 23,526 23,247 20,986 20,084 15,605 15,237 14,420 11,188 10,446 9,796 8,434 7,020 Boeing Airbus Lockheed Martin General Dynamics United Technologies BAE Systems GE Aviation Northrop Grumman Raytheon Rolls Royce (Holdings plc) Safran Thales Honeywell Aerospace Finmeccanica Bombardier Aerospace L-3 Communications Textron
Mitsubishi Aviation and…
Huntington Ingals
Figure 2 – Global leading A&D manufacturers 2015 by sales in USD mn, Source: Statista, 2016
0% 5% 10% 15% 20% 25% 30% -500 0 500 1000 1500 2000
2011 2012 2013 2014 2015 2016
Order books Airbus vs. Boeing
Total Gross Orders Cancellations AIR Total Gross Orders Cancellations BOE
6
index benchmark to derive market riskiness based unlevered betas for Airbus, reflecting lower market returns for the European market (see Appendix 5).
On both global and European level, we observe a trend towards OEMs disrupting the current market structure and gaining an increased market share, in particular in the commercial aerospace business. On European level, Airbus competes against a variety of OEMs from France, the UK and Germany that are operating as components and engines manufacturers as well as technology providers in both fields, commercial aircraft manufacturing and space & defence.
Historically, The Boeing Company (Boeing) and Airbus have formed a strong duopoly position in the commercial aircraft manufacturing market. Only in the last years, this duopolistic market position began to break with OEMs obtaining direct market share. Especially Bombardier (CAN), The Commercial Aircraft Corporation of China, Ltd. (Comac, CN), and United Aircraft Corporation (Irkut, RUS) managed to capture first significant market shares in terms of backlog.
The latter puts pressure on both Airbus and Boeing to fast forward production rates, decrease inefficiencies and delays, but also to be aware of the importance of technological advances and innovation within the A&D industry. The industry-wide importance of more technological
O
E
Ms
Figure 4 – Global backlog breakdown development by OEM, 2004 vs. 2015, Sources: Airbus, Boeing, Bombardier, Flightglobal, 2016
COMMERCIAL AEROSPACE SPACE & DEFENSE / HELICOPTERS
European Global European Global
Airbus Com. Air. Boeing Rolls Royce Boeing
GKN Embraer BAE Systems Lockheed Martin
Meggitt United Aircraft Corp Airbus Helicopter / S&D Textron
MTU Friedrichshafen Comac Leonardo-Finmeccanica Raytheon
Zodiac Aerospace Bombardier Meggitt Northrop Grumman
Safran Cobham Plc General Dynamics
Thales Thales
7
integration proved to be a hot topic during the Farnborough Airshow1 in July this year, where new systems and applications were presented with the objective to make use of the high amount of data generated by each aircraft in use and finally, convert this data into useful information that can help improve aircraft operations for airlines and manufacturers.
Drivers and trends of Airbus’ commercial aerospace business
Airbus Group is the world`s second largest manufacturer and seller of commercial aircraft in terms of backlog and annual sales right behind the US American Boeing Company. Within the Aerospace and Defence market, Airbus holds a solid position and competes against industry giants General Dynamics, Lockheed Martin and Textron.
Key drivers for Airbus value creation and the industry
As in every business sector, the aerospace and defence industries entail some key value drivers which drive success and failure. Especially in terms of valuation and ratio analysis, these key value drivers play a major role. While asset-light businesses, such as technology companies and services companies, potentially face higher margins and are more agile given the higher flexibility in their business model, asset-heavy industries, such as Airbus’ aerospace and defence industry, need to be looked at from a different perspective. Especially the backlog analysis is a milestone for the success of each company within these industries.
Another key value driver for Airbus’ commercial aerospace business is the revenue per
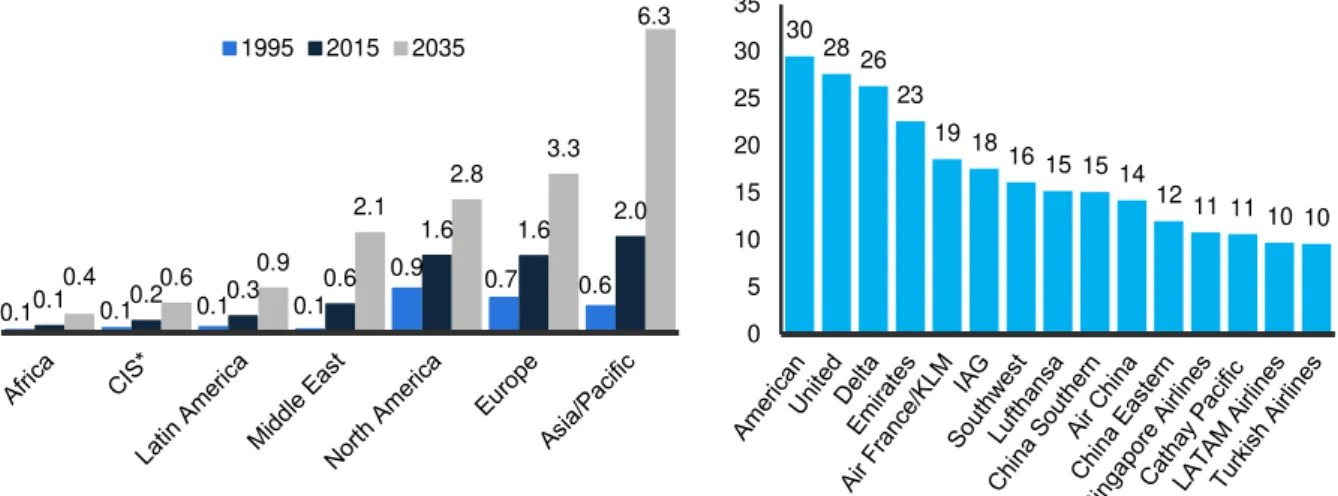
passenger kilometre (RPK), which measures air traffic revenue performance. International airline companies are Airbus main customers and derive most of their own business value from this key value driver. The ratio also enables companies and analysts to track air traffic growth. RPK is calculated by multiplying the number of revenue-paying passengers of an airline by the distance in km that was travelled. While this perimeter of air traffic may not be directly used to forecast revenues of aircraft manufacturers such as Airbus Group, it serves as an excellent indicator for airline market growth and performance, which eventually and next to other things determine Airbus revenues. Figure 6 highlights the strong trend towards increased air passenger traffic by comparing the actual increase from 1995 to 2015 with the expected increase until
1 The Annual Farnborough Airshow is the largest international professional and public exhibition and fair of
8
2035. Especially Asia Pacific and Europe will observe a significant increase in RPK in domestic air traffic. Unsurprisingly, there is a similar regional representation when looking at the worldwide leading airlines ranking by RPK in 2015 (see Figure 5). This list is headed by North American, Middle Eastern, European and Asian airline companies. Both Europe and Asia Pacific are expected to more than double their RPK until 2035 up to RPK 3.3bn and RPK 6.3bn
respectively.
Due to the expected increase in RPK, the growth of the middle class and of the general population, as well as the increased amount of aviation mega cities in the Middle East, Europe and Asia, the averaged compounded annual growth rate (CAGR) of 179 passenger air traffic flows is high at 5.5% for the period 2015-2025. It is to note that expected year-on-year growth rates of Airbus are likely to be higher than the CAGR until 2020, which is why we assume an annual overall revenue growth rate of over 6% per annum for those years. The main driver for the increased demand in air travel is the welfare growth in Asia Pacific and the Middle East. Apart from that only an estimated 6% of the worldwide population took an airplane in 2015, leaving room for additional demand once welfare and global connectivity reach higher levels. Likewise, air freight traffic is expected to increase
over the next ten years at a CAGR of 4.8%. However, since Airbus only sells one cargo freighter, the A330-200 Freighter, at comparably high cost (average price per unit in 2016 was USD 235m), we do not expect Airbus to benefit from air cargo growth.
1,360
1,284
130
120
63
0 500 1000 1500
Single-aisle
Twin-aisle
Regional jet
Freighter
Turboprop
Figure 7 – Projected aircraft deliveries from 2016 to 2035, Source: Statista, 2016
30 2826
23 19 18
16 15 1514
12 11 1110 10
0 5 10 15 20 25 30 35
0.1 0.1 0.1 0.1
0.9 0.7
0.6
0.1 0.2 0.3 0.6
1.6 1.6 2.0
0.4 0.6 0.9
2.1 2.8
3.3 6.3 1995 2015 2035
Figure 6 – Air passenger traffic from 1995 to 2035, by region (in billion RPKs), Source: Statista, 2016
9
Trends driving the commercial aerospace industry
The commercial aerospace subsector encompasses passenger air transport as well as air cargo transportation. Both business pillars are supposed to double in terms of annual passenger number as well as commercial passenger and cargo aircraft fleet. We observe that the commercial aerospace market shows some positive growth trends in 2016, which are causing high expectations on sales growth and operational earnings growth. This trend is fuelled by
several aspects, being mostly the commercial airlines’ hunger for innovative, fuel-efficient
airplanes of the next generation as well as the obvious annual increase in air passenger transport. The industry is characterized by high needs for technological and material novelties increasing efficiencies and aircraft performance on a constant basis while improving the ecological footprint of the environmentally heavy industry.
According to the Global Market Forecast 2016-2035 study, annually published by Airbus, the amount of aviation mega cities, defined as cities with over 10,000 daily long-haul passengers, will increase from 55 cities in 2015 to over 78 cities in 2025 and 93 in 2035. These so-called mega cities will mostly be located in Asia Pacific, Europe, and the Middle East and will drive a big part of the future’s air travel – a trend that can already be observed now with expanding high-class airlines from the Middle East and big air travel terminals such as Singapore for
international travel. Airbus’ order book is reflecting this trend with major Asian and Middle
Eastern airlines, such as Emirates, being the primary clients for high quality, technologically advanced and capable aircraft. At the same time, the global estimated proportion of the middle class will increase to up to 55% of the total population in 2035, compared to 38% in 2015. Together with increased purchasing power of the middle class, counting as households with an annual income between $20,000 and $150,000, travelling for both leisure and business purposes will increase. The latter phenomena might also increase air cargo demand through globally steered necessity of production components and goods.
Currently, there is a concern in the commercial aerospace market that OEMs are oversupplying the market at between 1% to 2% (equalling approx. 300 aircraft), as build rates and deliverables increased significantly during the last 5 years. Experts are afraid that this oversupply with exceed demand and unbalance the velocity of deliverables. Even though, both Airbus and
Boeing levelled up their build rates, they are still dependent on airlines’ demand in fleet
10
Airbus’ Space and Defence business
Airbus Defence and Space (D&S) is the second largest business unit of Airbus Group, generating average annual revenue of EUR 12,000mn (accounting for slightly over 20% of Group revenues). Airbus offers satellites and launcher systems, combat aircraft, missile systems, radar, defence electronics, and unmanned aerial systems.
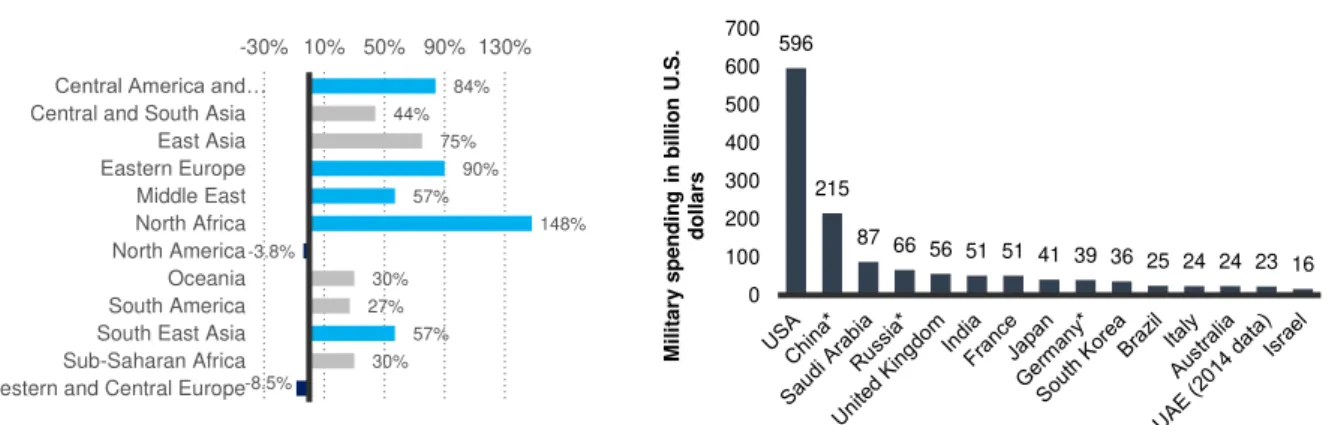
As was previously explained, the main value driver for demand in solutions and aircraft products in the space and defence section is the level of global military spending, as these are mostly financed by governments (federal ministries of defence) or specialized agencies and institutions such as the CIA. 2016 and 2015 market results for the defence market were strongly hit by the major decrease in military spending in the USA, which decreased by -4% since 2006. The USA has historically shown to be the country with the highest military spending worldwide consequently driving the industries revenues. Through the major cut rates (4% alone equal around USD 25bn which need to be compensated for), the defence industries performance observed a major hiccup. Together with the decline in Western and Central European military spending, the defence industry faces challenges. Revenues of major defence market participants were driven by emerging countries and their governments, such as the Middle East (Saudi Arabia, UAE, Israel), North Africa (148% increase in military spending since 2016), Central Europe as well as Central America and Asia Pacific. Notably, Airbus Space & Defence sales are not comprehensively altered by the US Department of Defence (DoD) spending trends, as the DoD does not engage in relevant with business with Airbus Group. In 2016, contract awards from the DoD went to market leaders Lockheed Martin, Boeing, General Dynamics and BAE Systems. The envisaged upgrade of Boeing and BAE Systems warning and survivability systems, worth USD 4bn, is currently threatened by the President-Elect Donald Trump expressed intentions to cut the program, as he considers it being pricey. This is perceived as
596
215
87 66 56 51 51 41 39 36 25 24 24 23 16
0 100 200 300 400 500 600 700 M il it a ry s p e n d in g in b il li o n U.S . d o ll a rs
Figure 9 - The 15 countries with the highest military spending worldwide in 2015 (in USD bn), Source: Statista, 2016
84% 44% 75% 90% 57% 148% -3.8% 30% 27% 57% 30% -8.5%
-30% 10% 50% 90% 130%
Central America and…
Central and South Asia East Asia Eastern Europe Middle East North Africa North America Oceania South America South East Asia Sub-Saharan Africa Western and Central Europe
11
very negative news after his election fuelled hopes for DoD budget increases after large cut rates in the past years.
Discussed military budgets are strongly influenced by the number of ongoing military missions to engage and minimize aggressive conflicts or wars, the level of political instability in a country and the level of involvement of countries not forming a direct part in these conflicts. In times of wide spread war climate, the demand for defence aircraft and technology is rising. Airbus Space and Defence is less influenced by US movements as main customers are European with the German government currently being the leading customer. Ever since the official split from aerospace electronic systems provider BAE Systems in 2006 (used to be 20% minority stakeholder in EADS), it is also important to notice the rising competition between the two companies through higher bargaining power on BAE’s end and increasing prices for electronic systems.
In the beginning of this year, we observed yet more unsatisfying news regarding the A400M airlifter. The airlifter has been designed for tactical, long-distance military and humanitarian logistics missions, specifically ordered by the European NATO countries (Belgium, France, Germany, Luxemburg, Spain, Turkey and the UK) and Malaysia in 2005. Demand was consequently strong with European governments and currently the order book entails 174 aircrafts, but only 34 have been delivered so far. Due to several technical and organizational reasons, the program is years behind its delivery schedule. Especially Germany, the largest customer for the A400M, has been waiting extendedly for delivery and claimed for damages exceeding EUR12.7m this summer, due to deliveries that should have been placed earlier this year and in the coming years. Out of the 17 aircrafts the state of Germany should have received by now, only seven were delivered. Due to the technical development challenges, costs increased significantly and prices rose from initially EUR 153m to EUR 181m per airlifter. We expect that D&S will remain strong as a segment. However, large orders for military aircraft and systems are more likely to be retained by larger US and, for instance, Russian competitors were the overall demand is expected to increase due to political changes and increased willingness to interfere in the global instability caused by wars and other conflicts.
Airbus Helicopter business
12
deliveries. Helicopters revenues continue to be split 50-50 between its civil and military helicopters, of which 55% stem from European and Middle Eastern countries, 25% from Asia Pacific and 20% from North and South America. Airbus Helicopters continues to be world market leader in the civil market with 45% of market share. It faces more challenges in the military market where it competes against a variety of companies in a larger overall market (see Figure 11). For the valuation of Airbus, it was also therefore chosen to value it as one part together with Airbus D&S, since both business
units compete against the same market players.
Macroeconomic trends and model imperatives
The market for commercial aircraft is highly driven by oil price developments and financing cost trends. Airlines constantly seek for a trade-off between decent financing costs and operational costs. Commercial aircrafts are expensive and airlines tend to order them in bulks, hence exposing them as a business to huge financing (and operational) risks. In a somewhat sustainable low interest rate environment, as it was the case for the last years, buying new aircrafts is much more attractive for airlines, as they assume that financing quotes will stay as low as they were 2 or 3 years ago. This is one reason why backlog has increased so significantly,
Figure 13 – Worldwide air traffic passenger revenue from 2004 to 016 in USD bn, Source: Statista
Figure 12 - Backlog development at Airbus from 1998 to 2015, Source: Airbus company filings
294 323
365 399
444
374 445
512
531 539 539 518 511
200 250 300 350 400 450 500 550 600
2004 2005 2006 2007 2008 2009 2010 2011 2012 2013 2014 2015 2016
R
e
v
e
n
u
e
in
b
il
li
o
n
U
.S
.
d
o
ll
a
rs
Figure 10 – Deliveries developments by helicopter type, Source: Airbus Helicopters, Analyst research
13
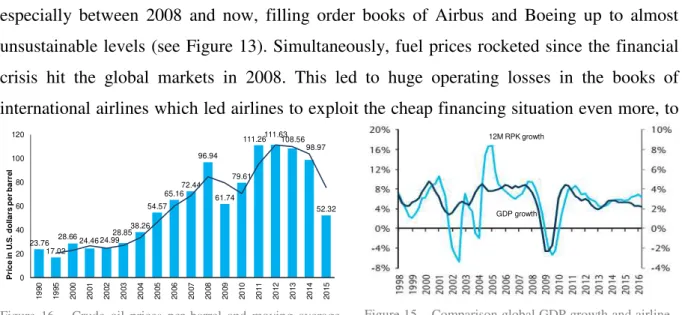
especially between 2008 and now, filling order books of Airbus and Boeing up to almost unsustainable levels (see Figure 13). Simultaneously, fuel prices rocketed since the financial crisis hit the global markets in 2008. This led to huge operating losses in the books of international airlines which led airlines to exploit the cheap financing situation even more, to
quickly buy more modern and fuel efficient aircrafts that will compensate for the pressure on prices and operating margins. As soon as the oil prices dropped again from 2015 until now, airlines became even more incentivized to buy aircraft cheaply now, bringing order backlog of Airbus and Boeing to where they are today. As Figure 16 shows, while oil crude prices may be sustainable at low levels, this will fuel air traffic growth even more and increase demand for jet kerosene products. Beyond that, these movements justify the current ratio of 60-40 between new aircraft order and replacement aircraft orders.
Industry voices raise their concern that the order books that were filled under these low interest rate conditions will not be sustainable due to the buying motives explained before. However, we now observe that financing costs are slowly rising - the Federal Reserve raised the policy rates by 0.25% after a long time of historical lows. Higher financing costs will alter airlines’ decisions in buying new aircraft and replacing old ones and might lead to high order cancellation ratios within the next years.
Another trend that afflicts the A&D industry is the continuing appreciation of the dollar which is tried to be eased by slowly increasing borrowing rates in the US. Since all major aircraft manufacturers and OEMs state their prices in dollars to provide globally levelled and comparable playing field, especially companies outside the United States suffer from price increase due to currency appreciation. Only from 2013 to 2015 average prices published in the annual Airbus aircraft price list increased by 7%. This will continue to have an impact on future prices that Airbus sets and will potentially also increase manufacturing costs, as OEMs will be forced to increase their prices accordingly, especially those located in emerging markets where the dollar appreciation hits even harder. At the same time, we observe that the average backlog
23.76 17.02 28.66 24.46 24.99 28.8538.26 54.57 65.16 72.44 96.94 61.74 79.61
111.26111.63108.56 98.97 52.32 0 20 40 60 80 100 120 1 9 9 0 1 9 9 5 2 0 0 0 2 0 0 1 2 0 0 2 2 0 0 3 2 0 0 4 2 0 0 5 2 0 0 6 2 0 0 7 2 0 0 8 2 0 0 9 2 0 1 0 2 0 1 1 2 0 1 2 2 0 1 3 2 0 1 4 2 0 1 5 P ri c e in U .S . d o ll a rs p e r b a rr e l
Figure 15 – Comparison global GDP growth and airline traffic growth (in RPK), Source:Statista, Airbus, Flightglobal, Analyst assumptions
12M RPK growth
GDP growth
14
period is strongly increasing and momentarily peaks at 9 years (compared to normal backlog periods of between 2 to 5 years). These seven years in Airbus’ order books do not account for major delays in production demonstrating more inherit exchange rate and financing risks that Airbus as a manufacturer, but also airlines as clients and the industry suppliers suffer from. We just observed these dynamics this year in the many up and downgrades within the A320 family engine option upgrade context.
Airlines historically financed new aircrafts through either loans or leases (operating or financing). Lately, leasing has become an even more attractive financing option and currently leasing agencies hold over 21% of the total backlog value and continue to grow. Given that the backlog value has increased so significantly to over USD 2.5 trillion, the assessment of financing vulnerability of airlines and leasing agencies has become increasingly important. Judging only by the credit rating of airlines costumers (limited to those rated by agencies), around 12% of the total backlog value, equalling USD 225bn, is based on orders by airlines with extremely low creditworthiness (rating off BB or lower). Consequently, airline financing which is influenced by overall access to low interest rates loans and leasing agreements, and strongly exposed to changes in exchange rates, oil prices and policy interest rates, is one of the high risks of the entire commercial aircraft manufacturing industry.
Valuation
Airbus Group was valued using two different valuation methods: the discounted cash flow (DCF) valuation, based on a sum of the parts valuation, and the multiples-based, market-oriented valuation approach. Both valuation models provide appropriate valuations that already price in the many high risks, mainly caused by execution uncertainty, exchange rate fluctuations, oil price fluctuations and the general dynamics of cyclical businesses. While a DCF valuation will always end up providing a lower valuation than market-driven multiples-based valuations, we consider the DCF method the most appropriate method for the business of Airbus Group in order to capture all movements in its heavy balance sheet correctly, through adequate and company adjusted forecasts.
Discounted Cash Flow Valuation
15
the Group. Consequently, we used a sum-of the-parts approach for the DCF valuation. While Airbus CA and HQ were considered to be one “part”, the Airbus business units D&S and Airbus
Helicopters were considered the second “part”. As was explained beforehand, both units
compete against very similar market competitors, may face a similar market environment and have similar key value drivers. At the same time, Airbus Helicopters contributes only c. 10% to total revenues and lacks adequate comparables in terms of business model and size, and finally, Airbus Group annual reports provide only little information on both divisions, Helicopters and S&D. Within the revenue forecast model, it is assumed that both divisions will decrease their contribution to total Group sales to 25%. This is mostly due to a lower CAGR (1% between 2015 and 2020) in the Aerospace and Defence sector, slowing down the business and its revenue contribution to 16.5% in 2020.
Airbus Helicopters is expected to contribute slightly to total revenues in the future (9.5% in 2015 to 8.5% in 2020) but shows a stable CAGR of 3%. The main driver of future revenue growth of the Group is the overperforming Airbus Commercial Aerospace division which is expected to outperform RPK growth (worldwide CAGR c.5.5%) and demand growth until 2020 with a CAGR of 7% (CAGR 2012 to 2015 was 7%). This expected outperformance is based on the still predominant industry position, especially in terms of backlog (see Appendix8), as well
Income Statement in EUR mn 2012A 2013A 2014A 2015A 2016F 2017F 2018F 2019F 2020F Revenues 56,480 57,567 60,713 64,450 65,682 69,662 73,968 78,423 83,167
YoY % growth 15.0% 1.9% 5.5% 6.2% 2.0% 6.1% 6.2% 6.0% 6.0%
Airbus 36,999 38,561 41,531 45,090 47,345 50,659 54,205 57,999 62,059
% of revenues 65.5% 67.0% 68.4% 70.0% 72.1% 72.7% 73.3% 74.0% 74.6%
Airbus Helicopters 5,724 5,811 5,996 6,153 6,215 6,277 6,528 6,789 7,060
% of revenues 10.1% 10.1% 9.9% 9.5% 9.5% 9.0% 8.8% 8.7% 8.5%
Airbus Defence & Space 13,154 12,739 12,728 12,917 11,833 12,425 12,922 13,309 13,709
% of revenues 23.3% 22.1% 21.0% 20.0% 18.0% 17.8% 17.5% 17.0% 16.5%
Other / HQ / Consolidated 603 456 458 290 290 302 314 326 339
% of revenues 1.1% 0.8% 0.8% 0.4% 0.4% 0.4% 0.4% 0.4% 0.4%
Costs of Goods Sold (48,582) (49,613) (51,776) (55,599) (56,487) (59,700) (63,390) (67,209) (71,274)
% of revenues 86.0% 86.2% 85.3% 86.3% 86.0% 85.7% 85.7% 85.7% 85.7%
Gross Margin 7,898 7,954 8,937 8,851 9,195 9,962 10,577 11,215 11,893
% of revenues 14.0% 13.8% 14.7% 13.7% 14.0% 14.3% 14.3% 14.3% 14.3%
Operating expenses (6,029) (5,880) (5,992) (6,111) (6,203) (6,579) (6,985) (7,406) (7,854)
% of revenues 3.0% 2.8% 2.5% 2.5% 2.3% 2.3% 2.3% 2.3% 2.3%
R&D expenses (3,160) (3,118) (3,391) (3,460) (3,607) (3,825) (4,062) (4,306) (4,567)
% of revenues 5.6% 5.4% 5.6% 5.4% 5.5% 5.5% 5.5% 5.5% 5.5%
Share invest. profits under equity method 241 434 840 1,016 633 633 633 633 633 Reported EBITDA 4,163 4,435 5,935 6,222 5,569 6,076 6,409 6,800 7,243
EBITDA margin 7.4% 7.7% 9.8% 9.7% 8.5% 8.7% 8.7% 8.7% 8.7%
One-off transactions 376 558 64 265 0 0 0 0 0
Normalized EBITDA 4,539 4,993 5,999 6,487 5,569 6,076 6,409 6,800 7,243 EBITDA margin adj. 8.0% 8.7% 9.9% 10.1% 8.5% 8.7% 8.7% 8.7% 8.7%
Depreciation 2,053 1,927 2,150 2,466 1,944 2,060 2,184 2,359 2,571
EBIT 2,486 3,066 3,849 4,021 3,625 4,016 4,225 4,441 4,672
% of revenues 4.4% 5.3% 6.3% 6.2% 5.5% 5.8% 5.7% 5.7% 5.6%
Interest income 237 161 142 183 142 107 107 107 107
Interest expense (522) (493) (462) (551) (684) (848) (848) (848) (848) Other financial result (168) (278) (458) (319) (306) (306) (306) (306) (306)
EBT 2,033 2,456 3,071 3,334 2,778 2,968 3,177 3,394 3,624
Income taxes (438) (477) (863) (800) (667) (712) (763) (814) (870)
Net income 1,595 1,979 2,208 2,534 2,111 2,256 2,415 2,579 2,754
16
as its increased backlog volume causing high amounts of revenues for the next five years when deliveries take place. For 2016 we accounted for a small drop in YoY growth rates to only 2% which was caused by operational issues in the A350 XWB program, the “ceo” to “neo” upgrade failures within the A320 family as well as the operational issues arising from A400M delays and penalty payments. Based on historic averages, Airbus headquarters will grow at a CAGR of 3%, which is lower than the annual growth before but captures relevant value increases from consolidations, joint ventures and group activities.
For the terminal value (TV), we assumed a 2% growth rate in revenues and operating costs, which covers the average global inflation rate and GDP growth and reflects a realistic growth scenario for a mature company like Airbus.
The underlying business model of Airbus is built on the sale of highly complex products that are large in size, consistent of uncountable heavy components, lengthy manufacturing processes and finally, high in price. The entire A&D industry, especially the parts of it concentrating on aircraft manufacturing, derives its main value from aircraft order backlog value and finally, the ability to convert these orders into deliveries in a timely and resource-efficient manner. Historically, the industry shows low operating profit margins ranging between 5% and -1% during the period of 2004 and 2013. Since 2014 the A&D sector experiences an upward shift bringing operating profit margins to as much as 8%, while overall operating profit values are increasing. Airbus is still not able lock-in such levels of operating profit margins due to high levels of COGS that amount to approx. 86% of revenues (8-year average since 2012). As only minor efficiency-increases are to be expected from the restructuring, for instance through employee cut rates and some cost synergies between the HQ and Airbus Commercial Aerospace, a decline of 0.3% (equalling EUR 200m savings) in annual COGS to a 85.7% of revenues was assumed for the forecasting period. Consequently, gross margin levels off at 14.3% over the 5-year forecasting period, a margin that is competitive with Boeing’s performance. This will cause operating margins to increase slightly up to 5.7% on average for the next 5 years.
17
loss-making programs, e.g. the A380 wide-body aircraft are cut, R&D costs are required at constant operational level. These costs are often offset only after years of development, when delivery delays already occurred. The latter are mostly due to delays or technical flaws of supplier components. The execution risk lies in the challenge of turning pricy aircraft programs into actual deliverable aircrafts that have impeccable functionalities and that are delivered in a timely manner. Furthermore, these executions risks are influenced by the macroeconomic market dynamics, namely increases in oil prices, global GDP level developments and economic crises as well as the political environment. This is the reason why Airbus’s business model is so dependent on operating working capital and other working capital like items. These encompass the typical changes in inventories, trades receivables and payables, but also the change in other current assets and liabilities, provisions and most of all advance payments. The latter are the main upfront cash inflow that Airbus CA receives and holds as current and non-current other liabilities. Advance payments are typically determined based on the level of completion method, were a customer pays a certain amount every time a certain level of manufacturing was completed. To forecast advance payments based on current and non-current other liabilities, we computed historical revenue turnovers (as %) and took the historical average but only of the last three years as this captures the ratio growth better. From 2016 to 2018 non-current other liabilities form 21.1% of revenues, and from then on slightly decrease to merely 20.4% of revenues, since long-term advance payments should slightly decrease due to commercial aircraft market dynamics explained before. Current other liabilities will remain constant at 42.3% of revenues for the 5-year forecasting horizon due to expected manufacturing efficiencies.
All other current assets and liabilities, except for the operating working capital items explained below, were forecasted by taking their averaged historical revenue turnover (in %) and maintain the average level for the forecasting period of 5 years.
In terms of free cash flow and working capital forecast for the two “parts”, all non-cash other
18
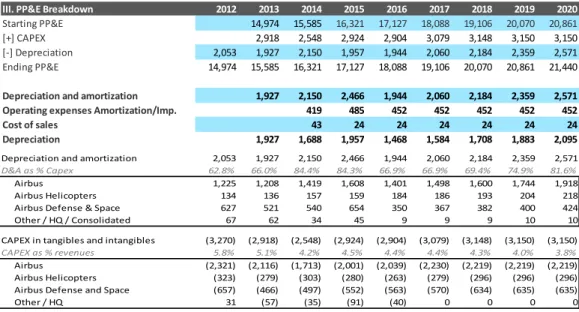
Non-current assets that were not property, plant and equipment (PP&E) or strategic investments were forecasted based on straight-line projections, hence maintained constant. PP&E was forecasted by applying the simple BASE analysis, as can be seen in Table 5. In the balance sheet, constant annual investment property value of EUR 66m was added to ending balance PP&E. We expect Capital Expenditure (Capex) to growth with sales for the next years. We forecasted Capex based on average historical revenue turnover of each division until 2018 (Airbus Commercial Aerospace already decreases turnover by 0.2% in 2018), and projected Capex straight-line after that. Depreciation and Amortization grow initially at the same rate as Capex, and were then set to grow faster at 6%, 8% and 9% for 2018 to 2020 respectively. This change was modelled to imitate a more natural development of Airbus in terms of Capex and D&A, which will eventually equal one another in a mature and established company that does
not invest more than it depreciates and amortizes in the long-term every year. For the terminal value projections, we assumed that depreciation grows by 2% in perpetuity and that Capex is 102% of the depreciation in the TV to spend slightly more than what is amortized and depreciated.
Airbus Group does not state the precise split of operating working capital (inventories, trade receivables, and trade payables) between the three business units, hence assumptions on how to split them adequately were made on basis of the general business model propositions and information provided on in-year changes in the financial statements (see Table 6). Group inventories, payables and receivables were forecasted on basis of averaged historic ratios of revenues, which were then used as a constant revenue turnover ratios for the 5-year forecasting period. Through the storage and acquisition of huge components, engines and technological
Depreciation and amortization 2,053 1,927 2,150 2,466 1,944 2,060 2,184 2,359 2,571
D&A as % Capex 62.8% 66.0% 84.4% 84.3% 66.9% 66.9% 69.4% 74.9% 81.6%
Airbus 1,225 1,208 1,419 1,608 1,401 1,498 1,600 1,744 1,918
Airbus Helicopters 134 136 157 159 184 186 193 204 218
Airbus Defense & Space 627 521 540 654 350 367 382 400 424
Other / HQ / Consolidated 67 62 34 45 9 9 9 10 10
CAPEX in tangibles and intangibles (3,270) (2,918) (2,548) (2,924) (2,904) (3,079) (3,148) (3,150) (3,150)
CAPEX as % revenues 5.8% 5.1% 4.2% 4.5% 4.4% 4.4% 4.3% 4.0% 3.8%
Airbus (2,321) (2,116) (1,713) (2,001) (2,039) (2,230) (2,219) (2,219) (2,219)
Airbus Helicopters (323) (279) (303) (280) (263) (279) (296) (296) (296)
Airbus Defense and Space (657) (466) (497) (552) (563) (570) (634) (635) (635)
Other / HQ 31 (57) (35) (91) (40) 0 0 0 0
Table 5 - PP&E breakdown through base forecast D&A and Capital Expenditure as % of revenues forecast, Source Airbus company filings, Analyst assumption and research
III. PP&E Breakdown 2012 2013 2014 2015 2016 2017 2018 2019 2020
Starting PP&E 14,974 15,585 16,321 17,127 18,088 19,106 20,070 20,861 [+] CAPEX 2,918 2,548 2,924 2,904 3,079 3,148 3,150 3,150
[-] Depreciation 2,053 1,927 2,150 1,957 1,944 2,060 2,184 2,359 2,571
Ending PP&E 14,974 15,585 16,321 17,127 18,088 19,106 20,070 20,861 21,440
Depreciation and amortization 1,927 2,150 2,466 1,944 2,060 2,184 2,359 2,571
Operating expenses Amortization/Imp. 419 485 452 452 452 452 452
Cost of sales 43 24 24 24 24 24 24
19
devices, Airbus CA owns most of the inventories which partly also reflect backlog and delays in delivery (if the inventories are stuck in the warehouses of Airbus). The share on the basis of which the business unit specific split was made is shown in orange. Trade payables and trade receivables were forecasted based on the divisions’ averaged contribution to revenues over time. CA covers 72% of receivables and payables, D&S 18% and Helicopters 10%.
All other non-current assets and liabilities, not previously explained were projected to be constant over the next years.
In order to value the two parts, we computed the unlevered free cash flows for both “parts” (see p. 26 on the sum-of-the-parts valuation for more details) and discounted them at the business
unit’s specific WACC. For that purpose, we selected a small number of comparable companies
and a market benchmark, the Euro STOXX 50 2, and regressed the company’s past 5 year
weekly returns on the market returns. This provided us with the levered betas for our comparable companies. After unlevering the comparable company betas by using their company specific debt-to-equity ratio, we took the average of the betas and relevered it at the Airbus specific debt-to-equity ratio. Applying the CAPM asset pricing model, we were able to compute two industry specific costs of equity. These are based on the market risk premium of 7.01% and the assumed risk free rate of 1% (based on the expected long-term policy rate of German 10-year Government Bunds) and the industry specific Airbus betas3. The cost of equity for DA/HQ is 7.46% and 6.47% for D&S/Helicopters. The company has 88% equity and 12% debt. Given that the units rely on group financing, we assumed that the debt-to-equity structure does not change between units, which would have been done ideally.
2 See Appendix 1 and 2 for the Euro STOXX 50 moving average and the index composition.
3 The asset beta for Airbus CA was 1.013 and for D&S and Helicopters it was 0.852. The difference in the betas
reflects the different levels of risks of each “part” compared to the market riskiness. For a detailed overview of the beta regression see Appendix 5.
Table 6 – Forecasting operating working capital items and business unit breakdown, Sources: Analyst assumptions, Airbus company filings
Inventories 22,201 24,023 25,355 29,051 33,481 33,438 33,341 35,350 37,488 % share Airbus (Commercial Aircraft Jets) 18,871 20,420 21,552 24,693 28,459 28,422 28,340 30,047 31,865 85% Airbus Helicopters 2,220 2,402 2,536 2,905 3,348 3,344 3,334 3,535 3,749 10% Airbus Defense & Space 1,110 1,201 1,268 1,453 1,674 1,672 1,667 1,767 1,874 5%
Other / HQ / Consolidated 0 0 0 0 0 0 0 0 0 0%
Trade receivables 6,183 6,628 6,798 7,877 7,640 7,990 8,484 8,995 9,539 Airbus (Commercial Aircraft Jets) 4,452 4,772 4,895 5,671 5,501 5,753 6,109 6,476 6,868 72%
Airbus Helicopters 587 630 646 748 726 759 806 855 906 10%
Airbus Defense & Space 1,113 1,193 1,224 1,418 1,375 1,438 1,527 1,619 1,717 18%
Other / HQ / Consolidated 31 33 34 39 38 40 42 45 48 1%
Trade liabilities 9,271 9,668 10,183 10,864 11,762 11,640 12,360 13,104 13,897 Airbus (Commercial Aircraft Jets) 6,675 6,961 7,332 7,822 8,469 8,381 8,899 9,435 10,006 72% Airbus Helicopters 881 918 967 1,032 1,117 1,106 1,174 1,245 1,320 10% Airbus Defense & Space 1,202 1,740 1,833 1,956 2,117 2,095 2,225 2,359 2,501 18%
20
The enterprise value of each part was determined by discounting the unlevered free cash flows back to today at the respective WACC4.
Off-balance sheet operating leases were capitalized at the Group’s cost of debt (3.5%, based on historic financial statement information) and corrected for their tax effect, which arises from their debt-like nature (interest trigger tax shield). After summing both “part’s” respective enterprise values (EV), we obtain a total EV after capitalized leases of EUR 62.8bn for Airbus Group. We subtract financial debt net of cash, under-funded pension fund accounts and add back the minority interests in order to obtain the final equity value of Airbus Group which equals EUR 49.9bn.
The target price is obtained by dividing the fair equity value by the total number of diluted shares outstanding (EUR 49.9bn / 772.71m). Our determined target price is EUR 64.52 (vs. actual market price of EUR 60.02) reflecting expected upsides.
In the sensitivity analysis, we tested the EVs sensitivity to different WACCs and different terminal value growth rates. We observe that the EV is much more sensitive to changes in the WACC or TV growth rate within the Airbus Commercial Aerospace division cash flows than
in the D&S/Helicopters “part”.
Multiples valuation
We conducted a multiple valuation based on 2016 year-to-date multiples. For the Commercial Aerospace industry, it was complicated to find true comparables to Airbus. Since the market has been so characterized by the Boeing-Airbus duopoly, hardly any company has a similar size and business model. In addition, the only companies that could have served as comparables were Comac, Bombardier and United Aircraft Corporation. However, here revenues from aircraft sale were either still minor compared to the overall company size, or the company was not publicly listed hence had no comparable market information and values.
4 The fully elaborated WACC computation with all steps and assumptions is set out in Appendix 6.
Sum of parts EV after capitalized leases 62,798
[-] Net financial debt (6,369)
[-] Unfunded pension funds (6,567)
[+] Minority interests 8
Equity value Airbus Group 49,870
# shares outstanding 27-12-2016 772.71
Target share price 64.54
63,165 6.5% 7.0% 7.5% 8.0% 8.5%
1.5% 68,779 63,284 58,709 54,839 51,524 2.0% 75,155 68,557 63,165 58,674 54,876 2.5% 83,140 75,034 68,559 63,266 58,858
WACC Airbus CA
TV growth
63,165 5.5% 6.0% 6.5% 7.0% 7.5%
1.5% 65,986 64,330 63,044 62,017 61,176 2.0% 66,148 64,469 63,165 62,123 61,271 2.5% 66,310 64,607 63,285 62,229 61,366
WACC Airbus D&S/Helicopters
TV growth
21
Regarding the Defence & Space and Helicopters business it was, however, much easier to find international companies. Nonetheless, the suitability to compare to the D&S and Helicopters division of Airbus is limited due to its size within Airbus Group as well as the comparably low global market share (expect for the commercial Helicopter business, where Airbus Helicopters is market leader). Nonetheless, we retrieved and computed relevant data for a set of multiples to value the divisions.
Based on the 2016 revenues, which were derived from Q3 2016 financial reports and current trading information as of 27th December, we obtained a market derived valuation of the two
businesses. For the CA division, we recommend using the EV/EBITDA multiple range, as depreciation and amortization expenses are very different between companies and the EV/EBIT multiples show that Airbus is entirely outperformed, even by Boeing. Price-to-earnings is not adequate due to different leverage level. The range for the EV/EBITDA multiple-based EV is EUR 36.3bn to EUR 73.1bn for Airbus CA, providing an average EV of EUR 50.1bn (compared to an EV of EUR 52.5bn for Airbus CA and HQ with DCF valuation). However, the result might be distorted due to the high Zodiac Aerospace EV/EBITDA multiple.
For the valuation of the D&S unit and Airbus Helicopters, we will use the EV/EBIT, given that the financing structure and the business models are more comparable, and asset derived D&A play a smaller role. The average EV for the D&S/Helicopter multiple valuation range (EUR 19.1bn to EUR 9.2bn), is EUR 14.1bn, compared to EUR 10.7bn.
Based only on multiples averages the total EV of Airbus Group is EUR 64.3bn and the equity value is EUR 51.3bn, resulting in a target share price of EUR 66.39 (compared to EUR 65.01 in the DCF valuation).
2016 YTD multiples 2016 YTD multiples
Commercial Aerospace EV/Sales EV/EBITDA EV/EBIT P/E D&S / Helicopters EV/Sales EV/EBITDA EV/EBIT P/E Boeing Company 0.98x 13.89x 19.22x 23.40x Lockheed Martin 1.79x 13.23x 15.88x 18.63x
Embarer 0.68x 11.62x - 46.20x Textron 1.10x 9.42x 13.13x 16.87x
Zodiac Aerospace 1.53x 19.05x 29.55x 41.56x General Dynamics 1.42x 9.53x 10.61x 14.80x
Thales 1.23x 10.70x 15.05x 21.45x Rolls-Royce 1.01x 3.27x 7.64x 92.43x
Airbus 0.81x 11.52x 14.63x 18.62x Safran 1.07x 7.40x 11.94x
-Leonardo-Finmeccanico 1.61x 8.63x 11.39x 18.60x
Airbus 0.81x 11.52x 14.63x 18.62x
Max 1.53x 19.05x 29.55x 46.20x Max 1.79x 13.23x 15.88x 92.43x
Average 1.10x 13.82x 21.28x 33.15x Average 1.33x 8.58x 11.77x 32.27x
Median 1.10x 12.76x 19.22x 32.48x Median 1.26x 9.02x 11.67x 18.60x
Min 0.68x 10.70x 15.05x 21.45x Min 1.01x 3.27x 7.64x 14.80x
22
Financials
Income Statement division split
Income Statement in EUR mn 2012A 2013A 2014A 2015A 2016F 2017F 2018F 2019F 2020F
Revenues 56,480 57,567 60,713 64,450 65,682 69,662 73,968 78,423 83,167
YoY % growth 15.0% 1.9% 5.5% 6.2% 2.0% 6.1% 6.2% 6.0% 6.0%
Airbus Commercial Aerospace 36,999 38,561 41,531 45,090 47,345 50,659 54,205 57,999 62,059
% of revenues 65.5% 67.0% 68.4% 70.0% 72.1% 72.7% 73.3% 74.0% 74.6%
Airbus Helicopters 5,724 5,811 5,996 6,153 6,215 6,277 6,528 6,789 7,060
% of revenues 10.1% 10.1% 9.9% 9.5% 9.5% 9.0% 8.8% 8.7% 8.5%
Airbus Defence & Space 13,154 12,739 12,728 12,917 11,833 12,425 12,922 13,309 13,709
% of revenues 23.3% 22.1% 21.0% 20.0% 18.0% 17.8% 17.5% 17.0% 16.5%
Other / HQ / Consolidated 603 456 458 290 290 302 314 326 339
% of revenues 1.1% 0.8% 0.8% 0.4% 0.4% 0.4% 0.4% 0.4% 0.4%
Costs of Goods Sold (48,582) (49,613) (51,776) (55,599) (56,487) (59,700) (63,390) (67,209) (71,274)
% of revenues 86.0% 86.2% 85.3% 86.3% 86.0% 85.7% 85.7% 85.7% 85.7%
Airbus Commercial Aerospace (31,825) (33,233) (35,418) (38,898) (40,716) (43,414) (46,453) (49,705) (53,185)
Airbus Helicopters (4,924) (5,008) (5,113) (5,308) (5,344) (5,379) (5,594) (5,818) (6,051)
Airbus Defense & Space (11,315) (10,979) (10,854) (11,143) (10,176) (10,648) (11,074) (11,406) (11,748)
Other / HQ / Consolidated (519) (393) (391) (250) (249) (258) (269) (280) (291)
Gross Margin 7,898 7,954 8,937 8,851 9,195 9,962 10,577 11,215 11,893
% of revenues 14.0% 13.8% 14.7% 13.7% 14.0% 14.3% 14.3% 14.3% 14.3%
Operating expenses (6,029) (5,880) (5,992) (6,111) (6,203) (6,579) (6,985) (7,406) (7,854)
Operating expenses excl. R&D expenses (2,869) (2,762) (2,601) (2,651) (2,596) (2,753) (2,924) (3,100) (3,287)
Airbus Commercial Aerospace (1,879) (1,850) (1,779) (1,855) (1,871) (2,002) (2,142) (2,292) (2,453)
Airbus Helicopters (291) (279) (257) (253) (246) (248) (258) (268) (279)
Airbus Defense & Space (668) (611) (545) (531) (468) (491) (511) (526) (542)
Other / HQ / Consolidated (31) (22) (20) (12) (11) (12) (12) (13) (13)
Selling expenses (1,192) (1,140) (1,063) (1,065) (1,085) (1,151) (1,222) (1,296) (1,374)
% of revenues 2.1% 2.0% 1.8% 1.7% 1.7% 1.7% 1.7% 1.7% 1.7%
Administrative expenses (1,677) (1,622) (1,538) (1,586) (1,511) (1,602) (1,701) (1,804) (1,913)
% of revenues 3.0% 2.8% 2.5% 2.5% 2.3% 2.3% 2.3% 2.3% 2.3%
R&D expenses (3,160) (3,118) (3,391) (3,460) (3,607) (3,825) (4,062) (4,306) (4,567)
% of revenues 5.6% 5.4% 5.6% 5.4% 5.5% 5.5% 5.5% 5.5% 5.5%
Airbus Commercial Aerospace (2,438) (2,433) (2,667) (2,702) (2,813) (2,983) (3,167) (3,358) (3,561)
Airbus Helicopters (306) (306) (325) (325) (347) (368) (391) (414) (439)
Airbus Defense & Space (381) (344) (360) (344) (394) (418) (444) (470) (499)
Other / HQ / Consolidated (35) (35) (39) (89) (53) (57) (60) (64) (68)
Share invest. profits under equity method 241 434 840 1,016 633 633 633 633 633
Reported EBITDA 4,163 4,435 5,935 6,222 5,569 6,076 6,409 6,800 7,243
EBITDA margin 7.4% 7.7% 9.8% 9.7% 8.5% 8.7% 8.7% 8.7% 8.7%
One-off transactions 376 558 64 265 0 0 0 0 0
Normalized EBITDA 4,539 4,993 5,999 6,487 5,569 6,076 6,409 6,800 7,243
EBITDA margin adj. 8.0% 8.7% 9.9% 10.1% 8.5% 8.7% 8.7% 8.7% 8.7%
Depreciation 2,053 1,927 2,150 2,466 1,944 2,060 2,184 2,359 2,571
EBIT 2,486 3,066 3,849 4,021 3,625 4,016 4,225 4,441 4,672
% of revenues 4.4% 5.3% 6.3% 6.2% 5.5% 5.8% 5.7% 5.7% 5.6%
Airbus Commercial Aerospace 1,183 1,662 1,682 1,765 2,019 2,334 2,517 2,718 2,935
Airbus Helicopters 207 339 477 426 392 396 399 403 406
Airbus Defense & Space 879 808 1,516 1,193 808 881 906 920 932
Other / HQ / Consolidated 217 257 174 638 406 405 403 400 398
Interest income 237 161 142 183 142 107 107 107 107
Interest expense (522) (493) (462) (551) (684) (848) (848) (848) (848)
Other financial result (168) (278) (458) (319) (306) (306) (306) (306) (306)
EBT 2,033 2,456 3,071 3,334 2,778 2,968 3,177 3,394 3,624
Income taxes (438) (477) (863) (800) (667) (712) (763) (814) (870)
Net income 1,595 1,979 2,208 2,534 2,111 2,256 2,415 2,579 2,754
Equity owners of the parent 1,197 1,473 2,343 2,696 2,113 2,258 2,417 2,581 2,756
Non-controlling interests 1 10 7 2 2 2 2 2 2
Effective tax rate 21.5% 19.4% 28.1% 24.0% 24.0% 24.0% 24.0% 24.0% 24.0%
Dividend (369) (467) (587) (945) (584) (624) (668) (713) (762)
Payout Ratio 23.1% 23.6% 26.6% 37.3% 27.7% 27.7% 27.7% 27.7% 27.7%
Dividend income from investments 6 49 55 54
Other non-operating income income 184 272 330 474
Other expenses (229) (259) (179) (222)