*Correspondence: M. A. Oliveira. Centro Universitário Norte do Espírito Santo. Universidade Federal Espirito Santo. Rodovia BR 101 Norte, km 60, 29932-540 - São Mateus - ES, Brasil. E-mail: oliveirama.ufes@gmail.com
Chemical degradation kinetics of fibrates: bezafibrate, ciprofibrate
and fenofibrate
Marcelo Antonio de Oliveira
*, Gerliane Damázio da Silva, Michele Soares Tacchi Campos
North University Center of Espirito Santo, Federal University of Espirito Santo, São Mateus, ES, Brazil
Fibrates are drugs used for the treatment of hypertriglyceridemia and for the prevention of atherosclerosis. Three drugs in the ibrate class, ciproibrate, fenoibrate and bezaibrate, were chosen for this study because their raw materials are readily available and because scientiic publications on these compounds is limited. To evaluate their intrinsic stability, the drugs were exposed to a test condition (temperature, oxidation, UV light exposure, hydrolysis at diferent pH values and metal ions in solution) and then were subjected to analysis by HPLC. The samples were run on a C18 column, with a low rate of 1.0 mL min-1 in amobile phase consisting of methanol: 0.01 % phosphoric acid v/v (80:20), with variable detection wavelengths in the UV spectra. The analysis methodology showed satisfactory performance parameters. The three drugs were very unstable, degrading in each of the conditions evaluated. The test conditions of acid and basic hydrolysis showed the most signiicant degradation. The results demonstrated that the drugs in this class are unstable. Based on these experimentally determined degradation kinetics, it is easy to understand and emphasize the importance of the lack of liquid dosage forms on the market for ibrates because of their instability.
Uniterms: Hypertriglyceridemia/ibrates. Fibrates stability/study. Fibrates degradation products/High Perfomance Liquid Chromatography (HPLC). Fibrates/Degradation kinetics.
INTRODUCTION
F i b r a t e s a r e d r u g s u s e d f o r t h e t r e a t m e n t of hypertriglyceridemia and for the prevention of
atherosclerosis, and are represented by the following compounds: clorfibrate, ciprofibrate, bezafibrate, fenofibrate and geozila. Fibrates decrease triglyceride levels and increase HDL-C levels, the latter effect is more pronounced in patients with hypertriglyceridemia. The effect on LDL-C levels varies. They may reduce LDL-C levels in patients with low triglycerides, but may paradoxically increase levels for patients with high triglyceride levels. Fibrates also signiicantly reduce the
levels of highly atherogenic remnant lipoproteins, and
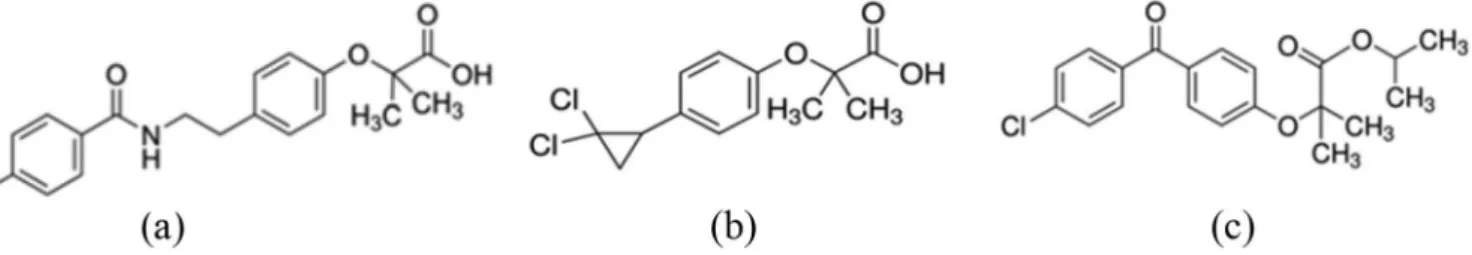
are more eicient than statins in doing so (Schulz, 2006). Among the ibrates, three drugs were chosen for the execution of this project: ciproibrate, fenoibrate and bezaibrate (Figure 1). The drugs were chosen based on the availability of raw materials and evidence of few
scientiic publications regarding the drugs on the subject
of research.
Some analytical methods have been developed for
the analysis of ciproibrate, fenoibrate and bezaibrate by HPLC/UV (Nascimento et al., 2011; Salama et al., 2011; Jain et al., 2012; Kumbhar et al., 2013; Wei et al., 2008). The vast majority of these analytical methodologies used
reverse phase columns, mainly octadecyl silane, with a controlled acidic pH solution for the mobile phase and
detection in the ultraviolet range.
Few articles have been published on the stability of the chosen fibrates (Salama et al., 2011; Jain et al., 2012; Kumbhar et al., 2013), and none were found that
identiied degradation products, the hypothesized route
of degradation, or studied the degradation kinetics of
these drugs. Excipients are chosen for pharmaceutical
formulations based on the stability data, for the purpose of obtaining a more stable formulation. It is noted that
fenoibrate is an ester and bezaibrate is an amide, which
makes them very susceptible to hydrolysis reactions.
change in the quality of a class II drug caused by stability problems directly inluences the bioavailability of the drug (Yoshida et al., 2010, 2011).
The HPLC analytical methodology must be optimized for the determination of the parent drug as well as possible degradation products obtained under
conditions of intrinsic stability testing. Chromatographic performance parameters should be evaluated after
technical optimization, such as the retention factor (k’), number of theoretical plates/column (N), resolution (Rs) and tail factor or asymmetry (T) (ANVISA, 2010).
In developing a pharmaceutical formulation, it is important to determine the intrinsic stability of the drug to predict possible reactions and degradation products
(Silva et al., 2009). The stability of the substance should be evaluated for a number of stressors including
temperature changes, oxidation, UV light exposure and hydrolysis at diferent pH values. The photostability can be evaluated by subjecting the compound to UV irradiation. Some degradation pathways can be complex. Not all
decomposition products formed under the more drastic conditions of intrinsic stability are seen in drugs subjected
to the oicial conditions of stability studies (USP, 2014;
Silva et al., 2009; ANVISA, 2005).
In accordance with the regulations, it is important to exhaust the possibilities of all drug reactions that have not been explored fully (Silva et al., 2009; USP,
2014; ANVISA, 2005). It is also important to propose
degradation mechanisms, study the kinetics of the reactions, and evaluate the pharmaceutical formulation
and compare it with the choice of excipients used.
To research the degradation products, drugs are subjected to drastic conditions including neutral, acid or
basic hydrolysis, oxidation with peroxide, exposure to UV light, degradation with metal ions (FeSO4) and heat
(ANVISA, 2005, 2013). The analysis must be performed by HPLC and probabilistic mechanisms of possible
degradation reactions should be proposed.
Kumbhar et al. (2013) reports that fenofibrate undergoes rapid degradation through acid and basic
hydrolysis, and under hydrogen peroxide-mediated oxidation. Jain et al. (2012) reports that ciproibrate is
unstable to acid hydrolysis, basic hydrolysis and under
oxidation.
Degradation kinetics are also used to assess the stability of drug is where the extent of degradation, t90 (time
to degrade 10% of the drug), degradation rate, easiness of degradation (which is related to the Energy Activation of the reaction), and it becomes interesting in comparison of
stress conditions establishing a proportionality logic and for chemical reactions. Thus, intrinsic stability and kinetic studies are key components in the discovery of potential drug degradation products, even though these products may not occur under normal medication storage conditions
(Yoshida et al., 2010, 2011).
After deining the conditions under which the drugs degrade, we conducted a study that included different
collection times in order to determine the progression of the degradation reactions. Then chemical and mathematical
studies were conducted to determine the activation energy (Ea), pre-exponential factor, rate of reaction (k) and inally,
estimates for the time required to degrade 10% of the drug (t90) in a speciic condition, usually at 298 K, which is the
standard storage temperature for pharmaceutical products. The t90 is often interpreted as the shelf-life of a drug. This
is calculated through an extrapolation of the Arrhenius equation, and the value determines the drug lifetime at 298 K (Cides et al., 2006; Yoshida et al., 2010, 2011).
The following equations can be used to describe the
observed kinetics of degradation in solution:
Arrhenius equation (1):
(1)
where: k = rate constant, Ea = activation energy, A =
pre-ORDER
ZERO FIRST SECOND
C = -kT + Co
t90 = (0.1 x Co)/k
log C = -kT / 2.303 + log Co
t90 = 0.105 / k
1/C = kT + 1/Co
t90 = 1 / (9 x k x Co)
C = concentration (%); k = rate constant (s- 1); C
o = initial
concentration; t = time (s).
exponential factor, T = temperature in Kelvin, R = gas constant (8.314 J mol-1 K-1).
The aim of this paper was to develop and optimize an analytical HPLC method for determination of ibrates
and possible degradation products, to evaluate the intrinsic stability of these drugs under stress conditions, and to study the kinetics of degradation of these drugs that are so susceptible to chemical reactions.
MATERIAL AND METHODS
Development and optimization of an analytical methodology for HPLC determination
Analyses were carried out using a HPLC (Waters®) equipped with a UV/DAD detector, autoinjector, and oven. The separation methodology was based on reverse phase chromatography, using an octadecyl silane column (RP-18) with a length of 30 cm to facilitate the separation of possible degradation products, and an UV/DAD detector
to facilitate the identity of the degradation products, and reveal possible co-elutions.
Performance Parameters
The performance parameters (system suitability) were calculated according to formulas described by the Brazilian Pharmacopoeia (Brazil, 2010) for the retention factor (k’), peak asymmetry (As), number of theoretical
plates (N) and resolution (Rs).
Evaluation of intrinsic stability
The initial conditions used to evaluate the intrinsic
stability of bezaibrate, ciproibrate and fenoibrate were: • Dry heat: 20 mg of each drug was dissolved in metha -nol and subjected to dry heat in an oven at 323 K for 4
hours. After this procedure, the samples were diluted in methanol to a concentration of 0.01 mg mL-1.
• Neutral hydrolysis: 20 mg of each drug was dis
-solved in methanol. 20 mL of water was added and the solution was incubated in a water bath at
323 K for 4 hours. After this procedure, the samples
were diluted in methanol to a concentration of 0.01 mg mL-1.
• Alkaline hydrolysis: 20 mg of each drug was dis
-solved in methanol. 20 mL of 0.1 M NaOH was added and the solution was incubated in a water
bath at 323 K for 4 hours. After this procedure, the
samples were diluted in methanol to a concentration of 0.01 mg mL-1.
• Acid hydrolysis: 20 mg of each drug was dissolved in methanol. 20 mL of 0.1 M HCl was added and the solution was incubated in a water bath at 323 K for 4 hours. After this procedure, the samples were diluted in methanol to a concentration of 0.01 mg mL-1.
• Oxidation: 20 mg of each drug was dissolved in
methanol. 20 mL of 3% hydrogen peroxide (v/v) was added and the solution was incubated in a water
bath at 323 K for 4 hours. After this procedure, the
samples were diluted in methanol to a concentration of 0.01 mg mL-1.
• Exposure to ultraviolet light: 20 mg of each drug was dissolved in methanol and placed in an UV radiation
chamber under a 254 nm lamp for 4 hours. After this
procedure, the samples were diluted in methanol to a concentration of 0.01 mg mL-1.
• Solution with metal ions (FeSO4): 20 mg of each
drug was dissolved in methanol. 20 mL of a 0.05 M
FeSO4 solution was added and the resulting solution
was incubated in the water bath at 323 K for 4 hours. After this procedure, the samples were diluted in methanol to a drug concentration of 0.01 mg mL-1.
After being exposed to the stress conditions and being diluted as described above, the samples were analyzed by HPLC.
Degradation kinetics studies
After the degradation studies, drugs were subjected
to acid or base hydrolysis at 323, 333, 343 or 353 K,
conditions under which the drugs underwent further degradation. Samples were collected after 4, 5, 6 and 7 hours. The order of the degradation reactions was established according to the models of zero, first and
second order kinetics.
Once each result was set to the best it model (zero, first or second order), it was possible to calculate the degradation rate (k) for each temperature with the aid of
the linear correlation coeicient (r).
Once the degradation rates (k) were calculated at
each temperature, it became possible to determine, with the help of the Arrhenius equation, k at 298 K and thus
indicate how long the drug takes to degrade 10% (t90). This
is one way to determine the expiration date of a drug or
medicament, also called t90, or shelf-life.
RESULTS AND DISCUSSION
and 0.01% phosphoric acid (80:20% v/v); octadecyl silane column (250 x 4.6 mm; 5 µm); wavelengths for bezaibrate (254 nm), ciproibrate (236 nm), fenoibrate (290 nm); low rate of 1.0 ml min-1; temperature 303 K;
injection volume of 20 µL, and 20 minutes analysis of
analysis.
After the HPLC analysis method was optimized, the performance parameters were determined for each compound: bezaibrate (k’ = 0.67; As = 1.41, N = 4299 plates/column), ciproibrate (k’ = 1.09; As = 1.35, N = 6052 plates/column; Rs = 3.95) and fenoibrate (k’ = 3.51; As = 1.07, N = 13.258 plates/column; Rs = 17.77). These performance parameters were shown to be satisfactory according to the limits set for each parameter, which were k’ (retention factor) > 0.5, N (theoretical plates) > 2.000, T (tailing factor) ≤ 2, and Rs (resolution) > 2 (Ribani et al., 2004).
Under these conditions, the retention times difered for each of the compounds and were 4.31 min for bezafibrate, 5.4 min for ciprofibrate and 11.6 min for fenofibrate. The three drugs were shown to be very
unstable and degraded in all the conditions used in the
intrinsic stability studies. The most signiicant reduction in peak area after submission to stress conditions was due
to acid and basic hydrolysis. In light of these results for
intrinsic stability, the degradation kinetics were evaluated
under the acid and basic hydrolysis conditions, initially at temperatures of 323 K, 333 K, 343 K and 353 K.
For bezafibrate and ciprofibrate, kinetic studies
of drug degradation during acid and basic hydrolysis
showed no proportional relationship between time and temperature, and the degradation studies were not reproducible. These results demonstrate the diiculty
in deciphering the intermediate products of degradation
kinetics, and such degradation was impossible to be it to kinetic models. Previous studies of degradation under thermal analysis by TG (thermogravimetry) also were not reproducible for the experimentally determined dynamic
TG or the isothermal TG. This lack of reproducibility
of results when submitting bezaibrate and ciproibrate to stress conditions indicates a complexity in both
degradation processes.
There are no reports in the literature of possible
mechanisms of degradation to bezafibrate and ciproibrate. According to the molecular structures of each drug, it is possible to understand the complexity of these degradations. For bezaibrate, possible reactions
under stress conditions could happen, such as: the
ether group can sufer breaks in the chain when under
acid hydrolysis; the aromatic halide group can undergo
hydroxylation forming a phenol; and amide group can
undergo hydrolysis, which is favored at basic or acid medium, resulting in alcohol and carboxylic acid. For
ciprofibrate, under stress conditions, the ether group
may rupture in the chain when under acid hydrolysis; the
halide group can be converted into the alkene under basic
hydrolysis, where it has a heated alcoholic solution and an inorganic base; and halide group, which is cyclic, may
undergo elimination under basic hydrolysis obtaining an alicyclic hydrocarbon.
For fenofibrate, the kinetic degradation studies
showed a signiicant decrease in peak area after acid and basic hydrolysis. Similar to the results for bezaibrate
and ciprofibrate, under acid hydrolysis conditions
no reproducible results were observed, and so it was
not possible to make mathematical adjustments. This
diiculty of adjusting the kinetic data in acid hydrolysis
could be related to possible reactions that can happen,
such as: the ketone group can react reversibly with the methanol used when under acid hydrolysis, forming “acetals”; the ether group can sufer breaks in the chain when under acid hydrolysis; the ester group can undergo hydrolysis, which may be favored in acid medium, resulting in an alcohol and a carboxylic acid; and even the aromatic halide group can undergo hydroxylation
forming a phenol.
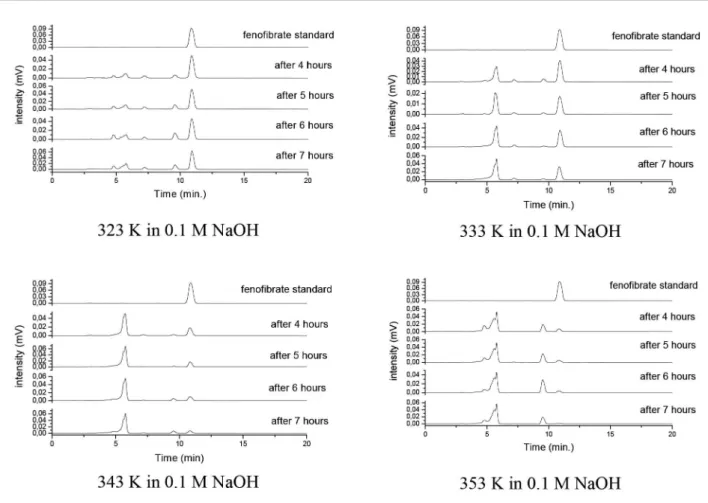
For fenoibrate, after basic hydrolysis, the results it the model well and were reproducible. Figure 2 shows
the chromatograms of fenofibrate kinetic studies after
basic hydrolysis at diferent temperatures and exposure times. The possible mechanism of fenoibrate degradation
reaction seems to be related to the characteristic reaction grouping ester hydrolysis. This mechanism has been described by Kumbhar et al. (2013) and Salama et al.
(2011), and in view of the mathematical adjustment
degradation models, this mechanism seems to be the only form of drug degradation in this stress condition.
The values related to the fit of the fenofibrate
kinetic degradation data to the zero, irst and second order
mathematical models at 323, 333, 343 and 353 K are described in Table I.
Analysis of the calculated linear regression
coeicient (r), suggested that the degradation kinetics of fenoibrate versus temperature are best described as a irst
order reaction, so the reaction rate depends on a single
factor, which can be a reactant or product involved in the reaction (Brown et al., 2005).
After the reaction order was determined, the degradation rate constants were calculated for each
temperature: k 323K = 0.148797926, k 333K = 0.181610946,
k 343K = 0.381299703, and k 353K = 0.591997704. However,
0.031406672. Thus, t90 was 3.34 hours. This means that after 3.34 hours in 0.1 M NaOH, or equivalent pH, the
drug has degraded 10%.
Figure 3 shows the plot of Arrhenius equation log k x 1/T function. The slope of the line is deined by the equation Ea (2,303 × R)
-1, before it was possible to
calculate the activation energy, so being Ea = 455.14 J mol-1
for the reaction of fenoibrate degradation.
For ciprofibrate, after evaluations of possible
degradation products (DP) formed in the reaction, it was possible to study the kinetics of formation of these degradation products formed upon exposure to
acid hydrolysis. Thus, the kinetic studies indicated a
mathematical fit on the kinetics of formation of a DP (retention time = 6.61 min) of ciproibrate in acid medium. Figure 4 shows chromatograms of ciprofibrate kinetic
study in acid hydrolysis, noting that the kinetic studies
were performed for the degradation product formed in
6.61 min.
The values reported in Table II show the mathematical its of the zero, irst and second order models of a ciproibrate degradation product at temperatures of
323 K, 333 K, 343 K and 353 K. It can be observed from
Table II that the best fit is the first order model, where the correlation coeicient was the closest to 1.000, thus deining the order of the reaction. The rate constants were
calculated for each temperature: k 323 K = 68644.24, k 333 K = 104592.10, k 343 K = 137831.45 and k 353 K = 235535.56.
Using the Arrhenius Equation graphical method (Figure 6) it was possible to calculate k at 298 K, which was
20812.63. The Arrhenius equation was used to determine the activation energy (Ea), Ea = 370.88 J mol-1 to form of
the degradation product of ciproibrate.
CONCLUSIONS
The HPLC analysis method was optimized by
introducing appropriate performance parameters for the three drugs.
The three drugs have proved extremely unstable in liquid media, undergoing reactions in each of the tested stress conditions. The most significant instability was
related to acid and basic hydrolysis.
It was not possible to study the kinetics of bezaibrate
and ciprofibrate degradation since the degradation of
these drugs exhibits no proportionality between time FIGURE 2 - Chromatograms of the fenoibrate solution before (standard) and after 4, 5, 6 or 7 hours of basic hydrolysis at 323,
and temperature, and therefore could not be it to kinetic models. However, it was possible to study the kinetics of the formation of a ciproibrate degradation product with
an Ea of 370.88 J mol-1.
In the evaluation of fenofibrate basic hydrolysis
degradation kinetics, the reaction was shown to be irst order with a t90 value of 3.34 hours. These analyses
demonstrate the instability of the drug when exposed to 0.1 M NaOH or an equivalent pH.
The absence of liquid dosage forms for fibrates
on the market can be understood given the instability of
the drugs as we have shown by degradation and kinetic
studies.
ACKNOWLEDGMENTS
Financial support for this research was provided by FAPES (Foundation for supporting research of the Espirito Santo) and CNPq (National Counsel of Technological and Scientiic Development).
TABLE I - Kinetic data for the degradation of fenoibrate under basic hydrolysis at 323, 333, 343 and 353 K
Temperature (K) Parameter Order
Zero First Second
323
a
b
r
-10.12976
96.91408 -0.97008
-0.06461
1.98355 -0.97819
0.00231
0.010441
0.98616
333
a
b
r
-10.45412
94.03265
-0.95643
-0.07886
1.96967
-0.97922
0.00357
0.01052
0.99558
343
a
b
r
-13.86424 90.43891
-0.94528
-0.16557
1.96678
-0.99370
0.01754
0.00065
0.95795
353
a
b
r
-14.74440
88.03679
-0.92663
-0.25706
1.95949
-0.99007
0.08259 -0.08093
0.80273
The data were best it to a line of type Y = a X + b, where a is the slope, b is the y-intercept and r is the linear regression coeicient.
FIGURE 4 - Chromatograms of the ciproibrate solution before (standard) and after 4, 5, 6 or 7 hours under acid hydrolysis at
temperatures of 323, 333, 343 and 353 K.
TABLE II - Kinetic data for ciproibrate degradation under acid hydrolysis at 323, 333, 343 or 353 K
Temperature (K) Parameter Order
Zero First Second
323 a
b r
29806.44521 -3554.958904
0.97959
0.10016
4.63585
0.92342
-1.63613E-06 1.57726E-05
-0.91602
333 a
b r
45415.58904 9593.80822
0.99340
0.05794
5.09438
0.99350
-5.17395E-07 6.75259E-06
-0.99265
343 a
b r
59848.65385
41.63462 1.00000
0.07978
5.06706 0.99744
-5.78635E-07 6.38697E-06
-0.98889
353 a
b r
102273.363 30729.60274
0.98866
0.04994 5.50056 0.99517
-1.95E-07 2.76459E-06
-0.99032
FIGURE 5 - Graph of the Arrhenius equation extrapolated to 298 K for a ciproibrate degradation product. The arrow identiies k298 K.
REFERENCES
BENET, L.Z. Can the BCS be modified to expand the inclusion of drugs in class 1 based on transporter-enzyme
interplay. In: AAPS Annual Meeting, 2006, San Antonio.
San Antonio: University of California, 2006. Available
at: <www.aapspharmaceutica.com/meetings/files/103/ LesBenetChallengesRoundtableinBCS.pdf>. Accessed on:
20 Jun 2015.
AGÊNCIA NACIONAL DE VIGILÂNCIA SANITÁRIA. ANVISA. Resolução RE nº 1, 29 de julho de 2005. Publicação do Guia para a Realização de Estudos de
Estabilidade. Diário Oicial da União, Poder Executivo,
Brasília, DF, 1 Agosto 2005.
AGÊNCIA NACIONAL DE VIGILÂNCIA SANITÁRIA. ANVISA. Resolução RDC nº 49, de 23 de novembro de 2010. Aprova a 5ª edição da Farmacopéia Brasileira. Diário Oicial da União, Poder Executivo, Brasília, DF, 24
Novembro 2010.
AGÊNCIA NACIONAL DE VIGILÂNCIA SANITÁRIA. ANVISA. Resolução RDC nº 58, 20 de dezembro de 2013. Estabelece parâmetros para a notiicação, identiicação e qualiicação de produtos de degradação em medicamentos com substâncias ativas sintéticas e semissintéticas, classiicados como novos, genéricos e similares, e dá outras
providências. Diário Oicial da União, Poder Executivo,
Brasília, DF, 23 Dezembro 2013.
BROWN, T.L.; JUNIOR, H.E.L.; BURSTEN, B.E.; BURDGE,
J.R. Chemistry central science.9. ed. São Paulo: Pearson
Prentice Hall, 2005.
CIDES, L.C.S.; ARAÚJO, A.A.S.; SANTOS-FILHO, M.;
MATOS, J.R. Thermal behaviour, compatibility study and decomposition kinetics of glimepiride under isothermal and non-isothermal conditions. J. Therm. Anal. Calorim., v.84,
n.2, p.441-445, 2006.
JAIN, P.S.; JIVANI, H.N.; KHATAL, R.N.; SURANA, S.J. Stability-indicating HPLC determination of ciproibrate
in bulk drug and pharmaceutical dosage form. Chem. Ind.
Chem. Eng. Quart., v.18, n.1, p.95-101, 2012.
KUMBHAR, S.T.; LONI, A.B.; KOTHALI, V. Development and validation of stability indicating LC method for the estimation of fenoibrate. W. J. Pharm. Pharmac. Sci., v.2,
n.5, p.4061-4078, 2013.
MCMURRY, J. Organic Chemistry. 9. ed. USA: Cengage
Learning, 2015.
NASCIMENTO, G.N.L.; ROSA, D.L.; NISHIJO, H.; AVERSI-FERREIRA, T.A. Validation of a spectrophotometric method to determine ciproibrate content in tablets. Braz.
J. Pharm. Sci., v.47, n.1, p.23-29, 2011.
RIBANI, M.; BOTTOLI, C.B.G.; COLLINS, C.H.; JARDIM,I. C.S.F.; MELO, L.F.C. Validation of chromatographic
methods and electrophoretic. Quím. Nov., v.27, n.5,
SALAMA, F.M.M.; NASSAR, M.W.I.; SHARAF EL-DIN, M.M.K.; ATTIA, K.A.M.; KADDAH, M.Y. Detemination of fenoibrate and the degradation product using simultaneous UV-derivate spectrometric method and HPLC. Am. J. Anal. Chem., v.2, p.332-343, 2011.
SCHULZ, I. Treatment of dyslipidemia: how and when to combine lipid lowering drugs. Arq. Bras. Endoc. Metab., v.50, n.2, p.344-359, 2006.
SILVA, K.E.R.; ALVES, L.D.S.; SOARES, M.F.R.; PASSOS, R.C.S.; FARIA, A.R.; ROLIM NETO, P.J. Models for
assessing the stability of drugs and medicines for the pharmaceutical industry. J. Bas. Appl. Sci., v.30, n.2,
p.1-8, 2009.
THE UNITED STATES PHARMACOPOEIA. USP. 37. ed. Rockville: United States Pharmacopeial Convention, 2014.
WEI, Z.; BING-REN, X.; YING, Z.; LIYAN, Y.; TENG, W.; CAI-YUN, W. HPLC method for the determination of bezafibrate in human plasma and application to a pharmacokinetic study of bezaibrate dispersible tablet. J.
Chromatogr. Sci., v.46, n.10, p.844-847, 2008.
YOSHIDA, M.I.; LIMA GOMES, E.L.; VIANNA-SOARES, C.D.; CUNHA, A.F.; OLIVEIRA, M.A. Thermal analysis applied to verapamil hydrochloride characterization in
pharmaceutical formulations. Molecules, v.15,
p.2439-2452, 2010.
YOSHIDA, M.I.; LIMA GOMES, E.L.; VIANNA-SOARES, C.D.; OLIVEIRA, M.A. Thermal behavior study and
decomposition kinetics of amiodarone hydrochloride under isothermal conditions. Drug Dev. Ind. Pharm., early online edition, p.1-10, 2011.
Received for publication on 19th October 2015