Political Preferences and Individual
Choice: A Latin American’s Countries
Perspective
Regina Carla Madalozzo and Afonso Mariutti Chebib
Abstract
Analyzing the “left” and “right” political positions of individuals is challenging because personal attributes may influence political de-cisions without directly causing them. This issue may be even more pronounced in Latin America, where young democracies encoun-ter the challenge of stabilizing political choices over time. This study contributes to the liencoun-terature by analyzing the influence of personal attributes on political choices, focusing on the early 2000s, when the “left” turn occurred. The present study relies on the World Values Survey’s fifth wave (2005-2008) to fulfil this objective. This dataset is composed of data that have been collected glob-ally, and the questions are related to diverse subjects associated with the quality of life of individuals. From the available sample, we included all of the Latin American countries that participated in this wave: Argentina, Brazil, Chile, Colombia, Mexico, Peru, and Uru-guay. In this study, the aim is to directly understand the impact of these individuals own attributes on their declared self-positioning about the political leaning. To this aim, an ordered logit model was used to analyse how each variable exerts influence on the political leaning of the respondents. Our results found that political cleavages depend on demographic factors, economic factors, and individ-ual opinions in agreement with previous studies. Increased age, religious service attendance, and satisfaction with one’s financial life increase the tendency of individuals for self-positioning to the right of the political spectrum. The possession of a university degree and residence in a large city increases the likelihood of individuals of self-identifying with a leftist political position. This study contributes to the literature by analysing the influence of personal attributes on political choices. Although this research represents an important step toward understanding political leanings in Latin American countries, a significant amount of future research remains. The defini-tions of “left” and “right” continue to be unclear as they relate to dimensions that include democracy, autocracy, and political reform. Understanding the ways individuals set up their choices would increase the responsibility of political parties and authorities for the hidden claim the population has about their deliverables. At the same time, studies like ours may enhance the awareness of the gen-eral impression over political party choices of candidates. Finally, even with so many confounding aspects in this antagonist position, the left and the right continue to be a simple way to characterize veiled assumptions. Therefore, it may be an ambiguous form of defin-ing choices, but this seemdefin-ingly binary choice is still very significant for voters in Latin America.
Keywords: political preferences; Latin American voters; political leanings; individual attributes; World Values Survey.
Recebido em 7 de Março de 2016. Aceito em 9 de Julho de 2016.
I. Introduction1
I
ndividual decisions regarding left and right political positions may convey less information regarding individual preferences than one might assume. Even as political parties attempt to use the symbolism of this personal choice to capture the attention of voters and earn their confidence in party plat-forms to ensure that voters are well represented by their elected candidates, studies have found that individuals have a distinct understanding of left and right positions that vary across countries and regions and even over time (Colomer & Escatel 2000; Zechmeister 2006; Corbetta, Cavazza & Roccato 2009) and anecdotal evidence shows that people may identify themselves with on political leaning and, even so, vote for parties belonging to the other extreme of political orientation . This problem may be even more pronounced in Latin America, where young democracies encounter the challenge of stabilizing po-litical platforms over time. The popo-litical positions of parties and voters areim-DOI 10.1590/1678-987317256301
Artigo Rev. Sociol. Polit., v. 25, n. 63, p. 3-25, set. 2017
1We thank the anonymous
portant in this context because they indicate the support of the population for various actions. For instance, Blofield and Luna (2011) indicate that although Latin American citizens are polarized in the subject of income redistribution, their positions on this matter are not significantly correlated with their left or right political leanings. As Dalton, Farrell and McAllister (2011, p.84) say “[...] [the left-right scale] provides a general reference framework so people can dis-cuss the broad course of government without being knowledgeable on each spe-cific issue”.
However, with the several left turns observed since the end of the last cen-tury in Latin America (Selligson 2007; Cameron & Hershberg 2010; Murillo, Oliveros & Vaishnav 2010), it appears to be the case that the labels “left” and “right” continue to play a great role in the political sphere. Independently and not reaching any conclusion about the existence of different lefts in Latin Amer-ica (Cameron 2009; Castañeda 2006), the present study contributes mainly to empirically investigate how individual attributes can and will influence the left and right political positions of voters.
Several previous studies aimed to understand how personal attributes and individual opinions about the ideal system of governance of a country would impact on their choices of left and right political leanings. Instead of using opin-ions about an ideal system of public governance, we follow two main studies, the works of Jou (2010) and Moreno (1999), to analyze the factors that influ-ence the political orientation of voters in seven Latin American countries (Ar-gentina, Brazil, Chile, Colombia, Mexico, Peru, and Uruguay). Jou (2010) has a similar study to ours in the sense that it concentrates on individual traits to make inferences on political leanings. However, it is very distinct in that it uses a Ser-bian database. Identity and the pure concept of left and right are very different for Serbian citizens and Latin American ones (Foweraker, Landman & Harvey 2003). Puntigliano (2008) points to the fact that the dichotomy between the con-cepts of left and right in Latin America still suffers from the construct posed during the Cold War, when “right” would be considered a pro-systemic choice and “left” would be the alternative to that. Even with this great difference be-tween the samples, Jou (2010) is an important reference to this study in the main concepts to the individual preference set up.
On the opposite side, we have Moreno (1999), who studies the same popula-tion we do: Latin American citizens. However, this sample belonged to the first three waves of the World Values Survey, whereas we use the 5th wave of the World Values Survey. It is important not only to revise the previous findings – because Latin America’s political outcomes have changed significantly since the early 2000s – but also to understand how individuals were choosing their political leaning while they were electing more pro-left presidents – the so-called “Left Turn”. By the beginning of the 2000s, the recent rightist dictator-ships in the majority of our sample countries had ended, and, after that, a signifi-cant portion of the elected presidents in Latin America belonged to leftist parties. When the World Values Survey’s fifth-wave data were collected in 2005, Argentina, Brazil, Chile, and Uruguay had presidents from the left or cen-tre-left, and the majority of the elections that occurred during the following years gave victories to left-wing candidates in these countries. These political outcomes indicate the preferences of voters for a variety of subjects, from abor-tion to economic policy. Understanding the political definiabor-tions of “left” and “right” and the conditions that influence the political positions of individuals is important to understand both electoral outcomes and the attempts of parties to engage new voters (Hunter 2010).
rela-tion of these political leanings in a period where the majority of countries were at the “left turn” in their main elections.
This study is organized as follows: the next section presents the theoretical basis to understand political preferences and the current meaning of political positioning in Latin America. Section 3 shows the dataset and an initial data analysis for the seven Latin American countries. Section 4 presents the results and compares them with the findings of Moreno (1999) and Jou (2010). The fi-nal section offers conclusions and suggestions for further research.
II. Political preferences and individual positioning
How do individuals choose what they will have, what they will buy, whom they will support? That is one of the greatest questions for social science re-searchers. Among economists, a choice is one of the main aspects that define not only what the individual chooses to consume but also the implications of this choice to the supply and demand equilibrium (Samuelson 1972). All the neoclassical approaches to economics are based on assumptions about an indi-vidual’s preference and the main critiques of these methodological approaches are also concerned with preferences and how to deal with them. Among politi-cal science researchers, the conception of preference formation is no less debat-able. However, some common grounds may be the beginning of the clear definition of how individuals form and maintain (opposed to modifying) their choices and preferences. Druckman and Lupia (2000) draw a very interesting review of the literature on the subject and we use their conclusions to draw the inferences about the individual political choice in this study.
First, it is important to notice that preferences are developed over time and are influenced by personal experiences. Concerning the political leaning, the personal identification with right or left wing entangles some concepts that are not totally reachable within tangible arguments. This means that part of the preference formation is intrinsic to the individual’s social environment or past experiences that people themselves cannot always classify as important to their political leanings. With this in mind, our empirical approach has to include indi-vidual attributes that catch up unobservable measures of the indiindi-vidual experi-ences (such as education background and social class).
Second, information is an important and very relevant part of preference for-mation. Individuals are able to classify and choose among alternatives if they are capable of distinguishing the attributes of the goods being evaluated. In the subject of political choice, declaring predilection to left wing over the right wing (or the reverse) requires information about what each concept stands for. Therefore, bad information flow may lead individuals to choose their political positioning without grounding it in the actual attributes of this choice. Unfortu-nately, this problem will not be completely solved in our empirical approach. The matter of information is unobserved in our sample and, concerning political inclinations, we do not have information regarding individual search or success rate of the understanding of these concepts. As argued by Wisehomeier and Doyle (2012), the common understanding of left and right political choices de-pends on the circumstances and the context in which individuals are, and it is permeated by the information reached by these individuals.
that leads to the declaration of preference over left or right is less important than to understand what generally is understood by left or right in Latin America.
Ames and Smith (2010) report the difficulty Brazilian citizens have to ex-plain what left and right political choices actually are. They attribute this diffi-culty to the multi-party system as well the low polarization among elite-level. Foweraker, Landman and Harvey (2003) understand that Latin American resi-dents departed from different points of understanding of what left and right wing used to mean – grounded in the concept of multiple left, as in Cameron (2009) or Castañeda (2006) – but they were squeezed, especially the concept of left, to fit the popular demand of a more stable political environment: “[...] the left of the political spectrum in Latin America has been squeezed. The parties of the right, in contrast, have only had to move a small way towards the centre, as well as modifying both language and style.” (Foweraker, Landman and Harvey 2003, p.104).
This compression of political leanings – by “squeezing” the left and bring-ing the right to the center – allows to treat the concepts of left and right as under-standable to Latin Americans in the sense that left would mean more protection to individuals against variations in the market, allowing better conditions to reach equality of social and economic conditions (Murillo, Oliveros & Vaishnav 2010). Right, by the opposition, would value the concept of market and endure its consequences – Bowen (2011) draws an interesting description and points to the contradictions among right wing supporters in Latin America.
Another topic that should be taken into account is the mistrust on politics that Latin Americans report. This is not an exclusive problem of Latin America, even more, developed democracies suffer from this condition. Power and Jamison (2005) point that the differences are that Latin American’s democra-cies are still very young and the low trust on politics is based on a general mis-trust: mistrust of others, of institutions, of economic conditions, among others. And, by their view, mistrust, in this case, is not caused by historical conditions, but it is the consequence of several and recent years of “[...] low economic growth, corruption and instrumental behaviour of political elite.” (Power & Jamison 2005, p.66). This mistrust may be one of the causes why individuals – especially individuals from young democracies as is the Latin American case – to locate them in the left-right political scale. They make a choice, but we need to investigate if this specific choice was made by ideological reasons or if came from their own life experience and may be biased by that. This reflects the con-clusions of Kuschnir and Carneiro (1999) regarding the importance of the per-formance of democratic institutions to the political culture and the need of considering the individual as a part of a whole, his political environment, the in-stitutional context and the historical background they have.
Finally, from the point of view of elections, this study is not concerned with the elections results – although it questions the relation of political outcomes with individual political positioning. One of the causes for that comes is related to what Palmeira (1992) affirms about vote and ideology. The vote is an individ-ual choice that follows some criteria. However, these criteria are not only based on individual per se but are also grounded in other individual relations that may redirect his initial and “pure” choice (Palmeira 1992). Ideology, therefore, plays a role in this choice, but it is not the sole definer of vote’s outcome.
choice. The next sections of this study deal with the empirical data to reach con-clusions about these choices and their revealed preferences.
III. Dataset and preliminary findings
This study relies on the World Values Survey’s fifth wave (2005-2008). This dataset is composed of data that have been collected globally, and the ques-tions are related to diverse subjects associated with the quality of life of individ-uals. We choose the fifth wave because it offers an adequate data available to capture the leftist political shift in Latin America and because this data set con-tains information regarding many Latin American countries in the sample. From the available sample, we included all the Latin American countries that participated in this wave: Argentina, Brazil, Chile, Colombia, Mexico, Peru, and Uruguay.
In this study, the aim is to directly understand the impact of these individuals owns attributes on their declared self-positioning about the political leaning. We had different possibilities to understand this subject. One of them was to make a time series review about the individual positioning on political leanings. This would bring us very insightful answers about Latin American countries trends on the subject. However, as our goal is focused on understanding how in-dividuals were positioning themselves specifically during the political left turn in the region, we opted by studying only the 5th wave of the WVS that covers exactly the beginning of the 2000’s. Our reasoning here follows closely the one posed by Dalton, Farrell and McAllister (2011), that the political positioning between left and right may not always represent the same concept of political leanings for different countries or even individuals living in the same country. Nevertheless, it surely allows an interpretation of how the individual compares him/herself with others on the same subject. It is the inclusiveness of the scale and its simplicity that makes possible to summarize individual political posi-tioning (Dalton, Farrell & McAllister 2011).
We used two complementary methodological approaches. First, in this sec-tion, we used the descriptive method. Results from this analysis made possible both to understand the historical/political context that was taking place in these countries during the “left turn” as to select the best variables to include in the ec-onometric model, our second approach that is presented in the next section with its results.
However, before we proceed to analyze the average individual positioning during the 5th wave of the WVS – when the left turn took place – it is important to evaluate these average political positioning – for each country – over the course of several WVS waves. The “left-right” variable describes individual po-litical positions using a ten-point scale that ranges from “left” (value=1) to “right” (value=10). Each respondent selects the integer that optimally repre-sents his/her political values. An average value that is 5 or lower reprerepre-sents a leftist choice, whereas a value of 6 or higher represents a rightist position.
indi-viduals with the most constant positioning: 5.45 in the 2nd wave and 5.43 in the 5th.
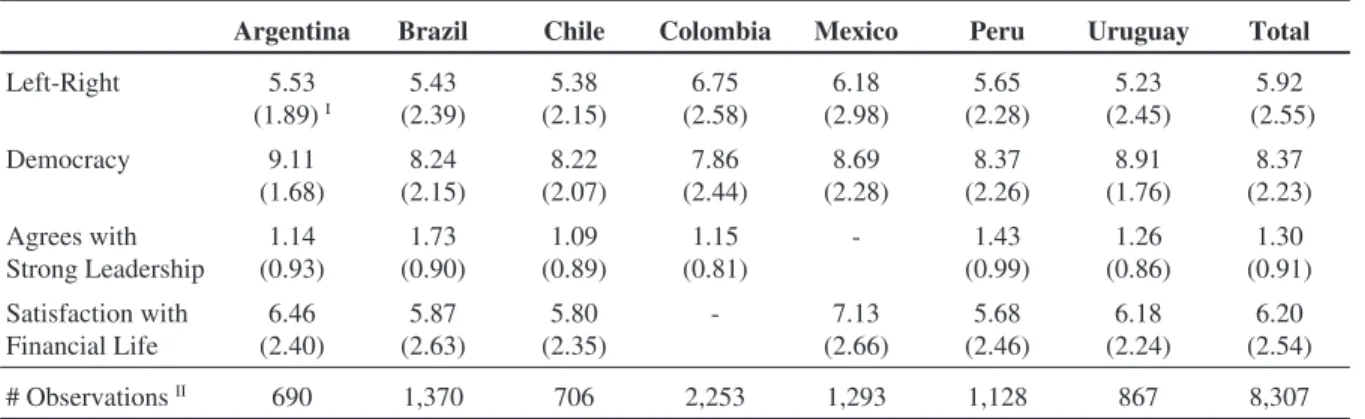
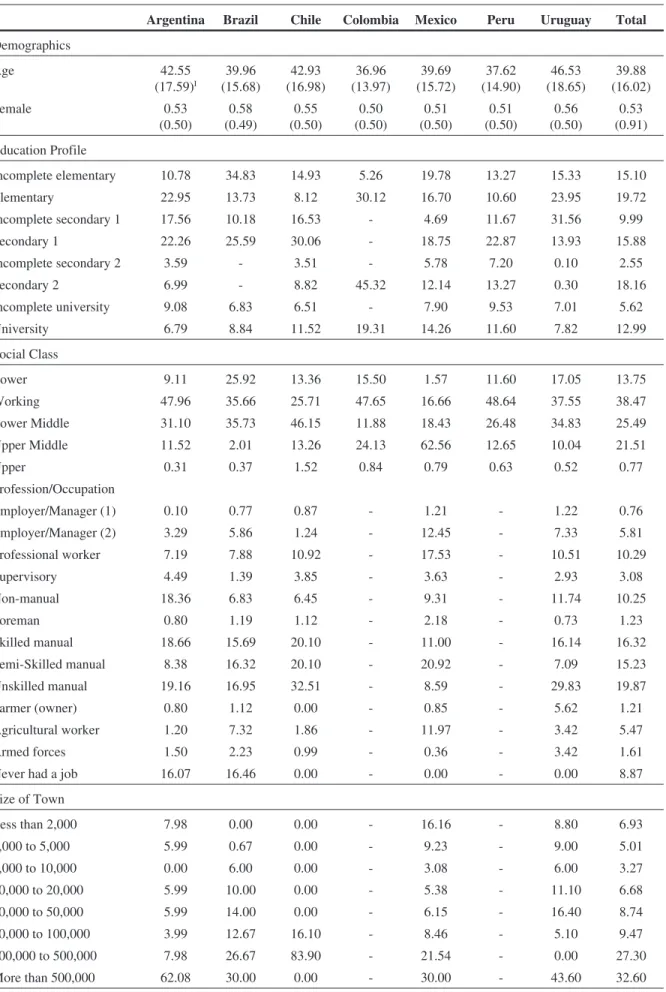
Tables 1 and 2 present sample attributes for each country’s population and the Latin American averages. Table 1 presents the social and political self-placement of the individuals and, Table 2, the demographic attributes of these individuals.
Table 1 shows that the average value of political leaning for the entire sam-ple is 5.92, which represents a central to subtle right leaning. The most pro-left selections were made by Uruguayan individuals, with an average value of 5.23, and the most pro-right selections were made by Colombians, with an average value of 6.75
This last result can be explained by the heritage of Civil War in Colombia, from 1948 to 1958. If, on one hand, considering themselves as pro-left in Ar-gentina had a syndicalist meaning, in Colombia it could mean a violent ideol-ogy, related to the radical left wing and the FARC (Revolutionary Armed Forces of Colombia—People’s Army). In this case, the value of 6.75 could be explained by the fact that even if the respondents considered themselves as cen-tral-left, their answer could tend to be central-right, an option which could not be associated to the FARC but would still be a centrist opinion (Avilés 2012).
Regarding the Brazilian average for the left-right scale, the 5.43 result for the 5th wave indicates a centrist to left leaning, meaning a slighter change of di-rection compared to Singer’s results for 1993, which indicated a centrist to right leaning position. Singer (2002) also explains that when it comes to analyzing Brazilian’s position using the left-right scale, is important to consider that vot-ers usually don’t know how to define left and right ideologies despite the fact that a significant portion of them knows where to locate themselves in this scale. Related to this result, Sartori (2005) has previously concluded that the existence of ideological identification does not mean a structured thinking, once is impor-tant to include the “vote by image” in addition to the strong ideological focus and the vote buys identification (unstructured). The vote by the image is equiva-lent to the ideological vote.
This finding may seem unexpected because when the World Values Survey interviews for the fifth wave were conducted, most voters were selecting leftist party representatives as presidents. However, our findings are far from being unique in this field. Seligson (2007), Arnold and Samuels (2011) among others
Table 1 - Social and Political Self-Placement
Argentina Brazil Chile Colombia Mexico Peru Uruguay Total
Left-Right 5.53 (1.89)I 5.43 (2.39) 5.38 (2.15) 6.75 (2.58) 6.18 (2.98) 5.65 (2.28) 5.23 (2.45) 5.92 (2.55) Democracy 9.11 (1.68) 8.24 (2.15) 8.22 (2.07) 7.86 (2.44) 8.69 (2.28) 8.37 (2.26) 8.91 (1.76) 8.37 (2.23) Agrees with Strong Leadership 1.14 (0.93) 1.73 (0.90) 1.09 (0.89) 1.15 (0.81) - 1.43 (0.99) 1.26 (0.86) 1.30 (0.91) Satisfaction with Financial Life 6.46 (2.40) 5.87 (2.63) 5.80 (2.35) - 7.13 (2.66) 5.68 (2.46) 6.18 (2.24) 6.20 (2.54)
# ObservationsII 690 1,370 706 2,253 1,293 1,128 867 8,307
Source: The authors, using data from The World Values Survey – Fifth Wave (2005-2008).
IThe standard deviations are listed in parentheses.
IIThese values reflect the number of people who answered the question regarding political positioning between left and right.
Table 2 - Sample Attributes
Argentina Brazil Chile Colombia Mexico Peru Uruguay Total
Demographics
Age 42.55
(17.59)I
39.96 (15.68)
42.93 (16.98)
36.96 (13.97)
39.69 (15.72)
37.62 (14.90)
46.53 (18.65)
39.88 (16.02)
Female 0.53
(0.50)
0.58 (0.49)
0.55 (0.50)
0.50 (0.50)
0.51 (0.50)
0.51 (0.50)
0.56 (0.50)
0.53 (0.91)
Education Profile
Incomplete elementary 10.78 34.83 14.93 5.26 19.78 13.27 15.33 15.10
Elementary 22.95 13.73 8.12 30.12 16.70 10.60 23.95 19.72
Incomplete secondary 1 17.56 10.18 16.53 - 4.69 11.67 31.56 9.99
Secondary 1 22.26 25.59 30.06 - 18.75 22.87 13.93 15.88
Incomplete secondary 2 3.59 - 3.51 - 5.78 7.20 0.10 2.55
Secondary 2 6.99 - 8.82 45.32 12.14 13.27 0.30 18.16
Incomplete university 9.08 6.83 6.51 - 7.90 9.53 7.01 5.62
University 6.79 8.84 11.52 19.31 14.26 11.60 7.82 12.99
Social Class
Lower 9.11 25.92 13.36 15.50 1.57 11.60 17.05 13.75
Working 47.96 35.66 25.71 47.65 16.66 48.64 37.55 38.47
Lower Middle 31.10 35.73 46.15 11.88 18.43 26.48 34.83 25.49
Upper Middle 11.52 2.01 13.26 24.13 62.56 12.65 10.04 21.51
Upper 0.31 0.37 1.52 0.84 0.79 0.63 0.52 0.77
Profession/Occupation
Employer/Manager (1) 0.10 0.77 0.87 - 1.21 - 1.22 0.76
Employer/Manager (2) 3.29 5.86 1.24 - 12.45 - 7.33 5.81
Professional worker 7.19 7.88 10.92 - 17.53 - 10.51 10.29
Supervisory 4.49 1.39 3.85 - 3.63 - 2.93 3.08
Non-manual 18.36 6.83 6.45 - 9.31 - 11.74 10.25
Foreman 0.80 1.19 1.12 - 2.18 - 0.73 1.23
Skilled manual 18.66 15.69 20.10 - 11.00 - 16.14 16.32
Semi-Skilled manual 8.38 16.32 20.10 - 20.92 - 7.09 15.23
Unskilled manual 19.16 16.95 32.51 - 8.59 - 29.83 19.87
Farmer (owner) 0.80 1.12 0.00 - 0.85 - 5.62 1.21
Agricultural worker 1.20 7.32 1.86 - 11.97 - 3.42 5.47
Armed forces 1.50 2.23 0.99 - 0.36 - 3.42 1.61
Never had a job 16.07 16.46 0.00 - 0.00 - 0.00 8.87
Size of Town
Less than 2,000 7.98 0.00 0.00 - 16.16 - 8.80 6.93
2,000 to 5,000 5.99 0.67 0.00 - 9.23 - 9.00 5.01
5,000 to 10,000 0.00 6.00 0.00 - 3.08 - 6.00 3.27
10,000 to 20,000 5.99 10.00 0.00 - 5.38 - 11.10 6.68
20,000 to 50,000 5.99 14.00 0.00 - 6.15 - 16.40 8.74
50,000 to 100,000 3.99 12.67 16.10 - 8.46 - 5.10 9.47
100,000 to 500,000 7.98 26.67 83.90 - 21.54 - 0.00 27.30
also found out that Latin American residents place themselves at the cen-tre-right distribution of political leanings. Or, as Foweraker, Landman and Harvey (2003, p.104) point out: “The result is a narrower ideological spectrum with a political centre of gravity that has moved to the right”. Oddly enough, they moved their gravitational centre to right and voted for the leftist parties.
Some possible reasons explain how individuals identify themselves with central-right political leanings and vote for left wing parties. The first explana-tion for this unexpected result is that the left-wing parties in Latin America chose to change their approach to the electorate after finding themselves on a losing streak that lasted several election cycles. Their platform shifted from rad-ical to more centrist (Hunter 2010). This change in approach was especially evi-dent in Brazil and Uruguay. In Brazil, the charismatic leader Luiz Inácio Lula da Silva (known as Lula) was defeated in three presidential elections (1990, 1994 and 1998). Lula lost for Fernando Henrique Cardoso’s reelection especially be-cause of his lack of international support, an important factor considering the re-cent high inflation scenario and the popular aversion to instability, giving space to a popular conservative voice (Singer 1998) and also because of Fernando Henrique Cardoso’s campaign strategy of pushing poorer electors against the leftist ideology defended by Lula (Singer 2009).When his party, PT (Partido dos Trabalhadores), changed its strategy to attract more voters, Lula won the 2002 and 2006 elections. Lula also supported Dilma Rousseff, his political heir, in her successful 2010 candidacy. According to Hunter (2010, p.184), “[...] one needs to win elections to be able to implement one’s programs, and the leaders of the PT sooner or later came to understand this fundamental point and to push for the necessary changes in their own party”.
Another explanation for this left turn in Latin America may be the disap-pointment in the neo-classical solutions to economic demands and its social ef-fects over income distribution that was lagged to the potential population needs. In this direction, Murillo, Oliveros and Vaishnav (2010) conclude that “[...] Latin American voters value the voting booth both as a mechanism of account-ability to punish bad performance that they can monitor and as a selection mech-anism for choosing alternatives that are different from the incumbents whom they are sanctioning” (page 107). Blanco and Grier (2013) include other poten-tial explanatory variables to the matter of left turn in Latin American countries (as openness to trade and agricultural exports, for instance) and also conclude
Argentina Brazil Chile Colombia Mexico Peru Uruguay Total
Frequency to the Religious Cult
More than once a week 5.69 22.41 7.24 10.83 11.98 10.49 9.58 11.77
Once a week 14.47 26.42 18.10 34.70 34.32 30.53 17.15 28.34
Once a month 15.87 17.06 15.51 18.91 17.97 22.13 15.81 18.19
Special days 10.98 3.61 8.58 7.61 10.69 12.78 8.46 8.73
Once a year 7.19 3.41 7.65 5.92 5.22 6.79 9.58 6.02
Less than once a year 14.87 21.47 13.96 10.73 8.44 9.48 12.03 12.59
Never 30.94 5.62 28.96 11.30 11.40 7.80 27.39 14.35
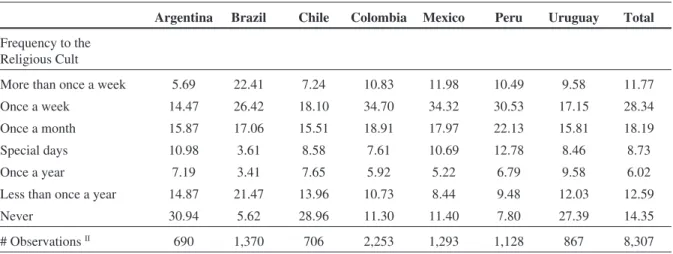
# ObservationsII 690 1,370 706 2,253 1,293 1,128 867 8,307
Source: The authors, using data from The World Values Survey – Fifth Wave (2005-2008).
IThe standard deviations are listed in parentheses.
IIThese values reflect the number of people who answered the question regarding political positioning between left and right.
that voters chose the turn to the left in response to their unattended demands on social and economic outcomes.
Independent of the main reason that motivated voters to choose left wing candidates to confide their votes to, it is necessary to acknowledge that a politi-cal positioning also involves other attitudes. We included two personal ques-tions regarding democracy (the extent to which a person values democracy) and leadership (the importance of having a strong leader) and one question regard-ing life satisfaction (financial satisfaction, which reflects an individual’s con-tentment with the political status quo) (Corbetta, Cavazza & Roccato 2009). From a scale of one (democracy is unimportant) to ten (democracy is crucial), our sample yields an average of 8.37, which indicates that the majority of the re-spondents highly value democracy. As discussed by Moreno (1999), the demo-cratic-authoritarian dimension was of great importance for the political positioning of Latin American residents immediately following long periods of dictatorships. This dimension may diminish in importance with the ongoing consolidation of democracy in the region. Data from the fifth wave of the World Values Survey indicate that the Latin American respondents continue to assign great weight to this issue, which may reflect their desire for a more stable demo-cratic environment. The findings may also indicate that democracy will con-tinue to be a central issue even after its complete consolidation.
In terms of leadership, a rating of zero indicates that a respondent thinks it is “very bad” to have a strong leader (meaning an authoritarian leader who is not concerned with congress and elections) and a rating of 3 represents an agree-ment to the concept of strong leadership (representing the respondent that thinks it is “very good” to have a strong leader). Perhaps not surprisingly due to the re-cent history of dictatorships among these Latin American countries (for in-stance, the democratic regime backer emerged in Brazil as recently as the 1980s), the average is 1.30, meaning a slight position against strong leadership.
Finally, Table 1 indicates the extent to which individuals are satisfied with the financial well-being of their families. Using a scale from one (completely unsatisfied) to ten (completely satisfied), Latin American individuals report an average value of 6.20, which indicates a slight tendency for satisfaction. The three countries with most satisfied individuals are Mexico, Argentina, and Uru-guay. It may sound strange because all these countries had low rates of eco-nomic growth compared to other Latin American countries during the early 2000s. However, these three countries also presented greater variations in their GDP growth during these years, as can be seen in Figure 1. Argentina went from a GDP growth of -10.89% in 2002 (according to World Bank data) to a 9.18% in 2005. Similar results were found for Uruguay (-7.73% GDP growth rate in 2002 to 7.46 in 2005) and Mexico (-0.16% GDP growth in 2001 to 4.05 in 2004). Low values for the “financial satisfaction” variable may represent a desire for a change, that is, a transformation of the status quo, which usually corresponds to leftist political leanings (Zechmeister 2006). We test this variable in our regres-sions.
Table 2 presents the demographic of these countries’ populations. The aver-age aver-age of the sample respondents was 39.88 years. Approximately half of the sample is composed of women (53 percent), and an average of only 13 percent of the sample hold a university degree.
(0.77%) as “upper social class”. The majority of the sample is concentrated be-tween working and lower-middle class (38.47% and 25.49%, respectively). Chile is the country with the greatest proportion of upper-class individuals (1.52% of the respondents) and Brazil is the country with the greatest propor-tion of the lower class (25.92%).
Previous research (Wiesehomeir & Doyle 2012) found that profession/cur-rent occupation could have a significant influence on political positioning. In our Latin American sample, 6.57 percent of the respondents are employers (business owners) or managers, and 71.45 percent of the respondents are work-ers. We will use the profession/occupation variable to measure the effects of class positioning—in terms of an entrepreneurial career orientation or more/less skilled worker—on political positioning.
Larger cities are associated with a greater likelihood of having a more di-verse political environment (Kolossov, Vizgalov & Borodulina 2003). There-fore, in our regressions, we included dummy variables that represent city sizes. They range from “less than 2,000 inhabitants” to “more than 500,000 inhabit-ants”. In the countries in which the data for this variable are available, an aver-age of 33 percent of the sample resides in large cities (more than 500,000 inhabitants).
Another important individual characteristic that may influence the political choices of voters is their religiosity. To address this factor, we included dummy variables representing the reported frequency to the religious cult. Forty percent of the sample attends church at least once per week.
In the following section, we present the results of our analysis of the above mentioned variables. Our goal is to draw individual profiles from the existing
literature to understand how these profiles influence the political positions of Latin American residents.
IV. Left and right: how do Latin Americans position themselves?
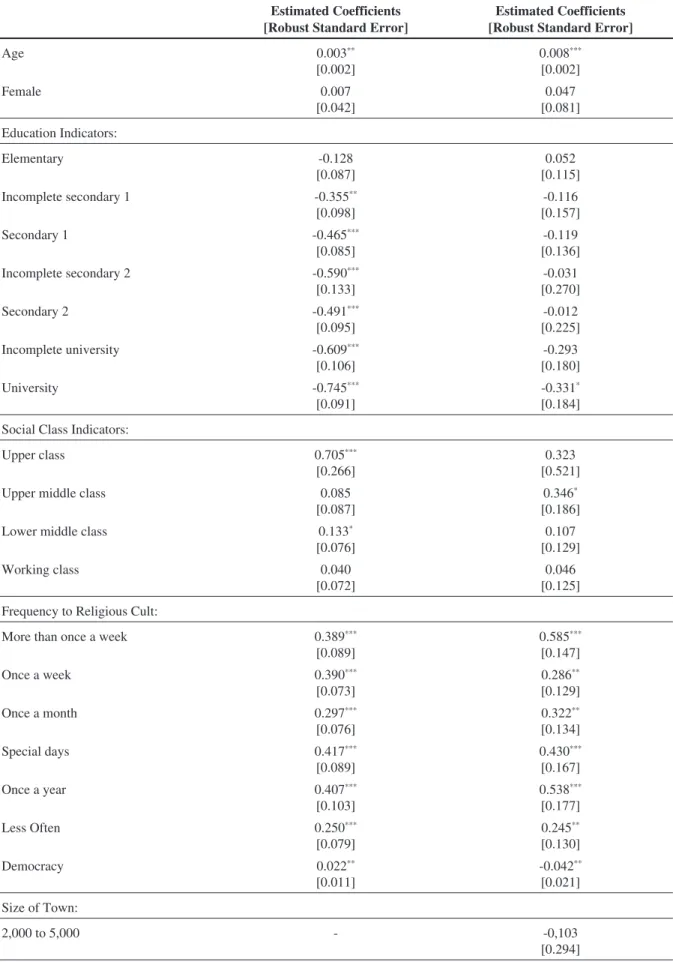
Demographic and cultural aspects may also shape the concepts of “left” and “right” (Zechmeiter 2006; Corbetta, Cavazza & Roccato 2009). Using the World Values Survey’s fifth wave, we demonstrate the influence of the preced-ing variables on the likelihood of the self-positionpreced-ing of voters to the left or right of the political spectrum. Because the dependent variable is limited (i.e., its variance is limited to the range of one to ten), we choose the ordered logit model as our formal method. The ordered logit model enables an analysis of the effect of each variable on the political positioning of the respondents.
Table 3 presents the results for two samples. The first column includes the seven countries in the sample (Argentina, Brazil, Chile, Colombia, Mexico, Peru, and Uruguay). The second column presents the results for a restricted sample (Argentina, Brazil, Chile, and Uruguay) because some of these variables were not available for all countries.
As shown in the first column, our results for the seven-country sample indi-cate that five variables have a significant influence on political positioning among Latin American residents: age, education indicators, social class indica-tors, religiosity dummies, and opinions regarding democracy. For each year of age, there is an increase of 0.003 points in the likelihood of self-positioning to the right of the political scale. If one considers leftist positioning to be a chal-lenge to the status quo, then younger people may find it more appealing to ques-tion established norms and structures.
In addition, other variables also favor a right position: social class (belong-ing to the upper classes increases the likelihood of right-lean(belong-ing attitudes by 0.705 and fitting in the lower middle class increases this likelihood in 0.133 points both compared to lower class) and religiosity (attending religious ser-vices at least rarely increases the likelihood of right-leaning attitudes when compared to an individual that never attends a religious cult).The influence of religiosity is reasonable: Latin American countries are predominantly Catholic and conservative (Hawins, Kitschelt, & Llamazares 2010). The leftist political position advocates change, and churches — especially the Catholic Church — tend to be conservative. Therefore, it may be expected that individuals who are more active in the religious arena are also likely to demonstrate rightist political leanings. Moreno (1999) found that the importance that a respondent assign to God (a useful proxy for this paper’s religiosity variable) is significant for his/her political party positioning. In terms of economic left-right positioning, Moreno (1999) also finds that religious respondents position themselves further to the right of the political scale than less religious respondents; thus, his results are similar to the findings in this paper.
A university education has the opposite effect: the higher the education de-gree, the lower the inclination toward right-wing positions. For instance, the possession of a university degree decreases the likelihood of rightist positioning by 0.745 points when compared to individuals with no education. These results are intuitive and are backed by the existing literature (these results reflect con-sonance with the ones obtained by Harbers, Vries and Steenbergen 2012).
Table 3 - Baseline Model
Estimated Coefficients [Robust Standard Error]
Estimated Coefficients [Robust Standard Error]
Age 0.003**
[0.002] 0.008*** [0.002] Female 0.007 [0.042] 0.047 [0.081] Education Indicators: Elementary -0.128 [0.087] 0.052 [0.115]
Incomplete secondary 1 -0.355**
[0.098]
-0.116 [0.157]
Secondary 1 -0.465***
[0.085]
-0.119 [0.136]
Incomplete secondary 2 -0.590***
[0.133]
-0.031 [0.270]
Secondary 2 -0.491***
[0.095]
-0.012 [0.225]
Incomplete university -0.609***
[0.106]
-0.293 [0.180]
University -0.745***
[0.091]
-0.331*
[0.184]
Social Class Indicators:
Upper class 0.705***
[0.266]
0.323 [0.521]
Upper middle class 0.085
[0.087]
0.346*
[0.186]
Lower middle class 0.133*
[0.076]
0.107 [0.129]
Working class 0.040
[0.072]
0.046 [0.125]
Frequency to Religious Cult:
More than once a week 0.389***
[0.089]
0.585***
[0.147]
Once a week 0.390***
[0.073]
0.286**
[0.129]
Once a month 0.297***
[0.076]
0.322**
[0.134]
Special days 0.417***
[0.089]
0.430***
[0.167]
Once a year 0.407***
[0.103]
0.538***
[0.177]
Less Often 0.250***
[0.079]
0.245**
[0.130]
Democracy 0.022**
[0.011]
-0.042**
[0.021]
Size of Town:
2,000 to 5,000 - -0,103
Estimated Coefficients [Robust Standard Error]
Estimated Coefficients [Robust Standard Error]
5,000 to 10,000 - 0.150
[0.339]
10,000 to 20,000 - -0,296
[0.254]
20,000 to 50,000 - -0,360
[0.247]
50,000 to 100,000 - -0,319
[0.251]
100,000 to 500,000 - -0,593**
[0.240]
More than 500,000 - -0,565**
[0.223]
Profession/Occupation
Employer/Manager (1) - -0.205
[0.528]
Employer/Manager (2) - 0.102
[0.197]
Professional worker - -0.086
[0.182]
Supervisory - -0.378
[0.250]
Non-manual - 0.007
[0.147]
Foreman - -0.254
[0.387]
Skilled manual - -0.152
[0.131]
Semi-Skilled manual - 0.005
[0.139]
Farmer (owner) - 0.04
[0.354]
Agricultural worker - -0.032
[0.217]
Armed forces - 0.166
[0.240]
Never had a job - 0.008
[0.148]
Life Satisfaction - 0.085***
[0.018]
Strong Leader - 0.058***
[0.043]
Brazil -0.196**
[0.076]
-0.206*
[0.114]
Chile -0.099
[0.082]
-0.029 [0.147]
Colombia 0.921***
[0.079]
-Mexico 0.539***
[0.090]
the other hand, differed significantly, with a greater likelihood of 0.196 of leftist positioning compared with the Argentine respondents.
As discussed in the previous section, other variables may provide insight into the issue of political choices between left and right. However, these vari-ables are not available for all countries in the sample. By reducing our sample for Argentina, Brazil, Chile, and Uruguay, we perform a complete regression that includes a respondent’s labour market position, a measure of financial sat-isfaction, dummy variables to indicate residence in larger or smaller cities, and an indicator variable for support for a strong leader. The results are presented in the second column of Table 3 and are generally consistent with the findings that were presented in the previous analysis.
The variables of age, university degree, and religiosity continue to be signif-icant, and all the variables maintain their effects. The age effect increases from 0.003 points to 0.008 points of likelihood, keeping the direction towards right-wing choice. A higher income level also corresponds to rightist political tendencies; as such respondents tend to favour the status quo. Thus, we ex-pected that belonging to the upper class would increase the likelihood of a re-spondent favouring a rightist political position. Our results indicate that belonging to the upper-middle class corresponds to an increased probability of right-leaning political positions of 0.346.
The possession of a university degree is more likely to correspond to a pro-left position when compared with lower educational attainment. This influ-ence is large and significant, with a decreasing likelihood of 0.331 of selecting a right-leaning position. A small portion of the Latin American population holds a university degree (an average of 13 percent within our sample). However, the leftist movement gained momentum at the schools and universities within these countries (Rubin 2002). Therefore, studying and attaining higher levels of edu-cation appear to be associated with having a leftist political position.
In addition to holding a university degree, residing in a city with 100,000 or more inhabitants compared with living in a city with less than 10,000 inhabit-ants decreases the likelihood of self-positioning to the political right. Possible explanations range from the greater diversity of larger cities to the ease with which one can mingle with people of different political positions who question the status quo.
In contrast, life satisfaction and strong-leader preferences increase the likeli-hood of self-positioning to the right of the political spectrum. The results re-garding life satisfaction are consistent with prior findings: political rightists prefer to maintain continuity in a country’s economic approach if it is stable (Kingstone & Ponce 2010). After individuals have struggled with high inflation
Estimated Coefficients [Robust Standard Error]
Estimated Coefficients [Robust Standard Error]
Peru 0.164**
[0.074]
-Uruguay -0.038
[0.110]
-0.429**
[0.212]
# Observations 7,518 2,455
Pseudo R2 0.0181 0.0141
Source: The authors, using data from The World Values Survey – Fifth Wave (2005-2008).
Notes:*indicates that the coefficient is significant at the 10 percent level,**indicates that the coefficient is significant at the 5
percent level, and***indicates that the coefficient is significant at the 1 percent level.
and/or unemployment rates, they find that economic stability provides security, which causes such individuals to prefer to maintain the economic policies that led to their improved circumstances. Parties that noted this shift in the attitude of the electorate changed their platforms accordingly; such changes were success-ful in Brazil and Uruguay (Hunter 2010).
The strong-leader finding implies that although the left wing typically has charismatic leaders, leftist individuals do not typically support dictators. For these four countries, the support of a strong leader increases in 0.058 points the likelihood of the individual supporting right-wing parties. The Democratic di-mension continues to be important to Latin American individuals with a leftist orientation. The source of this preference may be the recent experiences of au-thoritarian dictatorships in Latin America that were supported by the right wing. As Foweraker, Landman and Harvey (2003, p.70) point: “In Brazil (1964) and Chile (1973), important segments of the middle classes responded to political instability and ideological polarization by turning to the armed forces as the only national institution capable of restoring order.” The support and regard to strong leadership have this affinity to right leaning in Latin America, sustained by these historical and recent events.
As a final remark, two of the countries that were analyzed—Brazil and Uru-guay—tend to display more leftist political leanings than the Argentine compar-ison group. Chile shows no significant difference when compared with Argentina. The likelihood of self-positioning to the right of the political spec-trum is considerably lower in these countries compared with Argentina.
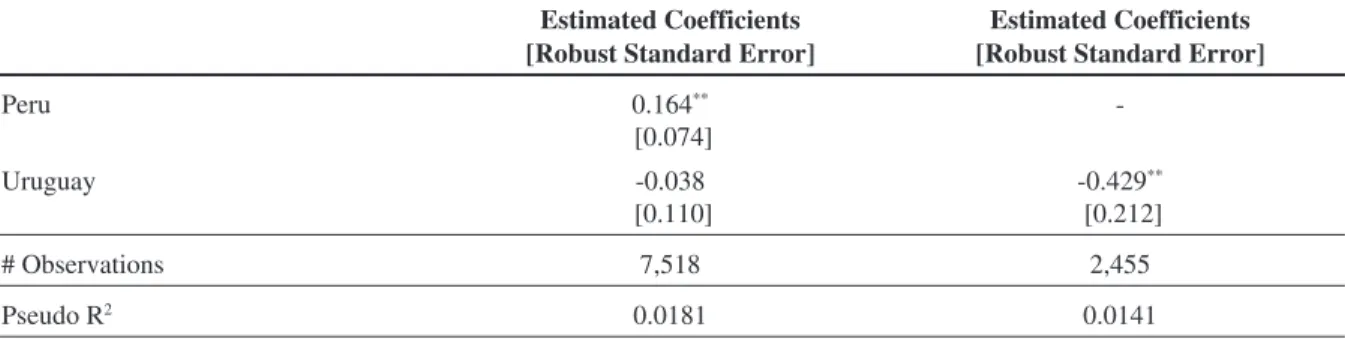
As a validation test, we included the individual effects of each country to all variables. To do this, we included interactions of each variable with all coun-tries individually. Because the majority of them were not statistically signifi-cant, we opted by eliminating all the nonsignificant variables at each step (except by the ones we included in the original models presented on Table 3). The final model configuration, that used an ordered logit model, is presented in Table 4.
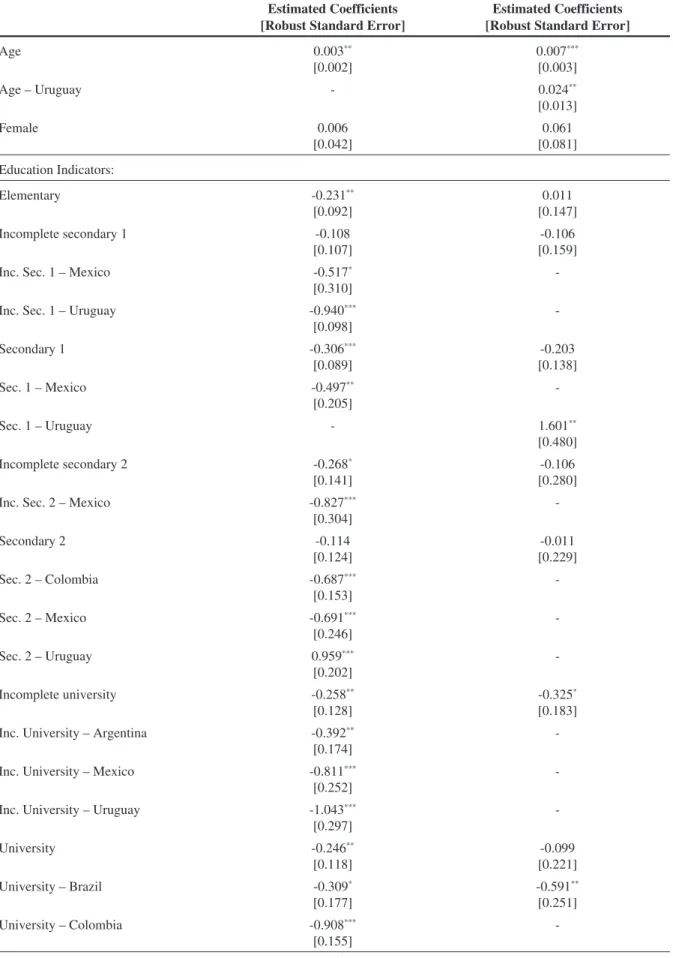
The first column presents the estimated results for the model with all the six countries. All the estimated coefficients have the same direction presented in the first column of Table 3. This consonance among results of different specifi-cations corroborates validating our previous results. Some countries present more influence of education – for instance, Brazil, Colombia, Mexico, and Uru-guay have more leftist individuals when they completed college than Argentina, Chile, and Peru. This result relates both with Singer (2002) and Carreirão (2002) as with Dalton, Farrell and McAllister (2011) who point that the political cleverness increases with education. This does not mean that it is clever to posi-tioning more as a leftist in contrast with a rightist, but that it is easier to under-stand the political spectrum when one is more informed also about different topics.
Others have more religious influence – as is the case of Argentina, Brazil, and Colombia, where very religious persons (the ones who frequent churches more than once a week) are more inclined to rightist wing than in other coun-tries.
Table 4 - Model with Specific Country Controls
Estimated Coefficients [Robust Standard Error]
Estimated Coefficients [Robust Standard Error]
Age 0.003**
[0.002]
0.007***
[0.003]
Age – Uruguay - 0.024**
[0.013]
Female 0.006
[0.042]
0.061 [0.081]
Education Indicators:
Elementary -0.231**
[0.092]
0.011 [0.147]
Incomplete secondary 1 -0.108
[0.107]
-0.106 [0.159]
Inc. Sec. 1 – Mexico -0.517*
[0.310]
-Inc. Sec. 1 – Uruguay -0.940***
[0.098]
-Secondary 1 -0.306***
[0.089]
-0.203 [0.138]
Sec. 1 – Mexico -0.497**
[0.205]
-Sec. 1 – Uruguay - 1.601**
[0.480]
Incomplete secondary 2 -0.268*
[0.141]
-0.106 [0.280]
Inc. Sec. 2 – Mexico -0.827***
[0.304]
-Secondary 2 -0.114
[0.124]
-0.011 [0.229]
Sec. 2 – Colombia -0.687***
[0.153]
-Sec. 2 – Mexico -0.691***
[0.246]
-Sec. 2 – Uruguay 0.959***
[0.202]
-Incomplete university -0.258**
[0.128]
-0.325*
[0.183]
Inc. University – Argentina -0.392**
[0.174]
-Inc. University – Mexico -0.811***
[0.252]
-Inc. University – Uruguay -1.043***
[0.297]
-University -0.246**
[0.118]
-0.099 [0.221]
University – Brazil -0.309*
[0.177]
-0.591**
[0.251]
University – Colombia -0.908***
[0.155]
-Estimated Coefficients [Robust Standard Error]
Estimated Coefficients [Robust Standard Error]
University – Mexico -1.015***
[0.223]
-University – Uruguay -1.261***
[0.374]
-Social Class Indicators:
Upper class 0.697***
[0.267]
0.587 [0.514]
Upper middle class 0.074
[0.088]
0.313*
[0.189]
Lower middle class 0.080
[0.077]
0.071 [0.132]
Working class 0.019
[0.073]
0.132 [0.129]
Working class – Chile - -0.754***
[0.221]
Frequency to Religious Cult:
More than once a week 0.169
[0.129]
0.667***
[0.147]
More than weekly – Argentina 0.540**
[0.255]
-More than weekly – Brazil 0.462***
[0.158]
-More than weekly – Colombia 0.330*
[0.176]
-More than weekly – Mexico - -1.856**
[0.733]
More than weekly – Uruguay - -0.355**
[0.098]
Once a week 0.411***
[0.073]
0.309**
[0.128]
Once a month 0.235***
[0.083]
0.324**
[0.134]
Once a month – Argentina 0.285**
[0.139]
-Once a month – Mexico 0.333*
[0.170]
-Special days 0.335***
[0.092]
0.422**
[0.170]
Special days – Mexico 0.434**
[0.214]
-Once a year 0.444***
[0.103]
0.537***
[0.178]
Less Often 0.279***
[0.080]
0.243*
[0.131]
Democracy 0.033**
[0.016]
-0.189***
[0.029]
Democracy – Argentina -0.176***
[0.040]
Estimated Coefficients [Robust Standard Error]
Estimated Coefficients [Robust Standard Error]
Democracy – Brazil - 0.244**
[0.041]
Democracy – Chile -0.191***
[0.036]
-Democracy – Colombia 0.053**
[0.026]
-Democracy – Uruguay -0.122**
[0.057]
-Size of Town:
2,000 to 5,000 - 0.075
[0.299]
5,000 to 10,000 - 0.389
[0.347]
10,000 to 20,000 - -0,012
[0.262]
20,000 to 50,000 - -0,029
[0.253]
50,000 to 100,000 - -0,034
[0.263]
100,000 to 500,000 - -0,277
[0.253]
More than 500,000 - -0,111
[0.261]
More than 500,000 – Argentina -0.375**
[0.184]
Profession/Occupation
Employer/Manager (1) - -0.126
[0.502]
Employer/Manager (2) - 0.100
[0.197]
Professional worker - -0.084
[0.199]
Professional – Chile -0.809***
[0.281]
Supervisory - -0.399
[0.247]
Non-manual - 0.145
[0.149]
Non-manual – Uruguay -1.902***
[0.620]
Foreman - -0.262
[0.404]
Skilled manual - -0.128
[0.131]
Semi-Skilled manual - 0.051
[0.139]
Farmer (owner) - 0.051
inclination towards the left wing of the political leaning. This finding reinforces the previous ones about the influence of academics to the left wing in Brazil. Another interesting result is the importance of religiousness to the Uruguayans: those who frequent churches more than once a week are the ones more inclined to the left. Previous regressions pointed to the fact that more a person frequented churches, more he/she was inclined to self-declaration towards the right. Uru-guay, in this sense, is an exception: very religious people are more prone to-wards the left (a different sort of left than the Brazilian one, for instance. Moreira (2000) points to several aspects that distinguish Brazilian and Uru-guayan’s left).
Results concerning the importance of democracy are another interesting one. Both on Table 3 and Table 4, regressions presented in the first columns – the ones with no control for city size, nor profession, life satisfaction and impor-tance of a strong leader – show that more imporimpor-tance to democracy is something that leads individuals to self-declare more to the right. Second columns have a different result: when additional controls are included and the sample is re-stricted to Argentina, Brazil, Chile and Uruguay, those who declare to give great importance to democracy are the ones who also declare themselves prone
Estimated Coefficients [Robust Standard Error]
Estimated Coefficients [Robust Standard Error]
Agricultural worker - 0.038
[0.225]
Armed forces - 0.121
[0.248]
Never had a job - 0.015
[0.151]
Life Satisfaction - 0.086***
[0.018]
Strong Leader - -0.033
[0.053]
Strong leader – Argentina 0.239***
[0.087]
Brazil -1.761***
[0.370]
-2.189***
[0.400]
Chile -0.118
[0.435]
0.236 [0.217]
Colombia -0.645*
[0.383]
-Mexico -0.648
[0.395]
-Peru -1.461***
[0.373]
-Uruguay -0.055
[0.581]
-1.374**
[0.621]
# Observations 7,518 2,455
Pseudo R2 0.0229 0.0248
Source: The authors, usind data from the World Values Survey – Fifht Wave (2005-2008).
Notes:*indicates that the coefficient is significant at the 10 percent level,**indicates that the coefficient is significant at the 5
percent level, and***indicates that the coefficient is significant at the 1 percent level. Although we included many variables in
to the left wing. However, on Table 4, we can observe that the exception to this rule is Brazilians: democracy to them is a predictor of right political leaning in both cases (with and without additional controls). Although the dictatorship in Brazil was led by the right wing, it appears to be the case that individuals do not relate themselves with those political leaders, but with the more pro-democracy ones.
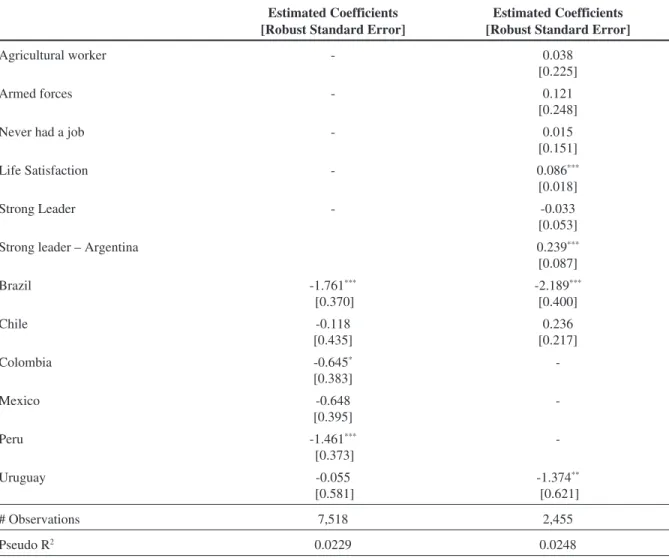
Finally, including additional controls, the importance of a strong leader – that was significant on Table 3, drops its statistical significance. However, this variable is significant only to Argentina, where it continues to predict a more pro-right political leaning to the individuals who agree with the benefits of hav-ing a strong person as a leader.
Summarizing, our results indicate that the major variables that influence the political leanings of an individual are age, educational attainment, religiosity, the importance assigned to democracy, residence in a large city, financial satis-faction, and support for a strong leader. The results are consistent even when ad-ditional variables are included: some variables lose their significance; however, the direction of the effects – except for the democracy variable, which was taken by the result on the strong leadership variable – is maintained.
V. Conclusions
This paper aimed to determine how individual attributes affected the politi-cal self-positioning of Latin Americans in the early 2000s. We use the World Values Survey’s fifth wave to investigate this subject. Similar studies that used different waves of the World Values Survey data were conducted by Moreno (1999) and Jou (2010). Our results found that political cleavages depend on de-mographic factors, economic factors and individual opinions in agreement with these previous studies.
Increased age, religious service attendance, and satisfaction with one’s fi-nancial life increase the tendency of individuals for self-positioning to the right of the political spectrum. The possession of a university degree and residence in a large city increases the likelihood of individuals of self-identifying with a left-ist political position. The importance that an individual place on democracy and his/her preference for a strong leader appears only when the sample is restricted to four countries (Argentina, Brazil, Chile, and Uruguay). The democracy vari-able, which had no significance in the first model, gains significance in the sec-ond one. At the same time, the inclusion of a variable that controls to support for a strong leader—someone who does not respect democracy— also increases in importance. As discussed previously, these results may be excessively influ-enced by two countries, Argentina and Chile, and are less significant among the other countries in the sample.
This study contributes to the literature by analyzing the influence of per-sonal attributes on political choices. Although this research represents an im-portant step toward understanding political leanings in Latin America, a signifi-cant amount of future research remains. The definitions of “left” and “right” continue to be unclear as they relate to dimensions that include democracy, au-tocracy, and political reform. More quantitative analyses aiming to understand how the individual preferences are formed and the link between personal attrib-utes and these preferences continue to be on demand. Understanding the ways individuals set up their choices would increase the responsibility of political parties and authorities for the hidden claim the population has about their deliv-erables.
con-clusion about the relation between agreeing with a strong leadership and politi-cal leaning. Although left-wing parties tend to be led by hardened and charis-matic leaders, leftist voters prefer democracy and do not believe in the necessity of a strong leader itself. Choosing a candidate that resembles more what intrin-sically is desired by the voters would surely help election outcomes, especially if these parties meet the alignment between what they must offer and what is un-der the preferences of their supporters.
Finally, even with so many confounding aspects in this antagonist position, left and right continues to be a simple way to characterize veiled assumptions. Therefore, it may be an ambiguous form of defining choices, but this seemingly binary choice is still very significant for voters in Latin America. In this regard, better information about its core meaning and objectives would be very wel-comed not only to the academic public – which shows great interest in the sub-ject – but to the ordinary population – who ultimately experiences its consequences.
Regina Carla Madalozzo ([email protected]) é Doutora em Economia pela Universidade de Illinois em Urbana-Cham-paign (Estados Unidos) e Professora Associada do Departamento de Economia e Administração do Insper. Vínculo Insti-tucional: Departamento de Economia e Administração, Insper, São Paulo, SP, Brasil
Afonso Mariutti Chebib ([email protected]) é Mestre em Economia pelo Insper. Atua como consultor na Endura Part-ners. Vínculo Institucional: Departamento de Economia e Administração, Insper, São Paulo, SP, Brasil
References
Ames, B. & Smith, A.E., 2010. Knowing Left from Right: Ideological Identification in Brazil: 2002-2006.Journal of Politics in Latin America, 2(3), pp.3-38.
Arnold, J.R. & Samuels, D.J., 2011. Evidence from Public Opinion. In S. Levitsky & K.M. Roberts, eds.The Resurgence of the Latin American Left. Baltimore: The Johns Hopkins University Press.
Avilés, W., 2012. Columbia’s Left. Its Power, Influence and Challenges.Latin American Perspectives, 39(1), pp.5-9. DOI: 10.1177/0094582X11422209
Blanco, L. & Grier, R., 2013. Explaining the Rise of the left in Latin America.Latin American Research Review, 48(1), pp.68–90.
Blofield, M. & Luna, J.P., 2011. Public Opinion on Income Inequalities in Latin America. In M. Blofield, ed.The Great Gap: Inequality and the Politics of Redistribution in Latin America.University Park: Pennsylvania State University Press. Bowen, J.D., 2011. The Right in “New Left” Latin America.Journal of Politics in Latin America, 3(1), pp.99-124.
Cameron, M., 2009. Latin America’s Left Turns: Beyond Good and Bad.Third World Quarterly, 30(8), pp.331-348. DOI: 10.1080/01436590802681082
Cameron, M. & Hershberg, E., 2010.Latin America’s Left Turns: Politics, Policies & Trajectories of Change. London: Lyanne Rienner Publishers.
Carreirão, Y., 2002.A decisão do voto nas eleições presidenciais brasileiras.Rio de Janeiro: FGV Editora. Castañeda, J.G., 2006. Latin America’s Left Turn.Foreign Affairs, 85(3), p.28.DOI: 10.2307/20031965
Colomer, J.M. & Escatel, L.E., 2005. La Dimension Izquierda-Derecha em America Latina.Desarollo Económico, 45(177), pp.123-136. DOI: 10.2307/3655894
Corbetta, P.; Cavazza, N. & Roccato, M., 2009. Between Ideology and Social Representations: Four Thesis plus (a new) One on the Relevance and the Meaning of the Political Left and Right. European Journal of Political Research, 48(5), pp.622-641. DOI: 10.1111/j.1475-6765.2009.00845.x
Dalton, R.; Farrell, D. & McAllister, I., 2011.Political Parties and Democratic Linkage: How Parties Organize Democracy. New York: Oxford University Press.
Druckman, J.N. & Lupia, A., 2000. Preference Formation. Annual Review of Political Science, 3(1), pp.1-24. DOI: 10.1146/annurev.polisci.3.1.1
Foweraker, J.; Landmand, T. & Harvey, N., 2003.Governing Latin America.Hoboken: Blackwell Publishing.
Harbers, I.; Vries, C.E. & Steenbergen, M.R., 2012. Attitude Variability among Latin American Publics: How Party System Structuration Affects Left/Right Ideology. Comparative Political Studies, 46(8), pp.947-967. DOI: 10.1177/0010414012454409
Hawins, K.; Kitschelt, H. & Llamazares, I., 2010. Programmatic Structuration around Religion and Political Regime. In H. Kitscheltet al.eds.Latin American Party SystemsCambridge, UK: Cambridge University Press.
Jou, W., 2010. Political Cleavages in Serbia: Changes and Continuities in Structuring Left-Right Orientation.Southeast Euro-pean and Black Sea Studies, 10(2), pp.187-206. DOI: 10.1080/14683857.2010.486947
Kingstone, P.R. & Ponce, A.F., 2010. From Cardoso to Lula: The Triumph of Pragmatism in Brazil. In K. Weyland; R.L. Ma-drid & W. Hunter, eds.Leftist Governments in Latin America: Successes and Shortcomings. Cambridge, UK: Cambridge University Press.
Kolossov, V.; Vizgalov, D. & Borodulina, N., 2003. Voting Behavior in Russian Cities, 1995-2000.Journal of Communist Studies & Transition Politics, 19(4), pp.25-40. DOI: 10.1080/13523270300660027
Kuschnir, K. & Carneiro, L.P., 1999. As dimensões Subjetivas da Política: Cultura Política e Antropologia da Política.Revista Estudos Históricos, 13(24), pp.227-250.
Moreira, C., 2000. A Esquerda no Uruguai e no Brasil: cultura política e desenvolvimento partidário.Opinião Pública6(1), pp.17-54. DOI: 10.1590/s0104-62762000000100002
Moreno, A., 1999.Political Cleavages: Issues, Parties, and the Consolidation of Democracy. Boulder: Westview Press. Murillo, M.V.; Oliveros, V. & Vaishnav, M., 2010. Electoral Revolution or Democratic Alternation?Latin American Research
Review, 45(3), pp.87-114.
Palmeira, M., 1992. Voto: racionalidade ou significado?Revista Brasileira de Ciências Sociais, 20, pp.26-30.
Power, T.J. & Jamison, G.D., 2005. Desconfiança política na América Latina. Opinião Pública, 12(1), pp.64-93. DOI: 10.1590/s0104-62762005000100003
Puntigliano, A.R., 2008. Beyond ‘Left’ and ‘Right’: A Zean Perspective of Latin American Dichotomies. In A.R. Puntigliano & A. Garcé, eds.Latin America: Left, Right or Beyond?Stockholm: Stockholm Review of Latin American Studies. Rubin, J.W., 2002. From Che to Marcos: The Changing Grassroots Left in Latin America.Dissent, 49(3), pp.39-47.
Samuelson, P.A., 1972. Maximum Principles in Analytical Economics.American Economic Review, 62(3), pp.249-262. DOI: 10.1126/science.173.4001.991
Sartori, G., 2005.Parties and Party Systems: A Framework for Analysis. Colchester: ECPR Press.
Seligson, M.A., 2007. The Rise of Populism and the Left in Latin America.Journal of Democracy18(3), pp.81-95. DOI: 10.1353/jod.2007.0057
Singer, A., 2002.Esquerda e Direita no eleitorado brasileiro: A identificação Ideológica nas Disputas Presidenciais de 1989 e 1994. São Paulo: Edusp.
_____, 2009. Raízes sociais e ideológicas do Lulismo. Novos Estudos, 85, pp.83-102. DOI: 10.1590/s0101-33002009000300004
Singer, P., 1998. No olho do furacão. Teoria e Debate, 39. Available at
http://www.teoriaedebate.org.br/materias/economia/no-olho-do-furacao. Accessed Aug. 24, 2017.
Wiesehomeier, N. & Doyle, D., 2012. Attitudes, Ideological Associations and the Left-Right Divide in Latin America.Journal of Politics in Latin America, 4(1), pp.3-33.
Zechmeister, E., 2006. What’s Left and Who’s Right? A Q-Method Study of Individual and Contextual Influences on the Meaning of Ideological Labels.Political Behavior, 28(2), pp.151-173. DOI: 10.1007/s11109-006-9006-5
Other sources
Preferências políticas e escolhas individuais: Uma perspectiva de países Latino Americanos
Resumo
A análise das posições individuais com relação ao posicionamento político entre direita e esquerda é um trabalho desafiador, pois características pessoais podem influenciar decisões políticas sem, no entanto, serem sua causa original. Esse problema pode ser ainda mais pronunciado na América Latina, onde as jovens democracias têm o desafio de estabilizar as escolhas políticas ao longo do tempo. Esse estudo contribui para a literatura analisando as influências das características pessoais nas escolhas políticas, com foco no início dos anos 2000, quando ocorreu a “virada da esquerda”. O presente estudo utiliza dados do World Values Survey em sua quinta onda (2005 – 2008) com esse objetivo. Essa base de dados é construída através de uma coleta global de dados e as questões são relacionadas a diferentes assuntos que implicam em impressões sobre a qualidade de vida dos indivíduos. A partir dos dados disponíveis, incluímos os países latino-americanos que participaram dessa onda: Argentina, Brasil, Chile, Colômbia, México, Peru e Uruguai. Nesse estudo, o objetivo foi estimar diretamente o impacto das características individuais dos respondentes desses países em suas autodeclarações a respeito de seu posicionamento político. Com esse objetivo, estimamos um modelo de logit ordenado para a melhor compreensão da forma como cada variável afetava a escolha de posicionamento individual. Nossos resultados apontam que a inclinação para posicionamento político depende de fatores demográficos, econômicos e opiniões individuais, corroborando com estudos anteriores. Conforme o indivíduo envelhece, apresenta maior frequência em cultos religiosos e se sente satisfeito com sua vida financeira, ele apresenta uma maior tendência de se auto declarar como “direita”. Ter completado o ensino superior e residir em uma cidade grande aumenta a probabilidade dos indivíduos se identificarem como “esquerda” no espectro político. Esse estudo contribui para a literatura ao analisar as influências das características pessoais nas escolhas de posicionamento político. Embora essa pesquisa represente um passo importante no sentido de decifrar as inclinações políticas em países da América Latina, uma significativa parcela de assuntos interessantes ainda estão em aberto. As definições de “esquerda” e “direita” continuam obscuras quando as relacionamos com temas como democracia, autocracia e reformas políticas. Entender os caminhos que cada indivíduo utiliza para fazer suas escolhas aumentaria a responsabilidade dos partidos políticos e das autoridades no sentido que as demandas não reveladas da população seriam melhor atendidas. Ao mesmo tempo, estudos como o nosso permitem que seja potencializada a conscientização dos partidos políticos com relação aos candidatos que os representam no sentido de atender às percepções dos eleitores. Por fim, mesmo com muitos aspectos conflitantes nas posições políticas extremas, os termos esquerda e direita continuam caracterizando hipóteses básicas sobre o que representam. Então, mesmo sendo definições ambíguas, essa escolha binária é ainda muito significativa para eleitores da América Latina.
Palavras-chave: preferências políticas; inclinações políticas; eleitores da América Latina; características individuais; Pesquisa Mundial de Valores.