A brief overview of the Portuguese Agriculture – Its evolution,
performance and current situation
Uma breve visão geral da Agricultura Portuguesa - A sua evolução, o desempenho e a situação atual
Carlos Alberto Falcão Marques
Évora University
Abstract: In 2016 passes the thirty anniversary of the entrance of Portugal to the
European Union, at the time the EEC (European Economic Community). This article is a brief and broad overview of the Portuguese agriculture and of its evolution, performance and current situation, within that temporal context. A characterization of Portuguese agriculture and its importance for the country is presented. Major factors that characterize its performance over recent times and the current situation, such as general and historical setting, climate and environment, agricultural structural and socio-economic characteristics, development of rural areas, trade balance, agricultural and rural development policies, are reviewed to give a broad perspective of its evolution.
Keywords: Portugal; Agriculture; Rural development; Characteristics; Evolution.
Resumo: No ano que vem, 2016, passam 30 anos sobre a adesão de Portugal à
União Europeia, na altura a CEE (Comunidade Económica Europeia). Este artigo é uma breve apresentação geral da agricultura Portuguesa e da sua evolução, performance e situação actual, nesse contexto temporal. A agricultura Portuguesa e a sua importância para o país é caracterizada. Os principais factores que caracterizam a evolução da sua performance nesses anos e a situação actual, incluindo o enquadramento geral e histórico, o clima e o ambiente, as características estruturais e socio-económicas, o desenvolvimento das áreas rurais, o comércio internacional e as políticas agrícolas e de desenvolvimento rural, são revistos para fornecer uma perspectiva global da sua evolução.
Palavras-chave: Portugal; Agricultura; Desenvolvimento rural; Caracteristicas;
Evolução.
JEL: O18; Q13 Introduction
In this article a brief characterization of Portuguese agriculture and its importance within the country is done in order to give a general portrait or representation of its major aspects in absolute and relative terms with respect to its different functions. That is also its main objective, i.e., to give the reader that is not familiar with the Portuguese agriculture an overview of its evolution, performance and current position.
Several statistical publications from Portuguese Statistics Institute (INE, 2015) and country sheets and profiles (AICEP 2015, European Commission 2015) introduce Portugal and the Portuguese agriculture to potential investors, technical, politicians, researchers and general public. This characterization of Portuguese agriculture draws on those publications and on recent overall and agriculture diagnostics done for
Portuguese 2020 programmes submitted to European Commission, namely Rural Development Programme 2014-2020 (MAM, 2014). For historical evolution and broad information the article benefits from the author views and previous publications.
2. General and historical setting
It is usual to ear that Portugal is “sloped to the sea”. Having in mind Portuguese geography we would think that this saying is due to its location in the south western part of Europe with east and north frontiers with Spain and facing the Atlantic Ocean in its whole west and south coasts.
However, this saying represents a much different set of views besides the geographical one. It also indicates that population is largely concentrated in the west and south strip of its territory. As we could expect that also means that economic possibilities and activities are also concentrated in the coastal and adjacent areas.
Hence, agriculture in Portugal and its performance in territorial, social and economical terms have a great importance for the whole country but particularly to rural areas of Portugal in terms of sustainable development, i.e., social, environmental and economic cohesion and progress.
Portugal was until the revolution of 1974, that brought democracy to the country after Salazar,’ dictatorship of almost half century, a predominantly rural society. Although EFTA (European Free Trade Association), in the beginning of the 60’s, and Marcelo “spring”, changes in the regime implemented by the prime minister that substituted Salazar, in the early 70’s brought economic growth and reforms, colonial settlement policies and lack of formal education of the large majority of Portuguese promoted migration of rural population to escape from poverty and to search for new opportunities within the country to industrial and urban areas in the coast and outside the country to Europe and to Portuguese colonies in Africa.
The peaceful revolution and regime transition promoted and directed by military, the AFM (Armed Forces Movement) pass gradually the control to civil authorities after elections for a new constitution, President and Government. The country lived new times and new ways under the AFM lemma of “the three Ds” towards “Decolonization, Democracy and Development”.
With the negotiations and entrance to the European Economic Community in 1986 Portugal assumed European membership and commitment to become a developed country. Joining European partners in the creation of Euro zone with a common currency in the beginning of this century cemented monetary and economic ties creating new opportunities and opening new challenges to cope with competition of the most developed countries of Europe.
3. Climate and environment
Climatic conditions in mainland Portugal are characteristics of the Mediterranean area in particularly in the south softened with the Atlantic influence in the West and North of the country. Average temperatures are moderate varying from 8º in the north to 19º in the south. Winters are cold and humid and summers are dry and hot. Minimum temperatures can go down to -10º in the interior north and center during winter, with snow in higher lands, and maximum temperatures can go up to
40º in the interior south during summer. Precipitation ranges from 3200 in the northern mountains to 400 in the interior south. It is concentrated in the winter and during summer in the south there is practically no rain.
Characteristic agro-forestry systems of Portuguese agriculture are adapted to climatic conditions. In rainfed areas vegetal and livestock systems choices are based in winter crops and pastures. When irrigation is available other options are available, including spring-summer crops and pastures, fruits, vegetables or production levels are much higher, including permanent crops like vineyards and olive.
Agriculture and forestry have a fundamental role in preserving environment and landscapes in Portugal. Together they cover 75.3 % of land, with natural area being also a relevant category with 20.7 of the territory (Ventura-Lucas et al.).
Irrigated area represented 13 % of total agricultural land used. This share is expected to increase with the irrigated area of the Alqueva dam in development in the South of Portugal. In 2005, 92.4 % of agricultural used area respected to less favourable areas, 30.2 % being in mountain zones. Therefore, nom less favourable area share of used agricultural area makes only 7.6 % in Portugal. Hence, a major part of agriculture is practiced in difficult conditions for this activity. Extensive grazing area, where livestock is less than 1 livestock unit per hectare of forage, is 58.5 % of grazing used area. Natura 2000 special protection areas and sites of community importance areas represented 10.7 and 17.4 % of the territory, respectively. There is 18.5 % of agricultural used surface and of 18 % of forestry area under Nature area. In terms of biodiversity, more than 30 % of used agricultural area is considered farmland of high nature value.
Agricultural production systems also have important impacts on water use and quality and soil. Only 3.7 % of the territory is reported as nitrate vulnerable zone and estimates of soil loss due to water in areas of risk of soil erosion are above 4 tons/ha/year. Agriculture also has impact on air quality. Agriculture in Portugal contributed in the beginning of the century with 9.3 % for total annual emissions but these levels have been decreasing since then. Production of renewable energy from agriculture and forestry around is still low for average standards but is increasing at slow annual growth rates and utilised agricultural area devoted to energy and biomass production are very low for EU-27 average standard.
4. Structural characteristics of agriculture – Evolution, major trends and current situation
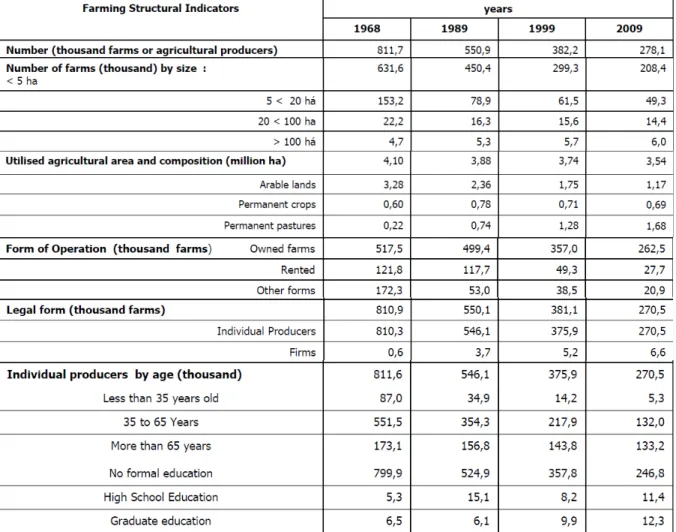
Portuguese agriculture has experience large and continuous decrease of agricultural producers (see Table 01). From more than eight hundred thousand, farm number decreased to below three hundred thousand. Roughly, since 1968, two out of each three small farms with less than 20 hectares and one out of each pair of farms with less than 100 ha no longer exist. This adjustment trend has been more moderate in the last years. The number of farms with more than 100 hectares has increased, steadily.
The same holds for land. Utilised agricultural area has registered moderate but continuous decrease from 4.1 to 3.5 million hectares. But, substantial change has happened in land use patterns. Permanente pastures substitute arable lands (which are used for temporary crops) at large rates. From 3.3 we are down to 1.2 million hectares utilized as arable land, with less 0.6 million hectares during each last decade. Permanent pasture land area increased 8 times, with more than 0.5 million
hectares each last decade. Land used in permanent crops increased, then experienced a slight reduction and, more recently, a stabilization trend.
Table 01 – Selected structural indicators of Portuguese Agriculture, 1968, 1989, 1999 and 2009
Source: Instituto Nacional de Estatística, Agricultural Census, 1968, 1989, 1999 and 2009.
With respect to land ownership, a steadily decrease of the number of farms rented or operated under other forms has occurred in the last two decades and of the relative number of owned operated farms has been increasing.
Individual producers still are the overwhelming majority of legal form of farms. Firm/company total number of farms is increasing in absolute and relative terms but is still a very low proportion of farms.
Structural indicators in terms of age and formal education of individual producers are particularly expressive. Dividing age classes in young, middle and old aged (less than 35, between, 35 and 65, and more than 65), the largest is the third group. Hence, human capital is made of very high and increasing relative proportion of aged producers. On the other hand, there is a low proportion of young producers and decreasing during time, which indicates that young people is still leaving agriculture. In addition, a very high proportion of producers have no formal school training (more than 90%) but high school and university graduates in agriculture are increasing in absolute terms in the last two decades.
The latest survey on the structure of agriculture of 2013 indicates that these long run structural tendencies are still happening and provides a broad picture of the current situation. Area under agricultural utilization was estimated in 3.6 million hectares (see table 2). This represents less than half of the total rural area of Portugal (which includes forestry, natural and shrub areas) that is estimated to represent around 82% of total mainland Portuguese territory of 8.9 million hectares.
Extensification of land use is a trend in Portuguese agriculture. Latest
figures (IEA, 2013) estimated 1.8 million hectares under permanent pastures, i.e., half of total agricultural surface. Arable land used was estimated to be around 1.1 million (%) and permanent crops, which includes olive trees and vineyards, to be 0.7 million hectares (%).
This agricultural area was utilised by 264 thousand farms with an average farm agricultural area of 13.8 hectares. These mean figures hide a dual distribution of land per farm type. Land is highly concentrated in large farms. A very large number of small farms (less than 5 ha) have relatively low total availability of land and a very small number of large farms (over 500 ha) have a large part of total land available. Table 2 – Recent management dinamics of Portuguese agriculture
Structural I ndicators Farms and Farmers Concentration of land used
Farms (number) 305 266
Used Agricultural Area (hectares) 3 668 145 Average Used Agricultural Area per farm (hectares) 12,0
Extensification of land used
Arable Land (hectares) 1 173 127
Permanent Crops (hectares) 690 725 Permanent pastures (hectares) 1 784 598
Corporatization of farms
Single Producers (number) 297 381
Corporations (number) 6 776
Techical- economical Specializat ion
Specialised farms (number) 203 440 Crop production 148 585 Arable Crops 28 261 Permanent crops 111 535 Vine yards 36 474 Ol ive 25 957 Livestosck production 54 855 B eef 16 135 Mi lk 8 123 S heep meat 22 483
Mixed farms (number) 101 826
I rrigation
Irrigable area (hectares) 540 593 irrigated area (hectares) 469 039
2009 % 264 419 3 641 592 13,8 32,0 1 100 861 18,8 708 765 48,7 1 816 585 97,4 253 493 2,2 9 968 66,6 182 605 48,7 136 022 9,3 28 726 36,5 97 795 11,9 29 849 8,5 22 305 18,0 46 583 5,3 15 206 2,7 6 431 7,4 20 068 33,4 81 815 14,7 551 427 12,8 479 818 2013 Portugal % variação % -40 847 -13,4 -26 553 -0,7 1,8 14,6 30,2 -72 266 -6,2 19,5 18 040 2,6 49,9 31 987 1,8 95,9 -43888 -14,8 3,8 3192 47,1 69,1 -20 835 -10,2 51,4 -12 563 -8,5 10,9 465 1,6 37,0 -13 740 -12,3 11,3 -6 625 -18,2 8,4 -3 652 -14,1 17,6 -8 272 -15,1 5,8 -929 -5,8 2,4 -1 692 -20,8 7,6 -2 415 -10,7 30,9 -20 011 -19,7 15,1 10 834 2,0 13,2 10 779 2,3
Sources: Agricultural Census, 2009, and Farm Structure Survey, 2013, www.ine.pt.
As a result in farm numbers the degree of corporatization is very low. Corporations estimated to be around 10 thousand and only represent 3.8 % of total farm number. More than 250 thousand of single farmers made almost 96 % of total farms. However, corporations make a large part of agricultural area. Therefore, Portuguese agriculture is predominantly marketed oriented and business
managed in area terms.
Technical-economical specialization is increasing in Portuguese
agriculture. Almost 70 % of farmers are considered specialized. The majority, around 136 thousand farms or 51.4 % of total farms, is dedicated to crop production. Farms
specialized in animal production, around 46.6 thousand, make 17.6 % of total farms. Mixed farms make 30 % of the total.
5. Socio-economic performance
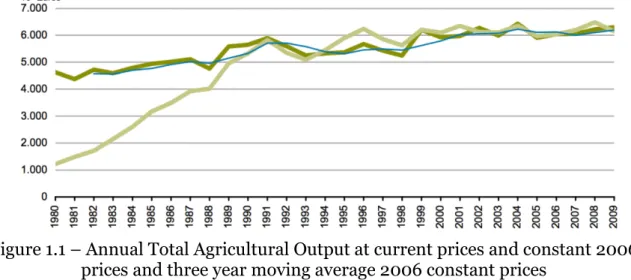
In global terms, agriculture in Portugal has performed poorly for a long time. Total agricultural output and value added of agriculture did not change significantly for the last six decades, i.e., Portuguese agriculture has been unable to sustain growth and retribution to factors of production over time (Marques, 1988, 2009 and INE, 2013).
Annual value of total agricultural output measured at current prices (light green line) and constant 2006 prices (dark green prices) and moving average of three years at constant 2006 prices (blue line) to reduce the yearly variability effect of climate for the thirty year period between 1980 and 2009 are presented in figure 1.1. Agricultural output grew at an annual average rate of 1.1% at constant prices. However, as figure 1.2 shows, agricultural gross added value registered practically no increase. This is due to an increase in the use of intermediate factors of production and to its higher prices not compensated by similar output price evolution. This means that farm income has been primarily supported by agricultural subsidies as figure 1.3 indicates.
Figure 1.1 – Annual Total Agricultural Output at current prices and constant 2006 prices and three year moving average 2006 constant prices
Figure 1.2 – Anual Agricultural Gross Value Added at current prices and constant 2006 prices and three year moving average 2006 constant prices
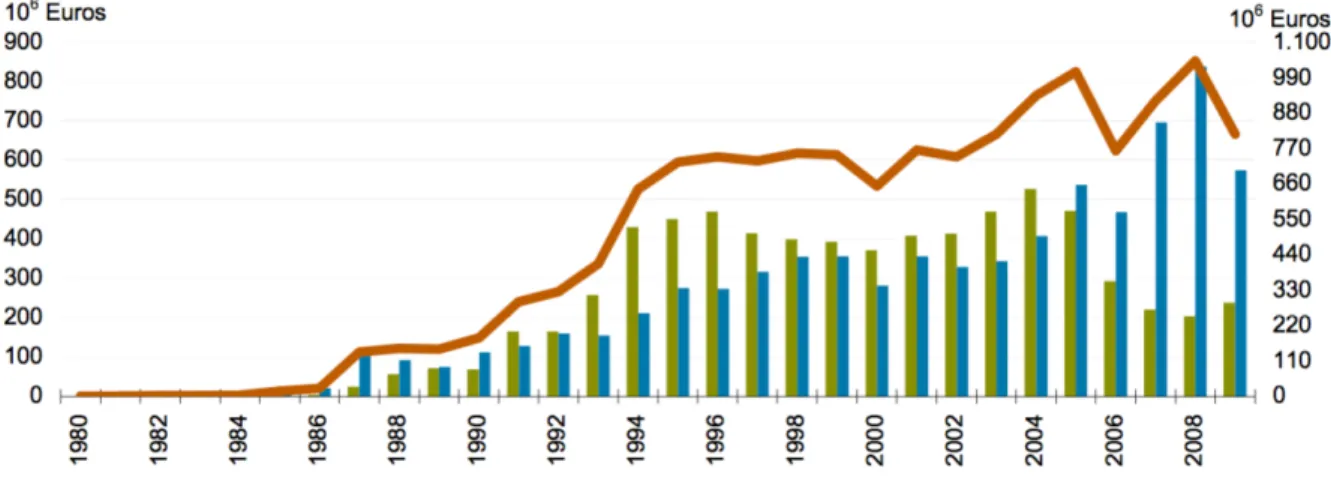
Figure 1.3 – Product, Direct Income and Total Support Source: Agricultural Economic Accounts, 2013.
That does not mean that change did not occur in agriculture. Indeed, substantial changes at structural level have taken place. Portuguese Gross Added Value has increased during this period at much higher rates than in agriculture. This has had two important effects. Firstly, the relative importance of agriculture in the Portuguese economy has decreased. The proportion of Agriculture in total value added has decreased from 11 to less than 2 %, as indicated in figure 2. Secondly, agricultural productivity of labour lower than in other economic sectors has driven a large part of active population out of agriculture. Volume of labour in agriculture measured in equivalent year work units (UTA) was estimated to be 1.1 million in 1980 and by 2009 was down to 0,4 million, i.e., a 64 % decrease (CEA, INE, p.35 and 43). Hence, agricultural labour productivity increase during this period is mainly due to the rapid decreasing levels of volume of labour in agriculture and not from increase in output.
Figure 2 – Proportion of Agricultural in Total Gross Added Value Source: Agricultural Economic Accounts, 2013.
6. Development of rural areas
In Portugal no predominantly rural areas1 (NUTS III) are found in the seaside. Hence, rural areas in Portugal are interior territorial areas of Portugal. They represent 69.7 % of the country territory. Traditionally, rural areas have low and declining population densities. Portuguese rural areas follow that pattern. In Portugal population is concentrated in the areas close to the sea and decreases rapidly as we move to interior areas. Average population density in Portugal is 114.9 inhabitants /km2. Population in rural areas represents 21 % of the population. Average population density in rural areas is 35 inhabitants / km2 and there is a tendency to declining population and, consequently, population density in these areas. These indicators contrast with increasing population densities of predominantly urban areas of Portugal, reaching an average value of 697 inhabitants / km2 in 2006. Portuguese rural areas have, proportionally, less people below 14 and between 14 and 64 and more people above 65 years old than urban areas.
Economic activities in rural areas of Portugal account for 16.7 of national Gross Value Added (GVA) and 20.7% of total employment. Production per capita2 in rural areas of Portugal is estimated in 60 % of EU average. European predominantly rural areas productivity is also lower (69%) than EU average (EU-27=100). This figure compares with 88 % for Portuguese urban areas. Hence, there is a large gap between productivity of rural and urban areas and production levels in rural areas of Portugal are particularly low at EU standards. This gap is increasing both for both Portugal and average EU but at much higher rates for Portugal.
7. Trade and commercial balance
The current account balance of Portugal, which includes trade in goods and services, presented in 2007 a deficit of about -9.9 % of GDP. The trade balance gives a decisive contribution to this negative balance representing -7.2 % of GDP. Services give a positive contribution (3.8 % of GDP). The deficit comes from the goods component, which amounts to 10.7 % of GDP (about 17.5 billion Euros). Goods accounted for 85 % of imports and 71 % of exports of commercial balance. This structural situation of the current account of Portuguese economy changed drastically since 2012 with current account superavits of 2.4 and 1 billion euros in 2013 and 2014, respectively. Goods balance remains in a deficit position of -8 and 9 billion euros for those years, respectively, therefore considerably lower than before recent economic and budgetary 2011-2014 period of adjustment.
The Portuguese trade deficit in agricultural and food goods amounted in 2007 to -3.7 billion euros. Thus, agri-food contributed with 21% to total trade deficit. The first of these groups of products, agricultural goods, makes the fundamental component of that deficit, about 3.5 billion. The food group makes a small part, -0.25 billion euros, representing 6.8 % of the total 3.7 billion. Imports of food and agricultural goods in 2007 amounted to about 7 billion Euros, distributed with values of 5 and 2 billion for these product groups, and represented about 9 and 3.6% of total Portuguese imports, respectively. Exports of these goods of 3.2 billion euros, divided
1 Following OECD criteria to classify predominant urban, intermediate and predominantly rural áreas. See EU Comission, Rural Development Report 2009, Chapter 3, p. 56.
into 1.5 and 1.7 billion for each group of products, represented 3.9 and 4.6% of Portuguese exports, respectively.
Agri-food complex trade deficit has varied but kept an average value close to the 2007 level. However, agro-forestry complex trade deficit has successively decreased due to the increasing superavit of forestry complex trade balance.
Figure 3 – Agro-forest complex trade balance
Source: Programa de Desenvolvimento Rural do Continente para 2020, Diagnóstico, p.3.
8. Agricultural and Rural Development Policies
Since 1986 Portuguese agriculture has been under the Common Agricultural Policy (CAP) of the European Union that has pillars and rules that apply to all member states. After an adjustment period that was negotiated before the accession, the common market reform of 1993 and successive reforms of CAP to decouple support from product production were implemented towards a single payment scheme that was implemented in the last reform. Support under this first pillar of the CAP has been increasing over time (see figure 1.3).
Additionally, Portugal has benefited from structural funds to modernise agriculture and develop rural areas, the second pillar of CAP, through rural development programs negotiated with the UE for each programming period.
Portuguese agriculture has adjusted structurally to this evolution. However, adjustments were not done smoothly having in mind long run policy changes under implementation. CAP has had final objectives and successive reforms were approved and implemented to achieve them. Portuguese objectives as these reforms were
implemented were not set and orientations were several times set and implemented with conflicting goals. In the first stage, before Single Market, long run potential competitiveness of traditional sectors, such as cereals and oilseeds, was overestimated and investments directed to these traditional sectors ended up not being used in profitable and sustained options as product prices adjusted to EU lower prices. In a second stage, during first schemes of decoupling, production requirements and tied compensation to class productivities of rainfed and irrigated land on a territorial base maintained land allocation and delayed resource shifts towards competitive production options. In this stage, major concerns are related with equitable access and compensation of farmers to ensure no barriers to entrance and fair competition in agriculture.
References
Agência Portuguesa do Ambiente, O Clima em Portugal,
http://www.apambiente.pt.
Agência para o Investimento e Comércio Externo de Portugal, AICEP, Portugal Global, Abril 2015, Portugal – Ficha País
European Commission, EC, Agriculture and Rural Development, January 2015, Member States Factsheets, Portugal
European Commission, EC, Agriculture and Rural Development, Rural Development Report, 2009.
http://en.wikipedia.org/wiki/Portugal, Climate.
Instituto Nacional de Estatística, INE. Recenseamento da Agricultura, 2009. Instituto Nacional de Estatística, INE. Inquérito às Estruturas das Explorações
Agrícolas, 2013.
Instituto Nacional de Estatística, INE. Contas Económicas da Agricultura 2000
-2009. 2013.
Instituto Nacional de Estatística, INE. A Península Ibérica em Números,
Portugal e Espanha: Realidade Ibérica e comparações no contexto europeu. 2014.
MARQUES, Carlos. The Portuguese Entrance to The EEC: Implications for
Dryland Agriculture of the Alentejo Region. Ph. D. Dissertation, Purdue
University, 1988.
MARQUES, Carlos. As Tendências Macroeconómicas e o Sector
Agro-alimentar em Portugal, Trabalho preparado para o Congresso “Estratégias para as Novas Agriculturas. Agrotec 09, Salão Internacional de
Agricultura, Pecuária e Espaços Verdes, Feira Internacional de Lisboa, 5 de Março, 2009.
MARQUES, Carlos. The evolution of the Portuguese agriculture in the
L.L., MARQUES da Silva, J.R. (Eds.) Sustainable agriculture – Poland and
Portugal. University of Life Sciences, Lublin, Poland and University of Évora,
Portugal, Cap. 1, p. 13-27, 2014.
MINISTÉRIO da Agricultura e do Mar, MAM. Plano de Desenvolvimento Rural
do Continente para 2020. 2014.
VENTURA-LUCAS, M. R., MARQUES, C., MARTINS, M. & FRAGOSO, R.
Portuguese Agriculture and Its Role in Multifunctional Rural Development, Applied Studies in Agribusiness and Commerce – APSTRACT,
Agroinform Publishing House, Budapest, 2011.
Submetido em 03/05/2015. Aprovado em 17/06/2015.
Sobre os autores
Carlos Alberto Falcão Marques
Doutor em Economia Agrícola (U. Purdue, 1988), Mestre em Economia Agrícola (U. Purdue, 1985), Licenciado em Gestão de Empresas. UE-ECS, Évora University, School of Social Sciences, Management Department and CEFAGE Center for Advanced Studies in Management and Economics Email: [email protected]