EVALUATION OF WOOD BASIC DENSITY AS AN
INDIRECT MEASUREMENT OF THE VOLUME OF WOOD
RAW MATERIAL
Sérgio Moura1, Domingo Abella2, Ofélia Anjos1,3,4
ABSTRACT:
The manufacturing process of wood agglomerate integrates distinct unit that transforms wood raw material into wood agglomerate. The yield of wood agglomerate produced is influenced by the density and the quality of the initial raw material. This work has compared two distinct methodologies aimed at defining the yield of the process through an indirect measurement at the precursor material.
Samples (logs of differentiated sizes) were collected immediately at the industry entrance and several parameters were measured. The logs basic density and the moisture content was annotated, through analysis of the corresponding dry and wet mass. Log bark percentage has estimated also at the level of dry and wet basis. These parameters were used to determine the wood volume from different provenance and species in the beginning of the industrial process.
The results indicated that wasn’t a great difference between the two different methods to determine the wood basic density and the wood volume in m3.
Principal components analysis was used to investigate the differences between different provenances and different species for the wood basic density, and we conclude there is a great variability in wood basic density for the hardwood species than the observed for the softwood and there isn’t a great variability between different provenances.
We study too the difference off wood moisture that could be occurring before the evaluation of wood basic density.
KEY WORDS: Basic density, moisture content, wood volume, wood agglomerate
1. INTRODUCTION
The mankind consumes approximately 3400 million m3 of wood, but for agglomerated
Industry is used about 300 million m3 (Esteban et al., 2002),only in Spain, it had an evolution
from 2003 to 2005 of 6.7 – 7.3 million m3, in 2006 to have an increase for 7.4 million m3
(Tafisa, 2006).
The raw material characteristics are a fundamental point in the all factory and a not corrected measurement of some properties could be conditioning the final price of product.
SONAE Indústria is the most important Portuguese group of companies manufacturing wood based products namely: particleboard; MDF (Medium Density Fibreboard); hardboard; OSB (Oriented Strand Board) and components, solutions and systems - for the furniture, building, decoration and DIY industries.
TRADEMA is a factory from the group Tafisa belongs to the group SONAE Indústria and produce particleboard; Medium Density Fibreboard and also featuring two melamine-coating lines and a paper impregnation line, this plant has a railroad branch line within its premises, undoubtedly a great advantage with regard to the logistics of purchases and supplies.
Wood species have long been recognized as a major variable in the manufacture of MDF. If a single species is used, the production process can be adjusted to have maximum uniformity in panel properties. However, a mixture of species is an important factor
influencing both physical and mechanical properties of the final product (Panshin and Dezeeuw, 1980; Aguilera et al., 2000). Basic density, which depends of the specie and the ecological conditions of growth, is a very important factor to evaluate the yield of particle board and Medium density fibreboard and determining the economics of agglomerated
factory. To determine the Basic density (g cm−3: oven-dry weight/wet volume) is very
important to measure the wet volume correctly and to well evaluate the characteristics of raw material in the entrance of factory.
The aim of that study is to evaluate the difference of wood basic density raw material by provenance and by species more used in the factory and to study different methodologies for moisture content determination to evaluate wood basic density.
2. MATERIAL AND METHODS
In that study we determine the basic density (wood dry weight per unit of maximum volume) of different wood samples species with different provenances. For that propose we collected in which truck 9 samples with raw material from different logs with three diameters class: Fin (diameter < 10cm), Mid (20>diameter > 10cm) and Wide (diameter > 20cm). The samples were saturated and measured their volume with the Archimedes principle. After, moisture content was determined by the difference in saturated weight and after drying at 105 ± 3°C.
For all samples we measured too the difference between green volume of wood and saturated volume wood.
The study was made in some trucks that enter in factory in the period of study, so we measured 60 trucks with Pinus pinaste, 41 trucks with Pinus sylvestris, 16 trucks with Pinus pinea, 25 trucks with Populus sp and 13with Eucalyptus rostrata.
3. RESULTS AND DISCUSSION
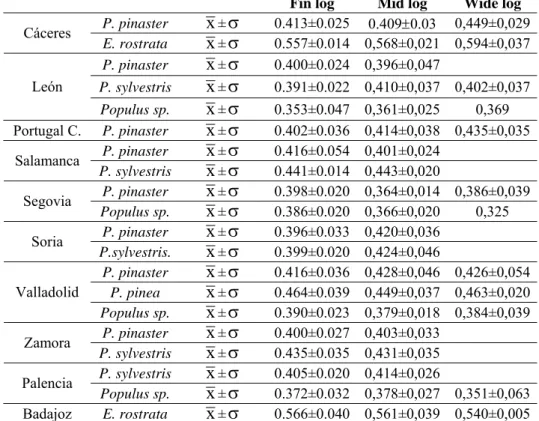
Table 2 shows the results of wood basic density measured in industry entrance by provenance and specie. Each value represents the mean of each class diameter log for all trucks by specie and by provenance.
The experimental results (Table 1) clearly show a great variability in the basic density measured, especially for the P. pinaster and Populus sp.. In fact, in factory come in (at the factory arrive) different clones of Populus sp. and that is responsible for the variability observed. We observe too a great difference between the three diameter classes because the wood with fin diameter have a higher percentage of juvenile wood characterized for a lower density when we compared the same tree (Maloney, 1986; Zobel and Buijitenen, 1989; Zobel and Sprague 1998; Un Li Shi et al., 2005).
Principal components analysis was used to search the differences in basic density for different species studied. Each value of these variables represents a mean of all logs measured.
In that study was chosen two factors because the factor 1 explained 96.83% of the total variation. We conclude that there was a good correlation between the three diameter class studied (fin log, mid log, wide log), although the great variability observed for each specie.
We projected the different species in study onto the same system of vectors. The results are presented on Figure 1, which shows how the values of different variables are highly correlated among them.
Table 1 – Wood basic density in industry entrance by provenance and specie.
Fin log Mid log Wide log
P. pinaster x±σ 0.413±0.025 0.409±0.03 0,449±0,029 Cáceres E. rostrata x±σ 0.557±0.014 0,568±0,021 0,594±0,037 P. pinaster x±σ 0.400±0.024 0,396±0,047 P. sylvestris x±σ 0.391±0.022 0,410±0,037 0,402±0,037 León Populus sp. x±σ 0.353±0.047 0,361±0,025 0,369 Portugal C. P. pinaster x±σ 0.402±0.036 0,414±0,038 0,435±0,035 P. pinaster x±σ 0.416±0.054 0,401±0,024 Salamanca P. sylvestris x±σ 0.441±0.014 0,443±0,020 P. pinaster x±σ 0.398±0.020 0,364±0,014 0,386±0,039 Segovia Populus sp. x±σ 0.386±0.020 0,366±0,020 0,325 P. pinaster x±σ 0.396±0.033 0,420±0,036 Soria P.sylvestris. x±σ 0.399±0.020 0,424±0,046 P. pinaster x±σ 0.416±0.036 0,428±0,046 0,426±0,054 P. pinea x±σ 0.464±0.039 0,449±0,037 0,463±0,020 Valladolid Populus sp. x±σ 0.390±0.023 0,379±0,018 0,384±0,039 P. pinaster x±σ 0.400±0.027 0,403±0,033 Zamora P. sylvestris x±σ 0.435±0.035 0,431±0,035 P. sylvestris x±σ 0.405±0.020 0,414±0,026 Palencia Populus sp. x±σ 0.372±0.032 0,378±0,027 0,351±0,063 Badajoz E. rostrata x±σ 0.566±0.040 0,561±0,039 0,540±0,005
x – Mean; σ– standard deviation
PP PP PP PP S C C C C E E -4 -3 -2 -1 0 1 2 Factor 1: 96.83% -0.6 -0.4 -0.2 0.0 0.2 0.4 0.6 0.8 Factor 2: 2.53%
Fig. 1 – Projection diagram of the cases on the factor plane (PP – P. pinaster , S – P. sylvestris, C
– Populos sp., E – E. rostrata).
The Pines species have a variation of wood density similar but different from the other species both hardwood, however E. rostrata and Populus sp are behave very differently. In fact that two hardwood have different characteristics, so different properties and different basic density.
It was done a new analysis of main components, for each species and different log provenances. We conclude that there isn’t a good correlation between different groups of wood log coming from the same zone and there is a great variability between different trucks for the same specie and same provenance.
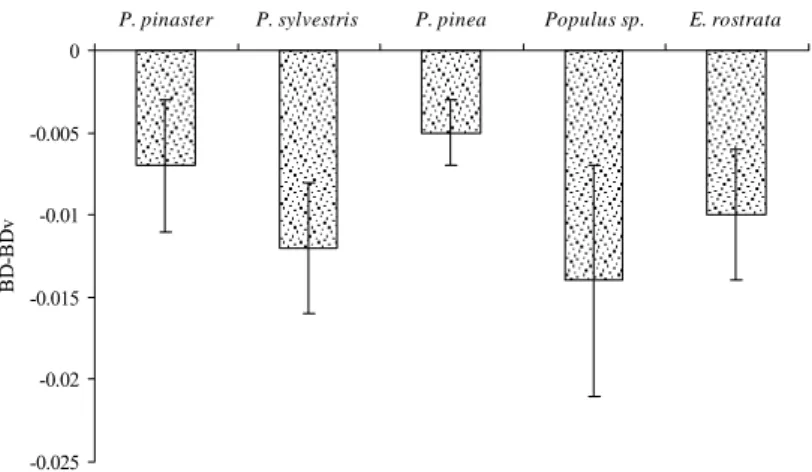
Variation between saturated volume and Green volume
Figure 2 represents, for each species, the volume difference between basic density measured if we used the green volume wood (the great wood logs come to factory with that moisture content) and the basic density if we use the saturated volume. In fact some logs result from the forest fires and they come to factory with low moisture content, some times close to the fibre saturated point (FSP).
-0.025 -0.02 -0.015 -0.01 -0.005 0
P. pinaster P. sylvestris P. pinea Populus sp. E. rostrata
BD
-BD
v
Fig.2. Wood basic density variation for two different volumes studied.
The wood basic density for the saturated wood is always higher or equivalent to measured for green wood. In fact the results must be quite the same because is not expected volume variation above the FPS. So that variation could be caused by the same logs moisture content in industry entrance is near of the fibre saturated point (FSP) and when we saturated them could be have some problems with the superficial kiln wood caused by the wood cut and the waiting time between cut and measured logs.
The results show a lower variation for P. pinea volumes, caused by that wood logs coming in the factory with higher moisture content. In opposite the Populus sp. comeing in the factory with lower moisture content so it presents a great variation. That results are very important because prove that we need to have to be very careful with the volume measured. Methods comparation to evaluation the wood Volume
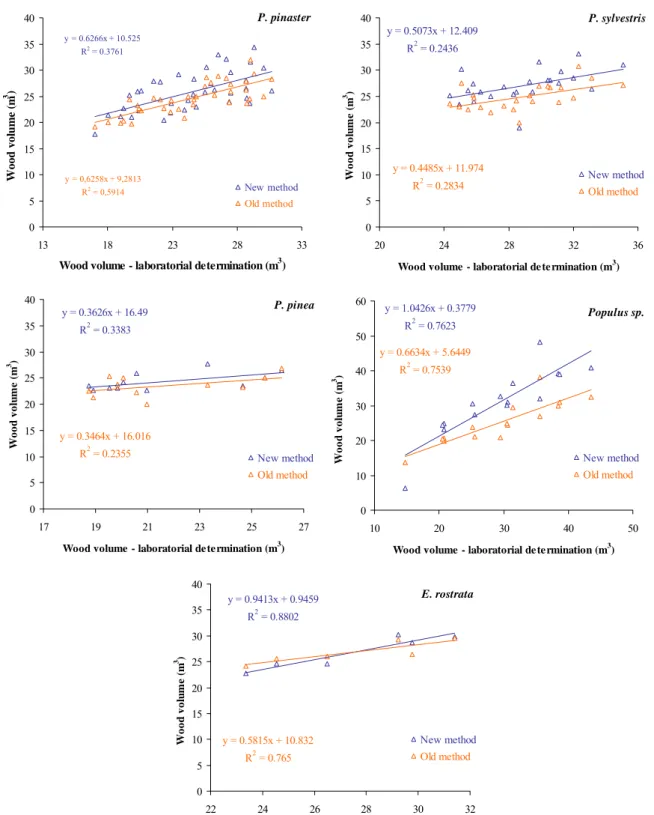
Figure 3 show the relation between the current and old volume measured in the factory with the volume measured in the laboratory for the different species studied.
Only in hardwood species we can have a good correlation between methods. For the softwood we observed a higher variability and a lower correlation between methods. However, for the softwood we observe too a great difference between the moisture content measured in the present study and that measured in the factory. Moreover, the new method
seems to be better (see slope line) because the values observed are more close to the ones measured in laboratory. y = 0.6266x + 10.525 R2 = 0.3761 y = 0,6258x + 9,2813 R2 = 0,5914 0 5 10 15 20 25 30 35 40 13 18 23 28 33
Wood volume - laboratorial determination (m3)
W o od vo lu m e ( m 3 ) . New method Old method P. pinaster y = 0.5073x + 12.409 R2 = 0.2436 y = 0.4485x + 11.974 R2 = 0.2834 0 5 10 15 20 25 30 35 40 20 24 28 32 36
Wood volume - laboratorial de te rmination (m3)
W o od vo lu me ( m 3 ) . New method Old method P. sylvestris y = 0.3626x + 16.49 R2 = 0.3383 y = 0.3464x + 16.016 R2 = 0.2355 0 5 10 15 20 25 30 35 40 17 19 21 23 25 27
Wood volume - laboratorial determination (m3)
W ood vol u m e ( m 3 ) New method Old method P. pinea y = 1.0426x + 0.3779 R2 = 0.7623 y = 0.6634x + 5.6449 R2 = 0.7539 0 10 20 30 40 50 60 10 20 30 40 50
Wood volume - laboratorial de te rmination (m3)
W oo d vol u m e ( m 3 ) . New method Old method Populus sp. y = 0.9413x + 0.9459 R2 = 0.8802 y = 0.5815x + 10.832 R2 = 0.765 0 5 10 15 20 25 30 35 40 22 24 26 28 30 32
Wood volume - laboratorial de termination (m3)
W ood vol u m e ( m 3 ) . New method Old method E. rostrata
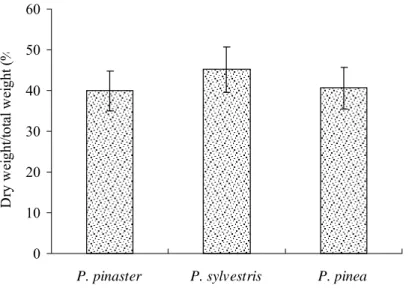
Bark contribution for the process
Figure 4 represents the percentage of wet weight log without bark in relation to the wet weight log with bark measured in each truck for the different species analysed. We can see that the percentage of wet weight for each sample group is quit the same for each truck. However, the P. sylvestris species present a higher wood yield, caused by a lower bark amount. In average each truck has 40% of raw material for manufacturing process of wood agglomerate. For that study we use only the pines species because in that case we can use for agglomerate products the barck.
0 10 20 30 40 50 60
P. pinaster P. sylvestris P. pinea
D ry w ei ght /tot al w ei ght ( %
Fig. 4 –Variation between dry weight with bark and without bark for pines species. Figure 5 represent the bark percentage for all truck come to the factory for different species.
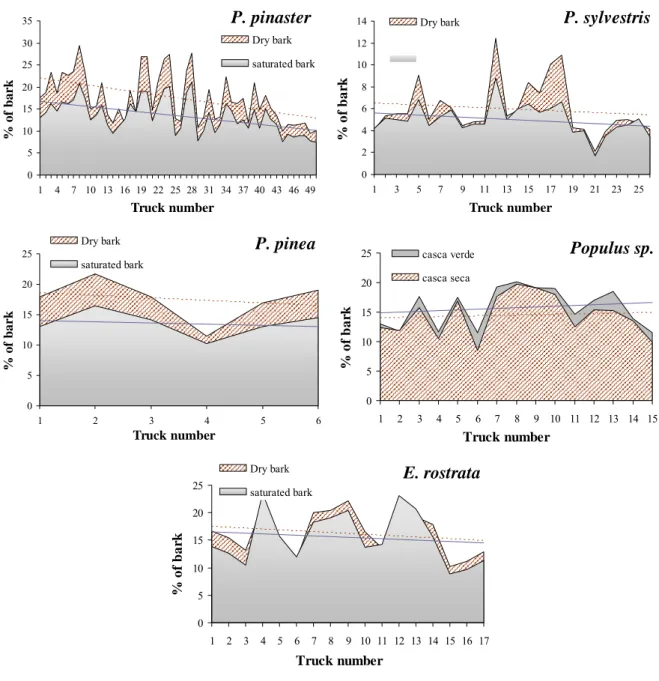
The P. pinaster e P. pinea present a higher percentage of dry bark and a higher variation for different truck coming in to the factory. The P. sylvestris presents lower bark percentage so a higher yield in the process when compared with the raw material in the entrance of the factory.
For the Populus sp. we have a different situation, in fact for that specie the wood looses water quicker than the bark. In that study we need to pay attention too to the bark loss during the transportations.
0 5 10 15 20 25 30 35 1 4 7 10 13 16 19 22 25 28 31 34 37 40 43 46 49 Truck number % of bark Dry bark saturated bark P. pinaster 0 2 4 6 8 10 12 14 1 3 5 7 9 11 13 15 17 19 21 23 25 Truck number % o f b a rk
Dry bark P. sylvestris
0 5 10 15 20 25 1 2 3 4 5 6 Truck number % o f b a rk Dry bark saturated bark P. pinea 0 5 10 15 20 25 1 2 3 4 5 6 7 8 9 10 11 12 13 14 15 Truck number % o f b a rk casca verde casca seca Populus sp. 0 5 10 15 20 25 1 2 3 4 5 6 7 8 9 10 11 12 13 14 15 16 17 Truck number % o f b a rk Dry bark saturated bark E. rostrata
Fig. 5 – Bark percentage variation for specie and for different lots of raw material com to the factory.
CONCLUSION
All of the parameter studied in that work are well correlated between them, so it is very important have a correct measure of that to well quantify the quantity raw material in entrance of the factory and pay the correct value for that raw material.
Like was expected the basic density was different for different species and for different provenances, but the factory can improve their data base with that results to have a great knowledge of the raw material in entrance of factory. However, all species present a great variability for their basic density especially when we work with clones species. For the yield
evaluation it’s very important to pay attention of the class diameter logs, because, for the same specie, to a fin log we have lower basic density caused by a higher percentage of juvenile wood.
It’s very important to decide what volume use (green or saturated) in the measurement of wood basic density specialise for some species like P. silvestrys and Populus sp.
For the methods used to measure the wood total volume in the entrance of the factory, the new method is better but it is more complicated to do, so in the future it is important with to have more data to make a conversion factor to compare two methods with the real value measured in the laboratory.
The bark is an important factor, because they it influences the weight of raw material in the entrance of factory. In fact, the bark has a great variation of moisture content and a great percentage of the total of raw material so a great influence in the final yield of wood agglomerate.
LITERATURE
AGUILERA, A.; MEAUSOONE, P.; MARTIN, P.:2000. Wood material influence in routing operations: the MDF case. Holz als Roh- und Werkstoff. 58, 4, 278-283
ESTEBAN, L.G.; CASASÚS, A.G.; ORAMAS, C.P; PALÁCIOS, P.P.: 2002. La madera y su tecnologia. Ediciones Mundi. Prensa. Madrid.
MALONEY, T.M.: 1986. Juvenile wood-Problems in composition board products. Proc. of a cooperative Technical Workshop, Juvenile Wood: What does it mean to forest management and forest products?. Forest Prod. Res. Soc.. Madison, WI., 72–74.
PANSHIN, A.J.; DEZEEUW, C.: 1980 Textbook of Wood Technology. 4th ED. McGraw-Hill Book Co., New York.
TAFISA. 2006. Estatística do consumo (m3 sc.). Factory Internal document.
UN LI SHI, J.; ZHANG, S. Y.; RIEDL, B.: 2005.Effect of juvenile wood on strength properties and dimensional stability of black spruce medium-density fiberboard panels
ZOBEL B.; BUIJITENEN J.: 1989. Wood Variation: Its Causes and Control. Springer Series in Wood Science, Berlin.
ZOBEL, B.; SPRAGUE, J.: 1998. Juvenile Wood in Forest Trees. Springer-Verlag. Berlin.
1
Escola Superior Agrária de Castelo Branco, Quinta da Senhora de Mércules, 6001-909
Castelo Branco, Portugal
2
Tradema, Grupo Tafisa, Ctra. Durgos-Potugal, Apartado 197, Valladolid – Spain.
3
Centro de Estudos Florestais, Instituto Superior de Agronomia, Universidade Técnica de
Lisboa, 1349-017 Lisboa, Portugal
4
Centro de estudos de recursos naturais, ambiente e sociedade, Bencata, 3040-316 Coimbra,