i
A new view on innovation:
Researching the usage of competitor´s resources to increase
the likelihood of adoption in the electric vehicle industry
Arie Stefan Verschoor
Dissertation written under the supervision of João Flórido
Dissertation submitted in partial fulfilment of requirements for the MSc in
Management with specialization in Strategy & Entrepreneurship, at the
ii
Abstract
The car industry is facing a lot of changes, especially when it comes to electric vehicles. Although the majority of consumers is aware of electric vehicles, personal transportation by electric vehicles is only 0.2%. Due to the nature of barriers such as global infrastructure, global exposure and variety of models it is extremely difficult for companies to single-handedly overcome these barriers. Therefore, this thesis proposes a new strategy to overcome such barriers. Once an innovation leader innovates to fast and offers products that are not being accepted due to the current market conditions, using the resources of other competitors could be an effective way to evolve the market into a state where the likelihood of consumer adoption is increased. By using an empirical study, this thesis aims to explore the impact of increased global infrastructure, increased average range and increased exposure in order to enhance the likelihood of electric vehicle adoption. These measures are all directly related to an increase in market engagement by competitors. The results of the study show that all consequences of increased market engagement by competitors lead to a higher likelihood to adopt. The effect of an innovation leader sharing knowledge could indeed have a positive effect on the available market.
iii
Sumário
A indústria automóvel está a passar por muitas mudanças, especialmente no que se refere aos veículos eléctricos.Embora a maioria dos consumidores tenha consciência da sua existência, o transporte pessoal através de veículos eléctricos representa apenas 0.2%.Devido à existência de barreiras como a infraestrutura global, a exposição global e a variedade de modelos, é extremamente difícil para cada uma das empresas isoladamente ultrapassar estas barreiras. Assim, esta tese propõe uma nova estratégia para ultrapassar essas barreiras.Quando um líder em inovação desenvolve essa inovação de uma forma demasiado rápida e oferece produtos que não são aceites devido às actuais condicionantes do mercado, a utilização dos recursos de outros concorrentes poderá ser um caminho eficiente para desenvolver o mercado até um nível em que a probabilidade de adopção por parte dos consumidores seja superior.Utilizando um estudo empírico, esta tese pretende explorar o impacto do incremento da infraestrutura global, do incremento da autonomia média e do incremento da exposição por forma a aumentar a probabilidade de adopção dos veículos eléctricos. Estas medidas estão todas directamente relacionadas com um incremento do compromisso no mercado por parte dos concorrentes.Os resultados do estudo mostram que todas as consequências de um maior compromisso no mercado por parte dos concorrentes conduzem a uma maior probabilidade de adopção. O efeito de um líder em inovação partilhar conhecimento poderia efectivamente ter um efeito positive no mercado disponivel.
iv
Acknowledgements
My time in Católica has been a life changing experience which would not have been able without the help and support of the following people.
First of all I would like to thank my supervisor João Flórido. João has provided me with extremely helpful suggestions and insights on moments where I would be stuck. After every meeting I was full of ideas again in order to continue shaping my thesis. His suggestions played a big role in the final result of this thesis and without his guidance, finishing thesis would not have been possible.
Secondly I would like to thank my parents and brothers who have supported me all along the way and stood behind every single choice that I made. Their supportive words and advises have been a big help multiple times. They have been a huge support during this long period away from home.
Lastly I would like to thank my friends who have helped me in times that I was stuck or was not able to see clearly anymore. Multiple times have they sat down with me and gave me helpful insights and suggestions which are in the end also a part of this thesis.
v
Table of Contents
Abstract ... i
Sumário ...ii
Acknowledgements ... iv
Table of Figures ... vii
Table of Tables ... viii
Glossary ... ix
Chapter 1 introduction ... 10
1.1 Background ... 10
1.2 problem statement ... 11
1.3 Aim of the research ... 11
1.4 Hypotheses ... 12
1.5 Research method ... 12
1.6 Academic and managerial relevance ... 13
1.7 Structure... 13
Chapter 2 literature review ... 14
2.1 Innovation approach ... 14 2.1.1 Closed innovation ... 14 2.1.2 Open innovation ... 15 2.2 Types of innovation ... 17 2.2.1 Sustaining innovation ... 17 2.2.2 Disruptive innovation ... 17 2.3 Consumer adoption ... 18 2.3.1 Adoption barriers ... 18 2.3.2 Adoption triggers ... 19 2.4 Socio-Technical Systems ... 22 2.4.1 Influencers of ST-system ... 22
2.4.2 Understanding the dynamics of technological transitions ... 23
2.4.3 Technological niches ... 24 2.4.4 Socio-technical regime... 25 2.4.5 Socio-technical landscape ... 25 Chapter 3 Methodology ... 27 3.1 Research approach ... 27 3.2 Method ... 27 3.3 Measures... 27
vi 4.1 Sample characterization ... 29 4.2 Hypothesis 1 ... 30 4.3 Hypothesis 2 ... 32 4.4 Hypothesis 3 ... 34 5 Discussion ... 36 5.1 Findings ... 36
5.2 Implications, limitations and further research ... 37
References ... 39
Appendix 1 Questionnaire ... 43
Appendix 2 Demographic outcomes ... 46
Appendix 2 Hypothesis 1 SPSS outcomes ... 48
Appendix 3 Hypothesis 2 SPSS outcomes ... 49
vii
Table of Figures
Figuur 1: Actors in ST-system (Geels F. W., 2004) ... 23 Figuur 2: Three layer approach (Geels F. W., 2002) ... 24 Figuur 3: Social groups (Geels F. W., 2004) ... 25
viii
Table of Tables
Table 1: H1 sign test Frequencies ... 30
Table 2: H1 sign test statistics ... 30
Table 3: H1 paired samples T-test ... 31
Table 4: H2 sign test frequencies ... 32
Table 5: H2 sign test statistics ... 32
Table 6: H2 paired sample T-test... 33
Table 7: H3 ANOVA group statistics ... 34
Table 8:Levene´s test for equality of variances ... 34
Table 9: One-way ANOVA ... 35
ix
Glossary
EV: Electric VehicleNIH-syndrome: Not-Invented-Here syndrome R&D: Research & Development
ST-System: Socio-Technical System ST-Landscape: Socio-Technical landscape
10
Chapter 1 introduction
1.1 Background
The car industry is currently experiencing changes in the original dynamics, a familiar one being the movement towards electric vehicles. Electric vehicles are a well-known concept, yet it seems the adoption of this technology by the wide market poses a problem. Currently, personal transportation by electric vehicle is only about 0.2% of the total market (Chart: Statista , 2017).
Tech-based companies are mostly dependent on their competence to innovate. The majority of these innovations are protected by multiple mechanisms. One of these mechanisms is the use of patents to deter competitors from using the same technology and thus striving to keep a competitive advantage. This strategy has been applied by organizations as a way to differentiate themselves from competition.
Nowadays competitive environments are volatile and change quickly, which forces companies to innovate at extreme rates. In some cases, innovations have such a rapid increase that the market is not ready to adopt and use new technologies technically and cultural wise. When this occurs on a cultural and infrastructural level, it is said that the socio-technical landscape is not correct for this market, meaning that for example the culture and the technological infrastructure have not yet been developed enough for consumers to adopt the new product or service (Geels F. W., 2005). In terms of electric vehicles, examples are charging station infrastructures, culture and the amount of options in models. It would be arguable that in this case, innovations should be slowed down in order to prevent costs outgrowing the gains.
An under-developed socio-technical landscape may prevent any product from being generally adopted by the market and this landscape can usually not be directly influenced by a single actor(firms), which can be a big barrier for highly innovative companies (Geels F. W., 2004). I did not like the idea that companies have to reduce their innovation rate because a market is being limited by certain barriers that are unlikely to change individually, rather I would like organizations to utilize a strategy that eliminates this bottleneck and therefore increases the development of a new market. Especially at this moment, where a lot of radical innovations are about to happen that require changes within the landscape (such as autonomous driving).
11
An innovation leader could disclose intellectual property to competitors freely, persuading them to join the market, thus increasing the global market engagement. Especially when an organization does not have the required resources to influence the socio-technical landscape, exploiting the resources of competitors can be of strategic importance. A bigger market could lead to increased sales for competitors, but also for the initiator. It is of essence to know if the consequences of an increased market engagement by competitors would lead to a higher likelihood to adopt.
1.2 problem statement
Thus, this dissertation strives to understand the relationship between decreasing the entry barrier for competitors by an innovation leader through for example the free sharing of knowledge and the likelihood of adoption for electric cars by tackling barriers on mainly the social-technical landscape level.
Hence, I defined the following problem statement:
1.3 Aim of the research
The ultimate goal of this research is to provide a new insight in the way leading innovators in the electric vehicle (EV) market can use their intellectual knowledge to increase the market size. Opposed to the traditional protection of innovations, this research aims to clarify the adoption boundaries related to a lack of resources and a new way to tackle these boundaries. Multiple researches are mainly suggesting the following main adoption barriers:
Limited variety of EV’s
A big concern about the accessibility of charging stations The charging time
The mindset, consumers are not educated enough.
(Garwood & Skippon, 2011; Cherchi, Jensen, & Mabit, 2013; Egbue & Long, 2012)
The research questions have been aimed on barriers that can be decreased by a higher number of organizations that participate in the electric vehicle market. The aim of research question one is to see if a higher amount of uniform charging stations can affect the adoption rate of Electric
Can innovation leaders in the electric car industry increase the adoption rate of electric cars by lowering the entry barriers to this new technology for competitors?
12
vehicles. Currently charging stations are different in many ways. They can be private and public, free to use or the consumer has to pay and there are different charging stations for different cars. This means that it is not the same as gas stations, where you can generally refuel at any location with a gas station available (Zach, 2015). The idea is that when an innovation leader gives away knowledge/patents, following companies could start using the same type of adapter, which could have a positive impact on the willingness to pay of possible consumers as there should be more chargers globally.
RQ1: If the charging infrastructure would be similar to the petrol refuel infrastructure in
terms of locations, will the likelihood to adoption increase?
The second research question is not only aimed towards the range, but also towards the options in models that they deem ‘good enough’. Once the ´average´ range of electric vehicles increases, the amount of options with big ranges does also, which could be tempting for consumers. The following question emerged:
RQ2: Does an increased average range for electric vehicles have an impact on the likelihood
of adoption for electric vehicles?
The third research question is developed for two reasons. First of all to find out if increased exposure would lead to an increased adoption rate. Second of all, it attempts to see if the problem is passive or active consumer resistance, as this has an impact on the way the barrier should be approached.
RQ3: Does increased exposure to electric cars have an impact on the likelihood of adoption for
electric vehicles?
1.4 Hypotheses
The former research questions lead to the following hypotheses:
H1: Developing a charging infrastructure that is similar to the current gas station infrastructure will increase the likelihood of EV adoption.
H2 An increase in average range will increase the likelihood of adoption.
H3: Increased exposure to electric vehicles will increase the likelihood of EV adoption.
1.5 Research method
Primary data will be gathered by conducting a survey to analyze the way the market reacts to certain changes in the car-industry.
13
Secondary data will be gathered through a literature review concerning the following topics: Innovation strategies, Types of innovation, Consumer adoption barriers & triggers, Socio-technical landscape.
1.6 Academic and managerial relevance
Today’s research is mainly aimed towards two classes of innovation: open and closed. Yet, there is a lack of research towards offering free intellectual property to competitors in order to shape a socio-technical landscape that has yet to be developed. In this case, an organization already developed a certain innovation and offers it, rather than collaborating with other companies. Hence, the emphasis of this study lies on developing the social-technical landscape and thus the market by using the resources of competitors, rather than a specific innovation. Industry leaders in high-competitive industries generally protect their innovations, thus this is a different strategy aimed at an increase in the adoption rate and thus the total demand for an innovation.
This dissertation shall provide new insights concerning market-changing innovations and ways to tackle the hurdles that significant industry changes impose.
1.7 Structure
The first part of this dissertation consists out of the literature review. The literature review provides knowledge concerning general adoption barriers and triggers to understand what kind of measures would be needed to increase the adoption rate. It then mentions open innovation and closed innovation in order to make the difference clear and how this strategy uses advantages from both types. Furthermore sustaining innovation and disruptive innovation are mentioned as this information is necessary to come up with a right approach. The literature review finally closes by introducing Socio-technical systems and everything that influences it. The third chapter explains the methodology that has been chosen in terms of data analysis in order to answer the research questions.
Chapter 4 describes the statistical results of the analysis and answers the hypotheses.
Lastly this dissertation ends with a discussion that describes the results, the meaning of those results and also limitations that this dissertations has that might need further research.
14
Chapter 2 literature review
2.1 Innovation approach
So far two approaches to innovation have been known, closed and open innovation (Asllani & Lari, 2011). Although especially open innovation has similarities to the proposed strategy, it is of essence to know the differences between the two and the extra step that this new strategy adds.
2.1.1 Closed innovation
The closed innovation view implies that companies should be in full control of the entire development cycle including research, development, production, marketing, servicing, financing, distribution and supporting (Sharad K. Maheshwari, 2011). Organizations using this concept contain their entire process within their own development and research departments in order to stay in control of their innovation process (Sharad K. Maheshwari, 2011)
2.1.1.1 Disadvantages closed innovation
The isolation of the R&D process can have a negative impact on the commercialization of products due to the fact that there is a lack of market resources (Zhou & Wu, 2010). Furthermore, the internal technological strength that closed innovation positively influences could reach a wall at a certain level (Zhou & Wu, 2010). This is caused by the difficulty for an organization to build new knowledge once organizational routines have been formed, which can be hard to reconfigure (Xu, Wu, & Cavusgil, 2013).
2.1.1.2 Advantages closed innovation
While exploiting internal development, organizations can reduce the likelihood of errors by using their own resources and knowledge. Furthermore, it enhances the innovation performance and R&D efforts get more predictable (Ahuja & Katila, 2001).
This strategy also allows organizations to exploit results of their R&D efforts directly, thus they can be the first one to enter a market with a high possibility to win. (Chandler, 1990). It has also been found that organizations with a tendency to successfully push innovative products into the markets exploit the closed innovation strategy (Almirall & Casadesus-Masanell, 2010). Furthermore, once the technological complexity of an innovation is high, products can be developed more efficiently and faster if the company possesses all the resources and capabilities. (Almirall & Casadesus-Masanell, 2010)
15
2.1.2 Open innovation
Open innovation basically implies that an organization uses knowledge from an external source to increase the profitability (Garriga, von Krogh, & Spaeth, 2013).
In open innovation, research and development are seen as an open system, furthermore it assumes that both internal and external ideas should be used as these offer the opportunity to advance technology (Chesbrough, 2003).
Organizations that use the open innovation approach have a flow of products and ideas that freely move in and out of the organization. They come from and move towards partners and possibly even competitors, which can be a risky business (Chesbrough, 2003, p. 13).
2.1.2.1Disadvantages of open innovation
Research has identified three major risks in the area of open innovation: The Arrow information paradox, the contamination risk and the Not Invented Here syndrome. (Asllani & Lari, 2011) The Arrow information paradox
Arrow mentions an information paradox (Arrow, 1970). When a purchaser has the intention to acquire a new technology, a deep understanding of this technology is necessary in order to make a proper decision. Once this purchaser has the knowledge of detailed specifics and capabilities, the seller has in essence transferred the information without any monetary compensation. This could lead to a partnership that benefits one of the parties instead of both.
The contamination risk
Furthermore, Chesbrough (2006) identified the contamination risk. This usually occurs when smaller organizations approach bigger organizations to collaborate in the development of a new technology or service. It is common that inventors or entrepreneurs approach organizations to license their products/services or to have them completely acquired. Once the approached organization lacks sympathy, it could happen that they simply copy the idea without infringing on any patents by using their own capabilities. Once this happens, the approached organization owns a similar technology and more resources to successfully implement in into the market, overshadowing the initial innovator.
16
Not Invented Here Syndrome
The Not Invented Here (NIH) syndrome occurs when a certain technology is not accepted in an organization due to the fact it has not been developed internally (Nash, 2004). In organizational terms, NIH implies the tendency to disregard a suitable but externally developed idea or technology because internal developments are being relied on more. Although this behavior is mainly seen as xenophobia, Chesbrough (2006) states there is a rational component explaining the tendency of employees to reject external technologies and describes it as followed.
‘’Externally sourced technologies, coming from a much wider variety of sources about which much less is known … may greatly increase the perceived risk to the project. So an externally sourced technology may have the same average estimated time to complete, but it may have a wider range or variation in that estimated time relative to an internally created technology’’ Organizations expose themselves to multiple types of risk when engaging in this strategy, they lose a certain form of control concerning their operational process as the entire process is no longer in their hands when they decide to buy or license from other organizations. Higher risk also develops when companies offer their internal ideas externally in terms of less control (Chesbrough, 2003, p. 13).
2.1.2.2 Advantages open innovation
First of all, open innovation grants organizations the possibility to exploit knowledge of other companies (Hung & Tang, 2008). This is especially useful for companies operating in technological complex areas where the knowledge is divided over several companies. When none of the companies in the same industry possesses all the required knowledge, techniques and skills, the open innovation strategy can bundle the knowledge of organizations in order to overcome innovation hurdles (Hung & Tang, 2008).
On the other hand, Almirall & Casadesus-Masanell (2010) argue that it is usually not so simple to state open innovation is better than closed, as it should be a mixture of both. Organizations can also reduce cost and risk uncertainties as it is split over the different partners (Das & Teng, 2000). When utilizing an open innovation strategy, the chosen partners usually fall outside of the company’s specialization, while the core products are being developed internally (Ciravegna & Maielli, 2011). By doing so, a broad variety of technological capabilities that is not available in-house can be accessed (Chesbrough, 2003).
17
Finally, it has been argued that the innovativeness of an organization is depending on the increase of the knowledge base (Cockburn & Henderson, 1996). Open innovation increases the knowledge base by gathering external knowledge (Cohen & Levinthal, 1990).
It is proven that open innovation may increase the revenue of research and development by leveraging the capabilities of other partner firms. Simultaneously, such partnerships can pose significant hazards if they are poorly designed or implemented (Chesbrough & Schwartz, 2007) Thus, the greatest risk lies in the structure of the deal that has been constructed, not in the actual sharing of an idea or invention (Rigby & Zook, 2002).
2.2 Types of innovation
A separation has been made between two different types of innovation, these are sustaining innovation and disruptive innovation (Bower & Christensen, 1995).
2.2.1 Sustaining innovation
Sustaining innovation implies that an organization improves aspects of a product or service that is already known to be valued by a consumer. One could think of increasing the amount of information that can be stored on one single disk drive by replacing thin-film components (Bower & Christensen, 1995).
2.2.2 Disruptive innovation
On the other side of the spectrum there is disruptive innovation, which offers new attributes that can be valued by consumers. One or two attributes that are valued by consumers are likely to extremely underperform opposed to the industry standard (Bower & Christensen, 1995). It is important to note that especially disruptive technologies can have a tendency to require significant infrastructural changes (Lange, Boivie, & Henderson, 2009).
Building on the research of Bower & Christensen, a new definition has been formed that specifies the characteristics for a disruptive innovation: “an innovation with radical functionality, discontinuous technical standards, and/or new forms of ownership that redefine marketplace expectations” (Nagy, Schuessler, & Dubinsky, 2016). This definition is more in line with the current subject, hence this will be the definition referred to when speaking about disruptive innovation. Owning an electrical car has radical changes in terms of ownership and technical standards. This is also in line with the earlier mentioned infrastructural changes that a disruptive innovation can cause. (Lange, Boivie, & Henderson, 2009)
18
2.3 Consumer adoption
Adoption is defined by Frambach and Schillewaert (2002) as an individual’s decision to make full use of an innovation.
While researching adoption behavior, it is just as important to understand why consumers do not adopt a technology as why they do adopt a technology. (Foxall & Szmigin, 1998).
2.3.1 Adoption barriers
Ram and Sheth (1989, p. 6) define consumer resistance as ‘the resistance offered by consumers to an innovation, either because it poses potential changes from a satisfactory status quo or because it conflicts with their belief structure’. Furthermore, the literature separates passive consumer resistance from active consumer resistance (Talke & Heidenreich, 2014).
When a consumer refuses a new innovation prior to the evaluation of a new product, we speak of passive consumer resistance. This mainly occurs due to a general inclination to resist change or when the status quo is already satisfying the consumers. (Talke & Heidenreich, 2014) In order to overcome passive consumer resistance, it has been shown that mainly two measures can be used in order to overcome this hurdle: Mental stimulation (such as increased exposure) and benefit comparison, by showing how much better the new innovation is opposed to the current situation (Heidenreich & Kraemer, 2015).
Furthermore, there is active consumer resistance, which happens when an innovation is being resisted after an unfavorable evaluation. This implies that the cause can be tracked to innovation-specific factors, which can be classified into psychological and functional barriers. (T, S, & Laukkanen, 2009; Claudy, Garcia, & O'driscoll, 2015)
2.3.1.1 Psychological barriers
Psychological barriers imply that the innovation causes a conflict with prior beliefs. These can be classified in image barriers (The innovation is perceived as negative due to the origin or class) but also tradition and norm barriers (norms and values of society are being violated by the innovation). Social risk concerns the impact of direct peers, tradition and norm barriers are affected by the wider society. (Ram & Sheth, 1989; Kleijnen, Lee, & Wetzels, 2009)
2.3.1.2 Functional barriers
The following definition has been given to describe functional barriers: ‘if consumers perceive significant changes from adopting the innovation’ (Ram & Sheth, 1989). Functional barriers can consist of (1) usage barriers, (2) value barriers and (3) risk barriers. Usage barriers imply
19
that innovations are not compatible with the current habits, workflows and practices. Value barriers occur when a performance-to-price ratio is not being offered by the innovation. Finally, risk barriers are distinguished into physical risk (possible harm to an individual or belongings), economic risk (uncertainty about the cost of the innovation), functional risk (Unexpected functionality) and social risk (The social circles of a consumer start ridiculing him/her).
2.3.1.4 Status Quo
Multiple researches indicate that although the notion of adoption barriers increased the area of adoption research in general, these are not the only variables that explain consumer resistance. As mentioned before, an important aspect is that consumers might favor the status quo unless a substantial motive for change is granted (Gal, 2006; Kahneman, Knetsch, & Thaler, 1991). Thus, a consumer can remain in a state of non-adoption even without being exposed to certain adoption barriers until they are incentivized by an adoption trigger. (Kahneman, Knetsch, & Thaler, 1991)
2.3.2 Adoption triggers
Electric vehicles are well known throughout the market, nevertheless as earlier concluded, the adoption rate is extremely low. There are specific triggers that explain the transition from non-adopters to non-adopters (Gurtner, Hietschold, & R, 2017). The following definition for adoption triggers has been identified: ‘events that motivate, support or enable an individual to overcome consumer resistance to adopt an innovation by inducing the transition between non-adoption and adoption’ (Gurtner, Hietschold, & R, 2017). To explain the state-transition difference Gurtner, Hietschold and Reinhardt (2017) use the example of eating an apple. The general tendency for a consumer to eat an apple is dependent on certain factors such as personal preferences, taste and health consciousness. Nonetheless, the presence of triggers such as access to the kitchen and hunger will determine whether a consumer eventually eats the apple. Three categories for adoption triggers that induce transition have been defined (Reinhardt, Gurtner, & Hietschold, 2017)
1)
Increasing innovation attraction.
This implies changing the price or performance of a product/service. The research has shown that both adopters and non-adopters are finding these to be triggers. By reducing price, the innovation attraction can increase. A change in performance can mean a wider choice in variety, the core of the product or be related to additional services and product features in order to increase the perceived utility by consumers (Reinhardt, Gurtner, & Hietschold, 2017).
20
Furthermore, the relative advantage of a new innovation can be highlighted by changing performance. This supports the conclusion of another research that states that especially in the EV-industry, pricing and performance are dominant triggers to innovation (Egbue & Long, 2012).
2)
Reducing barriers.
Knowledge acquisition by consumers has been indicated to be one of the main triggers to adoption, as uncertainty holds consumers back from adapting (Gurtner, Hietschold, & R, 2017). The acquisition of knowledge can lead to a better understanding of the technology and a reduction of uncertainty. This builds on another study that mentions how the lack of knowledge is a common barrier for potential adopters (Diamond, 2009). The acquisition of knowledge can
lead to a better understanding of the technology and a reduction of uncertainty, which also tackles the risk barrier connected to a lack of knowledge (Diamond, 2009). There are three different types of knowledge acquisition (Reinhardt, Gurtner, & Hietschold, 2017):
Consumers can gain knowledge by trying out an innovation for a given time. This allows the consumers to postpone the time of full adoption and gain some knowledge while doing so. (Gurtner, Hietschold, & R, 2017)
Furthermore, there is the possibility to gather information through a secondary source, this implies that the consumer does not have a direct contact with the innovation. Any other relevant knowledge can be gathered by for example internet research. (Gurtner, Hietschold, & R, 2017).
Finally, the direct purchase and usage of a product out of curiosity, thus gathering information concerning the innovation, gaining knowledge, reducing barriers and thus start the transition from non-adoption to adoption (Gurtner, Hietschold, & R, 2017). Knowledge has the following uses in this context: Assessing risks of the innovation, assessing barriers of the innovation and it serves to reduce risk-related barriers. A strategy that revolves around mental simulation can guide a consumer in the understanding of the usage and function of a certain innovation, thus granting the opportunity to reduce barriers related to functional risks and usage patterns (Heidenreich & Kraemer, 2015).
Risk barriers have been known to be a significant barrier to adoption (Diamond, 2009). This implies that it is of high importance to help consumers on the matter of acquiring knowledge during the innovation diffusion process.
3)
21
This implies that a change in the social system can lead to eventual adoption, these are externally induced adoption triggers in the forms of changes in substitutes, a social system push and a change in the personal circumstances. (Reinhardt, Gurtner, & Hietschold, 2017).
Changes in substitutes can occur when the existing alternatives increase the level of attraction for the innovation. It is also possible that a consumer has to replace the product that is in use, the more innovative product might seem more favorable as it has a bigger relative advantage. It has been found that one of the most critical drivers for adoption has been relative advantage. (Frambach & Schillewaert, 2002) The general relative advantage does not only change once the innovation changes, it will also change when existing substitutes become less beneficial. This is consistent with other findings, which show that an increase in gas prices has an effect on the consumer behavior when it comes to buying EV’s (van Bree, Verbong, & Kramer, 2010). This shows that consumers show behavior such as anchoring when it comes to decision making (Tversky & Kahneman, 1974).
Social system push
A social system push can be caused when an innovation diffuses to a level where it decreases the perceived uncertainty for other consumers. Once an innovation is being adopted by more people, this indicates the importance of it, which stimulates other consumers to mimic the consumers already using the innovation (Frambach & Schillewaert, 2002). Consumers in general have the tendency to base their adoption decisions on the environment surrounding them. This is in line with multiple diffusion models that state there is a higher chance of adoption once there is a higher amount of adopters already in the system. (Watts & Dodds, 2007)
Changes in personal circumstances
Finally there is changes in personal circumstances. It can occur that an innovation is related to work, which makes them also penetrate in the private sector. Furthermore, Circumstances as location and price can change, which could also move a non-adopter to an adopter position (Reinhardt, Gurtner, & Hietschold, 2017). An example here would be the urge of a consumer to share pictures with people from around the world. This gave cloud services the possibility to develop as a tool for storage tasks, instead of the initial sharing of pictures (Reinhardt, Gurtner, & Hietschold, 2017). Changes in personal circumstances cause the status quo satisfaction to decrease in such ways that the current alternative is not sufficient any longer (Heidenreich & Handrich, 2015).
22
2.4 Socio-Technical Systems
The adoption of any technology is depending on the Socio-Technical System (ST-System) that it has to match with. (Geels F. W., 2004). An ST-system consists out of everything related to the production, diffusion and use of a certain technology, which translate to all the aspects that allow an innovation to be successfully accepted or not (Geels F. W., 2004). ST-systems can be changed by groups such as competitors (by strategic moves) or between groups (public authority and an industry). An example here would be a government that regulates a new technology (Geels F. W., 2004)
2.4.1 Influencers of ST-system
2.4.1.1 Sets of rules
Three sets of rules have been distinguished which stabilize ST-systems (Geels F. W., 2004): Cognitive rules:
Due to cognitive routines engineers and designers will aim for certain directions instead of others (Dosi, 1982). Once actors such as firms are convinced that the existing regime offers the possibility to solve problems, radical innovations will be avoided and following the existing path is preferred. Cognitive rules of great impact are shared expectations and belief systems towards the future (Dosi, 1982).
Regulative rules:
Furthermore there are legally binding contracts that cause restrictions in terms of the moves companies can make, which leads to stability (Walker, 2000). Once something is legally not allowed no changes can be expected on that area.
Normative rules:
Proper behavior is a different aspect of stability. Proper behavior is defined by certain mutual expectations and role perceptions. In multiple cases, certain issues are avoided to speak about because this is not deemed as proper behavior (Verheul, 2002).
2.4.1.2 Actors and organizations
Actors and organizations also play an important role in the stabilization of the ST-system as they form interdependent networks which are dependent on one another. These networks create a form of trust throughout time, the relationships that have formed over time with buyers, sellers and financial backers cause a resistance to major changes (Tushman & Romanelli, 1985).
23
2.4.1.3 Artefacts and material networks
The material networks and artefacts in ST-systems have a high difficulty in terms of changing them. Material structures and infrastructures can be so deeply embedded into society that single actors can not have a big impact on them (Walker, 2000).
Figure 1 shows what aspects play a role in ST-systems. These aspects play a role in the adoption of technologies.
Figuur 1: Actors in ST-system (Geels F. W., 2004)
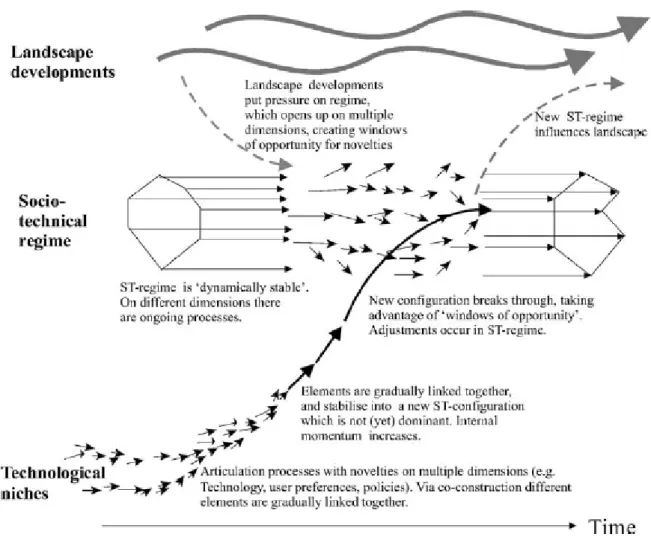
2.4.2 Understanding the dynamics of technological transitions
To understand when innovations are accepted and how they are influenced, a model has been created to identify path and influencers of innovations to show how they can transform the socio-technical system, thus being accepted by the market (Geels F. W., 2004). Figure 2 describes three layers that impact the ST-systems, in order to successfully place an innovation in the market. (Geels F. W., 2002). While going through this model, the focus lies on radical innovations to stay in line with the topic of electric vehicles.
24
Figuur 2: Three layer approach (Geels F. W., 2002)
2.4.3 Technological niches
Starting at the bottom, at the first level we find Technological niches. Radical innovations typically emerge out of technological niches or small market niches that are defined by high-performance selection criteria (Levinthal, 1998). Technological niches generally started as experimental project that is being influenced by multiple actors such as public authorities, users and producers. Experiments with electric vehicles are a perfect example of a technical niche (Geels F. W., 2004). Radical innovations have the tendency to have a low performance in their early stage, which is why instances such as governments occasionally protect them with measures such as subsidies. (Geels F. W., 2004). By doing so, the innovations can develop even though they have not been accepted by the bigger market yet. The reason that governments are willing to invest in these niches is based on the possible benefits that might occur in the future (Hoogma, Kemp, Schot, & Truffer, 2002).
25 2.4.4 Socio-technical regime
The social-technical regime has been defined as ‘’deepstructure or grammar of ST-systems, and is carried by the social groups (Geels F. W., 2004).’’ The social groups have a wide variation, which can be found in figure 3.
Figuur 3: Social groups (Geels F. W., 2004)
Each group has it’s own rules, features and regimes which also play a part in determining what type of technologies would be accepted in the ST-system (Geels F. W., 2004). There are many complications as the regime usually is a stable environment that has to be shaken before a niche can enter. A phenomenon that happens frequently is that the niches have a mismatch with the current socio-technical regime, which makes adoption and acceptance a difficult thing to achieve (Egbue & Long, 2012). The integration of new technologies and routines also implies adjustments and learning. This is referred to as the ‘taming’ of new technologies. After these technologies are tamed they can fit in concrete application contexts and routines which means they are now part of the socio-technical regime (Geels F. W., 2004)
2.4.5 Socio-technical landscape
The socio-technical landscape consists out of culture and material matters such as factories, highways, material and spatial arrangements of cities, and electrical infrastructures. The socio-technical landscape is also a big influencer on the socio-socio-technical system and is different in the way that they can usually not be directly influenced by certain actors (Burns & Flam, 1987). Matters such as shared cultural beliefs and material environments and climate are extremely
26
difficult to change (Geels F. W., 2004). Once the socio-technical landscape changes, there is a possibility that the socio-technical regime will internally restructure as well, creating an opening for innovations (Burns & Flam, 1987). One could think of an infrastructural change, but also changes ideologies and values are causes for the landscape to change. An example that happens as we speak is climate change, which is affecting the transport and energy sectors as well as public policies (Geels F. W., 2004).
Research tells us that at both the social and technical aspects of the landscape, there are certain barriers (Diamond, 2009).
2.6.3.1 Social barriers
First of all, social barriers in terms of earlier mentioned shared cultural beliefs, ideologies and values. A common barrier is the lack of knowledge about electric vehicles as consumers do not get exposed to them enough at the moment, which also affects the low risk tolerance of consumers and prevents electric vehicles from being embedded in the culture. (Diamond, 2009). As stated before, this imposes a big problem as one of the biggest reasons for adoption is knowledge acquisition (Reinhardt, Gurtner, & Hietschold, 2017). Consumers are not sure that the electric vehicles are a better option and have a high level of uncertainty due to a lack of education about them (Egbue & Long, 2012). A part of the consumers are even uncertain if electric vehicles are better for the environment than internal combustion engines (Egbue & Long, 2012), which is a big disadvantage for the acceptance as environmental awareness is a very important aspect to consumer choices. Ways to overcome this uncertainty are increased exposure, higher investments in the market, a better infrastructure and more education (Egbue & Long, 2012).
2.6.3.2 Technological barriers
Technological barriers consist out of material environments such as infrastructures, these can be difficult barriers to overcome especially when it comes to radical innovations such as the electric vehicle. Technologically, there are two major implications when it comes to the acceptance of electric vehicles (Egbue & Long, 2012). First of all, the current charging station infrastructure is limited. Not every charging station charges as fast as the other one, not all charging stations are free, but the biggest issue is that different types of cars need different types of charging stations which creates an inconvenience opposed to internal combustion cars and one actor creating a global uniform infrastructure is basically impossible due to limited resources. (Zach, 2015). Lack of standardization makes acceptance difficult. Furthermore, the limited amount of electric vehicles with an acceptable range in the electric vehicles are also a barrier to widespread adoption (Egbue & Long, 2012).
27
Chapter 3 Methodology
3.1 Research approach
Primary data has been gathered by developing a questionnaire in order to make a quantitative analysis. The questionnaire will be self-administered to reduce a bias by the interviewer and to reach a sufficient amount of participants.
The participants have been asked to answer multiple questions that indicate what type of change would increase the likelihood of electric vehicle adoption. To avoid biased answers, participants without a driver’s license are being excluded from the questionnaire, as they are not able to give an opinion that is backed up by driving experience. To relate the adoption rate to knowledge disclosure, the questions are all impacted by the entrance of more competitors. For example: More competitors would lead to more charging stations. If the questionnaire indicates a positive relationship between the amount of uniform charging stations and the adoption rate, knowledge disclosure on that area would be beneficial.
The data has been acquired by spreading the questionnaire through my personal network using digital social media. Furthermore, I exploited the networks of some of my direct contacts in order to increase the amount of responses.
3.2 Method
After the participants are introduced to the topic, non-drivers are being excluded by asking if the participant has a driver’s license. Also electric car owners are being excluded as this research solely focuses on the effects of the adoption rate, someone that is already an adopter would cause a bias.
First the general willingness to buy an EV will be checked, the follow up questions focus on increasing adoption rate through: Number of uniform charging stations, average range, variety in models and the effect of increased exposure. By testing these aspects that are all related to an increase in the amount of competitors, it is possible to test the effect knowledge disclosure could have.
3.3 Measures
The aim of the questionnaire is being explained to the participants, after this they start answering the questions. The Hypotheses will be tested by using dependent and independent T-tests. Creating a control group has been taken into consideration but as there are no different points in time within the measures, it is unlikely that there would be an external effect that would compromise the result. For the hypotheses concerning creating a global infrastructure
28
and range the dependent test will be executed. To see the effect of increased exposure in terms of driving an EV, an independent T-test will be executed to measure the results.
The first two results (infrastructure and increased range) are being generated by using a 5-point-likert scale. The last one by asking if the participant has ever driven an EV before. I will work with inferential data in order to make a thorough analysis of the acquired data.
29
Chapter 4 Result analysis
4.1 Sample characterization
To summarize the attributes of the sample, a descriptive analysis was run to check for equality amongst the three different demographical characteristics.
In total 196 Participants participated in the questionnaire, but this had to be reduced to 149. One reason was that a certain amount did not finish the entire questionnaire, leading to missing value. The respondents that already have an electric vehicle are also excluded as this research is solely interested in increasing the adoption rate of consumers that don´t have one yet. Not having a driver´s license also led to exclusion of the final data as these people have no experience driving a car and should be less capable of making reasonable trade-offs.
The entire sample age range varied from 20-58 years old. The majority of the participants were between 20-24 years old (42,3%) and 25-34 years old(27,6%) which means that 69,9% consists out of millennials. When looking at gender, there is a fairly equal distribution between men and women as 56,4% of the participants is a man and 43,6% is a woman. In terms of occupation: 43,6% is currently studying, 51% is employed, 4% is unemployed and 1,3% is currently retired. For the more specific graphics, see appendix 4
30
4.2 Hypothesis 1
Developing a charging infrastructure that is similar to the current gas station infrastructure will increase the likelihood of EV adoption.
In order to analyze the data and test the hypotheses, three different types of tests have been used. To test hypothesis one where I want to see the effect of an advanced charging infrastructure on the likelihood of adoption, two tests have been used to make the test robust in terms of reliability. Reducing adoption barriers is one of the mentioned triggers (Gurtner, Hietschold, & R, 2017), which is clearly the case for this example. First of all a sign-test has been conducted to indicate if there is a difference in the median. A sign test can be used to indicate a difference in median between different groups. In this case the first group shows how likely it is that participants would buy an electric car right now. This has been done by using a Likert scale to research the likelihood of adoption (1=very unlikely, 5= very likely). The H0 of this test would be: The median is equal. The second group is the second condition in which participants would be able to charge their car at every gas station. The sign test provided the following results:
Tabel 1: H1 sign test Frequencies
Differences n
Dependent variable Negative Differencesa 11
Likelyhood to adopt now -Likelyhood to adopt with advanced charging infrastructure
Positive Differencesb 88
Tiesc 50
Total 149
While analyzing the frequency table, it shows that in 11 cases the median was lower when participants were presented with the new scenario, being less likely to adopt an electric car than without global electric infrastructure. In 50 cases the median did not change, meaning that those participants did not change in likelihood to adopt. In 88 of the cases we observe that participants were more likely to adopt electric vehicles.
By looking at the frequency table 1, it is obvious that the output of the test tends to be positive (with 80 results being positive).
Tabel 2: H1 sign test statistics
Differences
Z -7,638
P-value ,000
The test statistics in table 2 show a high statistical significance as (P<0.05) and it can be concluded that there is a statistical difference in the median.
31
This measure does not give us complete certainty that there is a significant increase, but gives us an indication that there might be one.
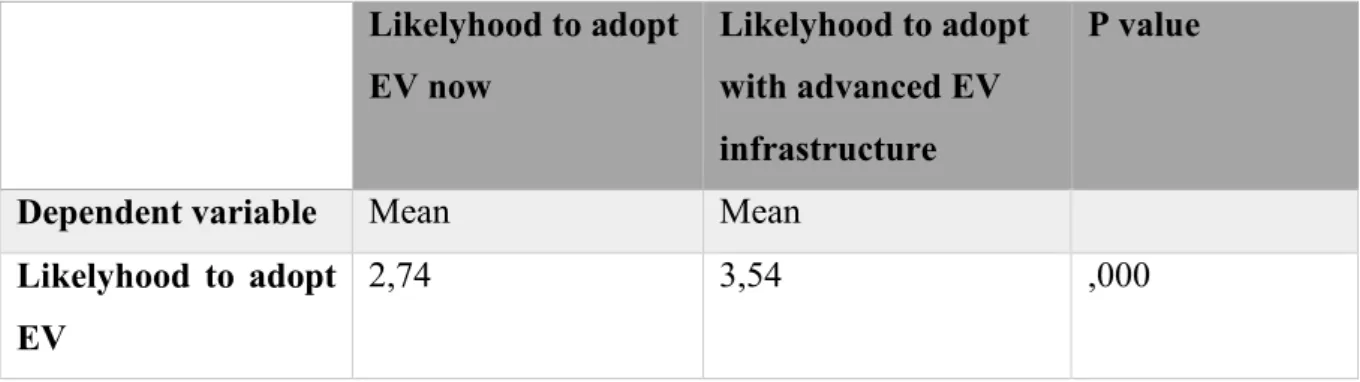
To test the effect that this new infrastructure would have on the mean of our dependent variable, a paired samples T-test has been performed. This has been done by using a Likert scale to research the likelihood of adoption (1=very unlikely, 5= very likely). A paired samples T-test can be used to see the difference in one group, when exposed to different conditions. In this case one condition would be how likely a group is to adopt now. The other condition is how likely the group would be to buy an electric vehicle if they could charge their car in every gas station within 20 minutes. It has to be noted that a T-test can be less robust due to the fact that within groups, people could change as time passes by because of multiple factors. This could imply that the noticed change is because of something else than due to the new condition. In this case, the participants have not been changed due to time as they were asked to answer both questions immediately, this increases the robustness of the T-test and the results are highly likely to be due to the new set condition.
Tabel 3: H1 paired samples T-test
Likelyhood to adopt EV now Likelyhood to adopt with advanced EV infrastructure P value
Dependent variable Mean Mean
Likelyhood to adopt EV
2,74 3,54 ,000
Looking at the T-test values in table 3, it is clear that there is a significant statistical effect when participants are subjected to the new condition: advanced charging infrastructure. It can be seen that (P<0.05), meaning that the new condition provides a significant change in the mean when it comes to adopting the car. The H0 of can be rejected and as the mean number increases with an advanced charging infrastructure, we can conclude that this change would increase the likelihood of adoption. This is in line with the earlier mentioned literature when it comes to adoption triggers. It was mentioned how an increase in performance such as additional services and product service can move consumers to adopt an innovation (Reinhardt, Gurtner, & Hietschold, 2017). This new condition would be an improvement to the whole electric vehicle experience which tackles the usage barrier that is related to active consumer resistance (Ram & Sheth, 1989). For the specific results of SPSS, see appendix 2.
32
4.3 Hypothesis 2
H2 An increase in average range will increase the likelihood of adoption.
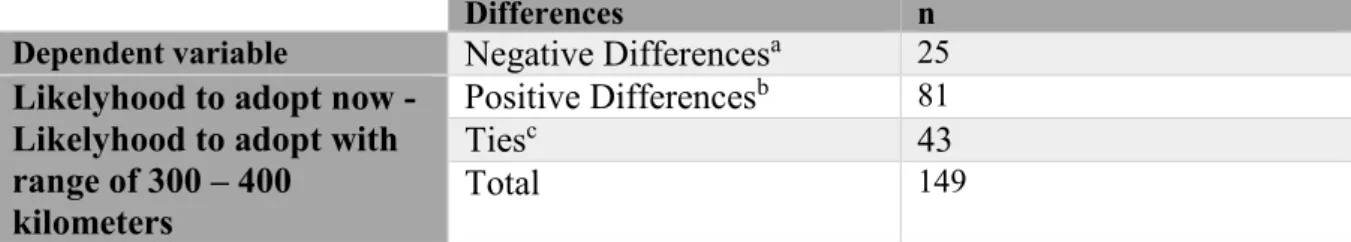
For the second hypothesis, the same method is being used in order to research if there is a statistical difference between the different scenario´s. The first condition is the likelihood to buy now, the second condition is the likelihood to buy when electric cars have an average range of 300-400 kilometers. The sign test provided the following results:
Tabel 4: H2 sign test frequencies
Differences n
Dependent variable Negative Differencesa 25
Likelyhood to adopt now -Likelyhood to adopt with range of 300 – 400
kilometers
Positive Differencesb 81
Tiesc 43
Total 149
While analyzing the frequency table 4, it shows that in 25 cases the median was lower when participants were presented with the new scenario, being less likely to adopt an electric car than without global electric infrastructure. In 43 cases the median did not change, meaning that those participants did not change in likelihood to adopt. In 81 of the cases we observe that participants were more likely to adopt electric vehicles.
By looking at the frequency table, it is obvious that the output of the test tends to be positive (with 81 results being positive).
Tabel 5: H2 sign test statistics
Differences
Z -5,342
P-value ,000
The test statistics in table 5 shows a high statistical significance as (P<0.05) and it can be concluded that there is a statistical difference in the median.
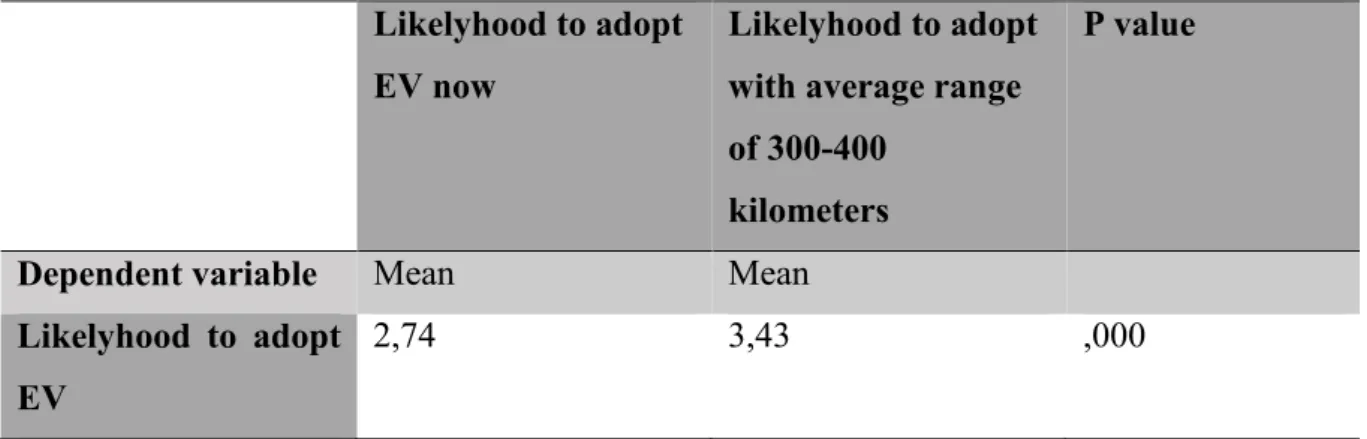
Once again, a paired sample T-test has been performed to see if there is also a statistical significant difference in the means. In this case one condition would be how likely a group is to adopt now. The other condition is how likely the group would be to buy an electric vehicle once the average range is around 300-400 kilometers.
33
Tabel 6: H2 paired sample T-test
Likelyhood to adopt EV now
Likelyhood to adopt with average range of 300-400
kilometers
P value
Dependent variable Mean Mean
Likelyhood to adopt EV
2,74 3,43 ,000
Looking at the T-test P value in table 6, it is clear that there is a significant statistical effect when participants are subjected to the new condition: advanced charging infrastructure. It can be seen that (P<0.05), meaning that the new condition provides a statistically significant change in the mean when it comes to adopting the car. H0 can be rejected and as the mean number increases when the average range would be 300-400, we can conclude that this change would increase the likelihood of adoption. Again, the trigger ‘’increase performance’’ would have a positive effect on increasing the adoption rate of this innovation (Reinhardt, Gurtner, & Hietschold, 2017). For the specific results of SPSS, see appendix 3.
34
4.4 Hypothesis 3
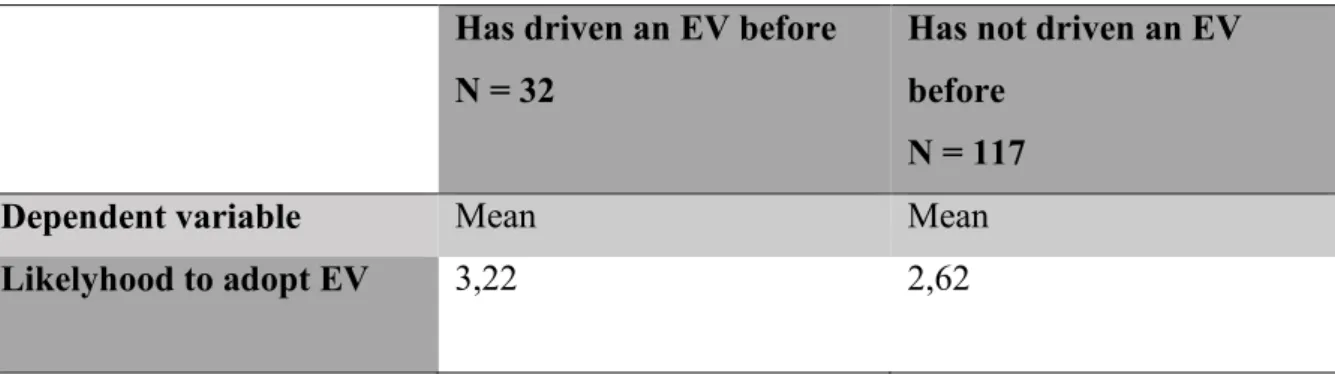
H3: Increased exposure to electric vehicles will increase the likelihood of EV adoption.
The third Hypothesis tests if people who have driven an EV before are more likely to buy an electric car opposed to people that have not driven it before. This has been done to see if increased exposure to EV´s will lead to increased adoption as stated in the literature review (Heidenreich & Handrich, 2015). It will also indicate active or passive consumer resistance, which require different approaches to overcome. To test the third hypothesis, a one-way ANOVA and Welch´s test has been performed. The One-way ANOVA can be utilized to research if there is a statistically significant difference between the means of two or more independent groups, in this case one group that has driven an EV before and one group that hasn’t. The reason for this choice is that the groups have significant unequal sample sizes, the One-way ANOVA and Welch’s test has been chosen as this is robust in the case of unequal sample sizes. The Welch´s test increases the test power for samples with unequal sample sizes. Also for this test a Likert scale has been used (1=very unlikely, 5= very likely).
Tabel 7: H3 ANOVA group statistics
Has driven an EV before N = 32
Has not driven an EV before
N = 117
Dependent variable Mean Mean
Likelyhood to adopt EV 3,22 2,62
There have been 32 people who have driven an EV before, while 117 of the participants has never driven an EV before. The descriptive statistics in table 7 show us that the mean of likelihood to adoption for people that have driven an EV before, is already higher than the people that have not.
To check for equality of variances, a levene´s test has been performed.
Tabel 8:Levene´s test for equality of variances
F P
1,433 0,233
The Levene´s test for equality of variances is not significant as seen in table 8 (P>0.05), meaning that the H0 of this test: the error variance of the dependent variable is equal, cannot be
35
rejected. This assumption has not been broken, which means it is possible to continue with the one-way ANOVA.
Tabel 9: One-way ANOVA
F P
6,026 0,015
We can see in table 9 that the P-value is 0,015, which is below 0.05. This means that there is a statistically significant difference of means between the different groups. Typically a Post Hoc test has to be performed as most times the One-way ANOVA consists out of three groups. Due to the unequal sample size of the two groups as stated before, the T-test has not been chosen for this two group case and also makes a Post-Hoc test unnecessary. Hence, the H0 can be rejected and it can be stated that the likely hood to adopt an electric vehicle increases when people are exposed more to them.
To make the test more robust considering unequal sample sizes, the Welch’s test will be presented in table 10
Tabel 10: Welch's test
Statistica P
6,026 ,013
Looking at the Welch’s test, we can see a statistically significant P-value of 0,013. This test also confirms that the H0 can be rejected and increased exposure to EV’s indeed leads to a higher likelihood to adoption, which is in line with the approach to deal with passive resistance: increase exposure (Heidenreich & Kraemer, 2015). This test indicates that passive consumer resistance is indeed a part of the problem. For the specific results of SPSS, see appendix 4.
36
5 Discussion
5.1 Findings
The main objective of this thesis was to provide insights and information into tackling barriers that are located at the social-landscape level as individual actors might find great difficulties to overcome these. This way, an innovation leader can increase the market and does not have to be limited by the current market conditions in terms of their own innovation rate by sharing their knowledge with their competitors. The research has shown that the literature is consistent with the outcomes of this thesis, meaning that the socio-technical landscape can be influenced by an increase in resources of other competitors.
Looking at (H1), it has been proven that an advanced infrastructure similar to that of gas stations would improve the likelihood of adoption. This is in accordance to the literature which states that increased performance of a product/service as a trigger leads to increased adoption of an innovation. It is also aligned with the statement that the trigger ‘reduce barriers’ increases the likelihood of adoption. The following conclusion for RQ1 can be made: A similar infrastructure for charging stations such as gas stations would increase the likelihood of electric vehicle adoption.
When looking at (H2), an increased average range of Electric vehicles (300-400) would indeed lead to a higher likelihood to adoption. This is also in accordance with the theory that states that increased performance and variety leads to an increased likelihood to adoption of electric vehicles. The following conclusion for RQ2 can be made: An increased average range for electric vehicles would increase the likelihood of adoption of electric vehicles.
(H3) shown that passive consumer resistance can be affected by increasing exposure as the
likelihood to buy an electric car was higher for consumers that have driven one before. Also this part is in accordance with the theory that states that increased exposure to consumers leads to an increased likelihood to adoption, mainly due to a better understanding of the product (Gurtner, Hietschold, & R, 2017). The following conclusion for RQ3 can be made: Increased exposure to electric vehicles would increase the likelihood of adoption of electric vehicles. Combining these three results that are related to a higher engagement by competitors, it can be stated that sharing knowledge can lead to higher adoption, thus the answer to the problem statement is: yes. It has to be mentioned though, that a contingency would be that these competitors use the same charging adapter.
An important aspect of the literature is that an increase of innovation adoption also stimulates other consumers to mimic the behaviors of consumers already using this technology (Frambach
37
& Schillewaert, 2002). This could mean that an innovation leader could create a snowball effect and thus overcome psychological barriers (Ram & Sheth, 1989).
The literature also mentions that in technological complex area’s it is best to engage in mainly closed innovation instead of open innovation (Almirall & Casadesus-Masanell, 2010). It is crucial to understand that in this case, the innovation part would stay closed, not compromising this part of the company. It does on the other hand, use the extra resources of competitors as in open innovation, which plays an important part in the end result (Chesbrough, 2006).
In the end, this thesis confirmed that an increased amount of market engagement by competitors leads to increased likelihood of adoption, which makes the presented strategy an interesting one. This is mainly because the extra resources of new competitors could lead to a better infrastructure, higher exposure and a higher average range of vehicles, which also implies a higher choice for consumers. These three barriers have found to be the hardest one to overcome, which can be explained because they find themselves in the socio-technical landscape level of a Socio-technical system. (Geels F. W., Understanding the Dynamics of Technological transitions, 2002).
5.2 Implications, limitations and further research
This thesis validates that lowering the entry barriers for consumers could lead to a higher adoption ratio because of increased infrastructure, variety and an increased exposure. Consumers would indeed benefit from a higher amount of competitors in the terms of overcoming certain barriers on the socio-technical landscape. It has to be mentioned though, that especially for H1 the contingency would be that the adapters of the charging stations are uniform, so that every electric car can charge at the same spots, just as the current situations with gas stations. First of all a research should be conducted that indicates if potential competitors would be willing to start engaging more in electric vehicles if an innovation leader would freely share their knowledge. Then it should be researched if they would use the same adapter, another possibility could be that the free knowledge has one contingency: use the same adapter for the charging.
Furthermore, currently the only form of user engagement that has been researched is driving a car. There are more forms of engagement that can be researched in order to look if the likelihood of adoption would increase even more.
The amount of millennials in this survey might generate a false outcome for a general conclusion. Millennials have another look on technology which could make them more likely to adopt an electric vehicle. This in combination with the small sample size leads to the fact
38
that further research should be done in order to see the impact this strategy could have on a global scale. The low amount of observations could lead to an amplifying effect of certain variables that make this research less robust. This implies that research should be rolled out in multiple countries, with a higher amount of participants.
Lastly, the strategy should need more research. For example, it could be done as a two-phased long-term strategy: The first phase, the innovation leader opens up their knowledge to their competitors to shape the landscape. After this worked out, opening up knowledge is not necessary anymore and the innovation leader can stop opening their patents to increase their competitive advantage. The question arises: can they maintain a competitive position during the first phase? This would require more research.
39
References
Ahuja, G., & Katila, R. (2001). Technological acquisitions and the innovation performance of acquiring firms: A longitudinal study. Strategic Management Journal, 197-220.
Almirall, E., & Casadesus-Masanell, R. (2010). Open versus closed innovation: A model of discovery and divergence. Academy of Management Review, 27-47.
Arrow, J. K. (1970). Essays in the theory of risk-bearing. North-Holland Pub. CO.
Asllani, A., & Lari, A. (2011). OPEN INNOVATION MODELING USING GAME. Academy of Information and Management Journal, 79-90.
Bower, J. L., & Christensen, C. M. (1995). Disruptive technologies: Catching the wave. Harvard Business Review, 43-53.
Burns, T. R., & Flam, H. (1987). The shaping of Organization: Social rule system theory with applications. Lodon: Sage Publications.
Chart: Statista . (8 de Jun de 2017). Obtido de Statiste Web site:
https://www.statista.com/chart/9742/registrations-of-electric-cars-worldwide/
Cherchi, E., Jensen, a. F., & Mabit, S. L. (2013). On the stability of preferences and attitudes before and after experiencing an electric vehicle. Elsevier, 24-32.
Chesbrough, H. (2003). Open innovation: the new imperative for creating and profiting from technology. Harvard business school press.
Chesbrough, H. (2006). Open business models: How to thrive in the new innovation landscape. Boston: harvard business school press.
Chesbrough, H., & Schwartz, K. (2007). Innovating Business Modes with Co-Development Partnerships. Research Technology Management, 55-59.
Ciravegna, L., & Maielli, G. (2011). Outsourcing of new product development and the opening of innovation in mature industries. International Journal of Innovation Management, 69-93. Claudy, M. C., Garcia, R., & O'driscoll, A. (2015). Consumer resistance to innovation - a behavioural
reasoning. Journal of the Academy of Marketing Science, 528-544.
Cockburn, L. M., & Henderson, R. M. (1996). Scale and scope in drug development: unpacking the advantages of size in pharmaceutical research. Journal of Health Economics, 1033-1057. Cohen, W. M., & Levinthal, D. A. (1990). Absorptive capacity: a new perspective on learning and
innovation. Administrative science quarterly, 128-152.
Das, T. K., & Teng, B. S. (2000). A resource-based theory of strategic alliances. Journal of Management, 31-61.
Diamond, D. (2009). The impact of government incentives for hybrid-electric vehicles: evidence from U.S. states. Energy Policy, 972-983.
Dosi, G. (1982). Technological paradigms and technological trajectories: a suggested interpretation of the determinants and directions of technological change. Research Policy, 147-162.
Egbue, O., & Long, S. (2012). Barriers to widespread adoption of electricvehicles :An analysis of consumer attitudes and perceptions. Elsevier, 717-729.