UNIVERSIDADE DE LISBOA
FACULDADE DE CIÊNCIAS
DEPARTAMENTO DE FÍSICA
Quantifying age-related differences in Diffusion Tensor Imaging
biomarkers for the male urethral sphincter of prostate cancer
patients
Ana Sofia de Castro Verde
Mestrado Integrado em Engenharia Biomédica e Biofísica
Perfil em Sinais e Imagens Médicas
Dissertação orientada por:
Prof. Dr. Alexandre Andrade
Prof. Dr. Nickolas Papanikolaou
“It can be difficult to face the Unknown, but good things happen only when you do it.”
ACKNOWLEDGEMENTS
First of all I would like to thank Champalimaud Foundation for letting me be in this institution as a master thesis student for the past year, which has been both a great personal and professional experience. It was a privilege to be in such stimulating working environment, a place where everyday a little part of the unknown is unraveled.
I would like to thank my internal supervisor, Dr. Alexandre Andrade, for always having a reassuring word of advice since day one of the course. I would like to express my appreciation to my external supervisor, Dr. Nickolas Papanikolaou, for giving me the great opportunity of being a master student at his group, the Computational Clinical Imaging Group (CCIG), and for tutoring me along the way, always giving the encouragement that I was capable of doing my best: ευχαριστώ πολύ, Nickos! I would like to thank the director of the CCU Urology Unit, Dr. Jorge Fonseca, for presenting me a relevant clinical question and for believing that advances in Biomedical Engineering can make a difference in clinical practice. Also, I want to thank the radiologist Drª. Ana Gaivão for always sparing a little time of her clinical practice to answer my questions and to the radiology technicians and Inês Sousa, who were available when needed.
A special thanks to my dearest colleagues at CCU, who became good friends during this past year. To Eunice Carrasquinha, Francisco Oliveira and Nuno Loução, for giving me good advices and sharing their experience in research. To João Santinha, for always being available to help and to discuss ideas. To Mónica, for being my “partner in crime” at CCU with whom I’ve shared many thoughts and fun. To Sarita, Sílvia and Cláudia, for being such amazing girls, who were always cheering up my days. To Ju and Maria Inês, for the spontaneous hugs and laughs that filled my heart with joy. To Zé and João, for being super fun guys to be with. And to Linda, for our deep conversations during coffee, that I will cherish. With you I’ve learned so much and we’ve made fantastic memories together!
This being said, I cannot forget to thank the teachers and the classmates who accompanied me during the course. To my sweet friends Laeticia and Neusa for adding a beautiful glow in my life, to Catarina for being my dearest everyday train companion during my college years, to Bia and João for being the best group mates, to Ana Raquel for the good moments in Nancy, and to Gui, Campagnolo, Catarina, Raquel and many others for being good friends. Also, I would like to thank my sweet Anas that are always in my heart since Cardiff, and remain good friends that I consider an inspiration to follow. Finally, I would like to thank the people who made me the person I am today. Thank you so much mum and dad for being my best friends and my support. I know I can count with you forever. Thank you to my family and to my grandparents, Manuela, Esmeralda, Eduardo e Henrique for all the love and the courage you give me to continue my journey. And last but not least, thank you Tiago, for the love and the everyday support, “we’re far from the shallow now”.
ABSTRACT
For the past years, radical prostatectomy (RP) has been the treatment of choice for locally advanced prostate cancer (PC) because of its high accuracy in tumor removal. However, the surgical techniques performed tend to be invasive, with a complete removal of the proximal lisso-sphincter and partial removal of the distal rhabdosphincter. Whereas the former has been related with maintenance of continence at rest, the latter is related with active continence. Between 4 to 69 % [1] of patients undergoing RP develop urinary incontinence, with a reported decrease in quality of life. This can be a consequence, not only from the surgical technique used, but from other factors including the competence of the sphincter function, that it is expected to decrease with age [2]. It is important to find preoperative imaging biomarkers that can help predict the risk of the patient developing postoperative urinary incontinence. The TransDouglas project, approved by the Ethics Committee of Champalimaud Foundation since July 2018, aims at validating the implementation of a new surgical procedure for RP, which is an improved version of the robotic-assisted laparoscopic radical prostatectomy (RALRP) procedure. Preoperative anatomical parameters are extracted from the T2-weighted magnetic resonance imaging (MRI) that can be related with urinary incontinence after the new surgical technique, and to construct a model that can help predict the likely time until urinary continence recovery.
Diffusion tensor imaging (DTI) is a MRI-based technique that allows the quantification of anisotropic movement of water molecules. It has been proven [3] that this technique can be used to visualize the microarchitecture of the urethral sphincters, and to extract relevant diffusion metrics. DTI metrics can be incorporated in the model to predict urinary incontinence recovery after RP. Considering this, an addendum to the TransDouglas project that requests the acquisition of an additional DTI sequence to the standard multiparametric (mpMRI) of the prostate has been approved this January, enabling the use of DTI to study the microarchitecture of the urethral sphincters in vivo and non-invasively. However, since parameters of sphincter function significantly change with age [2], it is important to study the influence of patient age at scan on these parameters prior to predicting the likely chance of continence recovery after RP. Therefore, the main goal of this thesis was to investigate age-related differences in DTI metrics of the male urethral sphincter complex. Furthermore, the influence of a prostate condition, including PC and benign prostatic hyperplasia (BPH), was studied.
The proximal and distal sphincters, as well as the membranous urethra, were reconstructed for 95 subjects by using the deterministic tractography algorithm in DSIStudio software [4]. DTI metrics were extracted including tract length and density, fractional anisotropy (FA), mean diffusivity (MD), axial diffusivity (AD) and radial diffusivity (RD) and additional histogram parameters for each DTI metric, namely standard deviation, median, trimmed mean, median absolute deviation, minimum, maximum, range, skewness, kurtosis, standard error and the 5th, 25th, 75th and 95th percentiles. The influence of
subject motion and eddy currents corrections on the extracted DTI metrics was investigated. Linear regressions and Pearson or Spearman correlations were performed between age and each of the DTI metrics. Additionally, analysis of variance (ANOVA), or the non-parametric Kruskal-Wallis test, were used to compare DTI metrics between four age groups (from 50 to 59, 60 to 69, 70 to 79 and 80 to 89 years old). For a subset of the 69 subjects with a confirmed diagnosis for PC, BPH and the absence of any of both, ANOVA testing was used to compare between disease groups, and t-tests, or the non-parametric Wilcoxon test, to compare between cancer status. For statistically significant ANOVA test results, post-hoc t-tests were used to investigate the groups between which the difference lied.
No statistically significant differences were found on DTI metrics with and without motion and eddy currents corrections, so the non-corrected DTI data was used for the subsequent analysis. In this study, it was found that MD and RD distributions statistical significantly changed with age. In particular, older subjects evidenced lower RD kurtosis in the proximal sphincter, lower MD maximum in the distal sphincter and higher MD median absolute deviation in the membranous urethra. On the other hand, further investigations are needed to understand if the presence of a prostate condition affects the DTI metrics of the sphincters and membranous urethra.
This project was the first to examine age related differences in the urethral sphincter complex using DTI, as well as, the first time a DTI sequence for the prostate was implemented at Champalimaud Centre for the Unknown (CCU). It was concluded that age should be used as a covariate in a model that makes use of DTI biomarkers representative of the male urethral complex microstructure to predict the likely time of post-surgical continence recovery. Ultimately, this investigation should be a starting point for helping clinicians in the prediction of the risk of complications for each patient before undergoing RP, and balance the advantages and disadvantages comparing with other available treatment options for PC.
Keywords: “Diffusion tensor imaging”, “tractography”, “urethral sphincter”, “age” and “prostate
RESUMO
Segundo dados de 2016, no sexo masculino e em países desenvolvidos, o cancro da próstata foi o cancro que registou maior incidência [5]. Após uma deteção através do aumento da evolução dos níveis do antigénio específico da próstata (PSA) no sangue e/ou de realização do teste do toque retal, o método de diagnóstico mais comum é a biópsia, que pode ser auxiliada por ultrassons ou por ressonância magnética multiparamétrica. A escolha do tratamento adequado para cada paciente depende do estadio da doença e das suas preferências individuais, que geralmente pretendem equiponderar a esperança de vida para o paciente e a qualidade de vida após tratamento. Geralmente, as opções de tratamento mais adequadas para um paciente com PSA > 10 ng/mL e nódulos palpáveis são: acompanhamento e tratamento dos sintomas à medida que estes surgem, radioterapia ou braquiterapia, e cirurgia [6]. A última opção, em particular a prostatectomia radical, tem demonstrado maior precisão na remoção de tecido maligno e no aumento da esperança média de vida para os pacientes operados [7]. Mais recentemente, técnicas laparoscópicas convencionais têm vindo a ser substituídas por técnicas robóticas que oferecem maiores vantagens no pós-operatório. No entanto, a incontinência urinária e a disfunção erétil continuam a ser complicações reportadas por uma percentagem significativa de pacientes submetidos a cirurgia. Relativamente ao primeiro, afeta cerca de 4 a 69 % dos pacientes [1], e a sua ocorrência está intimamente ligada à remoção do esfíncter proximal ou liso, que ocorre aquando da remoção da próstata, e consequente dano no esfíncter distal ou rabdoesfíncter.
A construção de um modelo preditivo da recuperação da continência pós-cirúrgica com base na utilização de biomarcadores do esfíncter, pode permitir aos prospetivos pacientes uma escolha ponderada do tipo de tratamento. No entanto, é sabido que a microestrutura do esfíncter varia com a idade [2], logo é necessário conhecer o padrão de variação dos biomarcadores do esfíncter com a idade, no sentido de avaliar a recuperação pós-cirúrgica da continência.
Para estudar a microestrutura do esfíncter têm sido utilizadas diversas técnicas in vivo [8]–[13] que, no entanto, não fornecem informação tridimensional da estrutura e orientação das fibras que o compõem. Contrariamente, imagem por tensor de difusão (DTI) é uma técnica não invasiva baseada em ressonância magnética que permite quantificar o movimento das moléculas de água nos tecidos, através da aplicação de gradientes em várias direções não colineares [14]. Relacionando o gradiente aplicado com o sinal medido, obtém-se em cada voxel informação sobre a magnitude e direção da difusão. A partir da diagonalização do tensor de difusão é possível calcular eigenvalues e eigenvectors. Enquanto que os últimos refletem a direccionalidade, os primeiros quantificam a magnitude da difusão e combinados entre si permitem obter um conjunto de métricas – que inclui a anisotropia fracional (FA), difusibilidade axial (AD), difusibilidade média (MD) e difusibilidade radial (RD) – que permitem estudar a organização estrutural das fibras. Apesar das aplicações de DTI se focarem essencialmente em estudos de conectividade da substância branca do cérebro, têm progressivamente sido alargadas ao estudo de outros órgãos, como o rim [15], o coração [16] e a próstata. Relativamente ao uso de DTI para o estudo da próstata, esta técnica tem sido utilizada para estudar este órgão em condições normais [17] e para definir métricas que permitam distinguir tecido saudável de tumoral [18]. Ademais, estudos têm avaliado os feixes neuro-vasculares da próstata antes e após a cirurgia e correlacionado com a disfunção erétil pós-prostatectomia radical [7]. Para além de um estudo que investigou o esfíncter uretral feminino usando DTI [19], que se tenha conhecimento, existe apenas um estudo que conseguiu utilizar DTI para estudo da microarquitectura do esfíncter masculino em sujeitos jovens e sem patologia [3].
Assim, o principal objetivo da presente tese de mestrado é investigar variações derivadas da idade no complexo do esfíncter uretral, que compreende os esfíncteres proximais e distais e a uretra membranosa – correspondente ao segmento da uretra que se estende desde o ápice da próstata até ao bulbo peniano. No sentido de estudar o efeito da presença de uma condição da próstata, incluindo cancro da próstata e hiperplasia benigna da próstata (HBP), a variação das métricas de DTI do esfíncter para o grupo de pacientes diagnosticados foi também avaliada. Como objetivo secundário, que teve importância na etapa de processamento dos dados de DTI, foi investigado se a correção de movimento durante a aquisição e correção de correntes de Foucault afetava significativamente as métricas de DTI em estudo, para cada uma das estruturas.
Para tal, os esfíncteres proximal e distal, bem como a uretra membranosa, foram reconstruídos para 95 indivíduos usando o algoritmo determinístico de tractografia no software DSIStudio [4]. Previamente foram definidas manualmente um conjunto de regiões de interesse nos mapas coloridos de FA para os esfíncteres proximal e distal, e na imagem anatómica em T2 para a uretra membranosa. Para a tractografia, foram otimizados alguns parâmetros segundo uma abordagem de tentativa e erro, que acabou por estabelecer um valor limite de anisotropia fracional de 0.15, e um limite angular de 75º e 45º, respetivamente para os esfíncteres e para a uretra. As métricas de DTI foram extraídas para cada uma das estruturas reconstruídas, incluindo o comprimento e densidade das fibras, FA, AD, MD e RD e parâmetros adicionais do histograma para cada métrica de DTI, ou seja, desvio padrão, mediana, média aparada, desvio absoluto mediano, mínimo, máximo, amplitude, assimetria, curtose, erro padrão e os percentis 5, 25, 75 e 95. A influência do movimento e da presença de correntes de Foucault nas métricas de DTI extraídas foram investigadas. Regressões lineares e correlações de Pearson ou Spearman foram realizadas entre a idade e cada uma das métricas de DTI. Além disso, uma análise de variância (ANOVA) – ou o equivalente teste não paramétrico de Kruskal-Wallis –, foram realizados para comparar métricas de DTI entre quatro faixas etárias (de 50 a 59, 60 a 69, 70 a 79 e 80 a 89 anos). Para um subconjunto dos 69 indivíduos com diagnóstico confirmado de cancro de próstata, HBP ou da ausência de qualquer um dos dois, o teste ANOVA foi usado para comparar entre grupos de doença. Adicionalmente, testes t-student – ou o teste não paramétrico de Wilcoxon – foram utilizados para comparar a presença vs. ausência de cancro. Para resultados estatisticamente significativos do teste ANOVA, foram posteriormente empregues testes t-student para investigar entre que grupos se encontrava a diferença.
Não foram encontradas diferenças estatisticamente significativas nas métricas de DTI com e sem correção de movimento e correntes de Foucault, logo, os dados de DTI sem correção foram utilizados para a análise subsequente. Neste estudo, verificou-se que as distribuições de MD e RD variaram significativamente com a idade. Em particular, indivíduos mais velhos evidenciaram menor curtose da RD no esfíncter proximal, menor valor máximo de MD no esfíncter distal e maior desvio absoluto mediano de MD na uretra membranosa. Por outro lado, são necessárias investigações adicionais para entender se a presença de uma condição da próstata pode afetar as métricas de DTI dos esfíncteres e da uretra membranosa. Tal acontece, pois os resultados obtidos neste estudo para a presença de doença estão limitados pela heterogeneidade da amostra em termos das diferentes condições que cada indivíduo pode apresentar.
Julga-se que este estudo foi o primeiro a identificar variações com a idade nas métricas de DTI do esfíncter. Além disso, definiu a inclusão de uma sequência de DTI à ressonância magnética multiparamétrica da prática clínica da Fundação Champalimaud. Por se tratar de um estudo prospetivo, foi possível definir os parâmetros de aquisição – nomeadamente o valor de b (em s/mm2), o número de
para a visualização das estruturas do complexo uretral masculino, com o melhor compromisso entre duração da aquisição (em minutos) e a resolução espacial (em milímetros). Esta nova sequência só começou a ser incluída na clínica desde Janeiro 2019, o que representa cerca de 14 pacientes operados, dos 45 diagnosticados com cancro da próstata. Assim que for possível aumentar a amostra de pacientes operados com um intervalo de tempo pós-cirúrgico de 3 a 6 meses, será possível utilizar os resultados dos testes de incontinência, os dados de DTI do esfíncter corrigidos da idade e as medidas do comprimento da uretra em T2, para prever o tempo de recuperação de continência pós-cirúrgica. No futuro, esperamos poder extrair os biomarcadores de DTI para o complexo do esfíncter uretral de cada paciente e usá-los como um preditor da taxa de incontinência pós-cirúrgica. No entanto, é importante que este modelo tenha em conta alterações nas métricas de DTI do complexo uretral masculino que são influenciadas pelo envelhecimento. Esse modelo preditivo pode orientar os pacientes na escolha informada da melhor opção de tratamento personalizado para tratar o tumor da próstata e, simultaneamente, proporcionar uma qualidade de vida satisfatória.
Palavras-chave: “Imagem por tensor de difusão”, “tractografia”, “esfíncter uretral”, “idade” e “cancro
CONTENTS
ACKNOWLEDGEMENTS ... II ABSTRACT ... III RESUMO ... V LIST OF FIGURES ... IX LIST OF TABLES ... XIII LIST OF ACRONYMS ... XIV
1 INTRODUCTION ... 1
1.1 Objectives and hypothesis ... 1
2 BACKGROUND ... 2
2.1 Normal prostate and its conditions ... 2
2.1.1 Prostate anatomy ... 2
2.1.2 Anatomy of other relevant structures of the male pelvic complex ... 4
2.1.3 Prostate conditions ... 5
2.1.4 Prostate cancer ... 6
2.2 Diffusion tensor imaging ... 11
2.2.1 Theoretical background ... 11
2.2.2 Tractography ... 15
2.2.3 Diffusion tensor imaging workflow ... 16
2.2.4 Motion distortion and eddy currents correction ... 17
3 STATE-OF-THE-ART ... 19
4 MATERIALS AND METHODS ... 26
4.1 Ethics Committee approval ... 26
4.2 Study dataset ... 26
4.3 Clinical variables ... 27
4.4 Data acquisition ... 28
4.5 Data De-identification ... 30
4.6 Diffusion tensor imaging processing and Tractography ... 32
4.7 Statistical analysis ... 36
5 RESULTS ... 38
5.1 Study dataset descriptive statistics ... 38
5.2 Effect of the motion and eddy currents corrections on DTI metrics ... 45
5.3 Fiber tracking results on the original diffusion tensor imaging data ... 47
5.4 Inferential statistics on diffusion tensor imaging metrics with age ... 52
5.5 Inferential statistics on diffusion tensor imaging metrics by group ... 55
6 DISCUSSION ... 60
LIST OF FIGURES
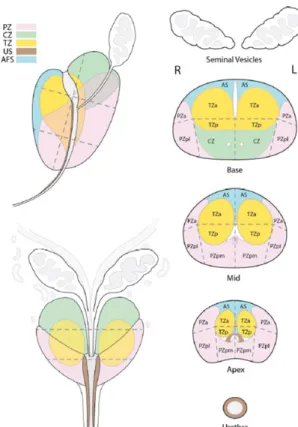
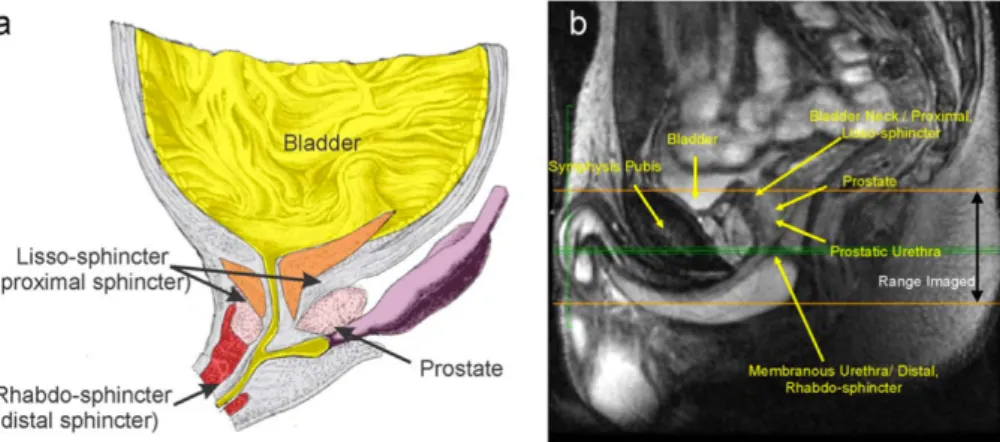
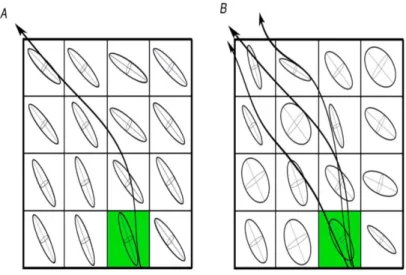
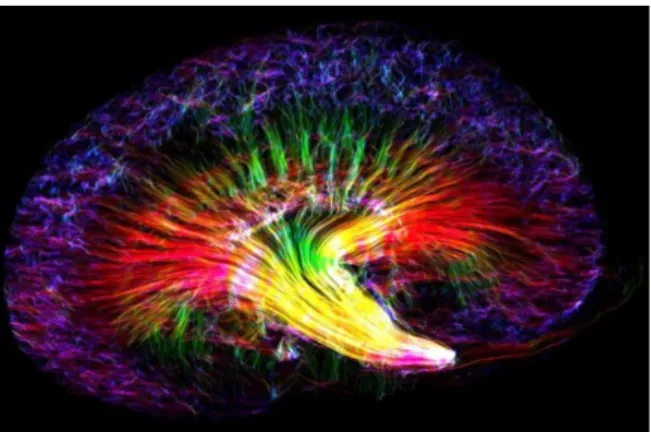
Figure 2.1 Zonal anatomy of the prostate gland, showing the peripheral zone (PZ) in pink, the central zone (CZ) in green, the transition zone (TZ) in yellow, the urethral sphincter (US) in brown and the anterior fibromuscular stroma (AFS) in blue. On the right side of the image, it is possible to see the seminal vesicles, the urethra and the subdivision of the prostate base, midgland and apex into 12 sectors described on Table 2.1. – adapted from [23]. ... 3 Figure 2.2 Mid-sagittal male anatomy near the bladder and urethra, including a schematic on that section (a) and a magnetic resonance imaging (MRI) high-resolution proton density image on an increased field of view (FOV) (b) - adapted from [3]. ... 4 Figure 2.3 Schematic neuroanatomy of the male urethral sphincter complex, including the bladder musculature (1), the perineal membrane (6), the prostate (7), and with particular attention to the following: the proximal (2) and distal (3) parts of the lisso-sphincter, the rhabdosphincter (4) and the prostatic part of rhabdosphincter (5) - adapted from [24]. ... 4 Figure 2.4 Gross slice of the pelvis showing the levator ani (LA) fascia and the urethral rhabdosphincter (URS). The URS and the puborectalis muscle (PR) are connected by a thick tissue mass (marked with white stars). The PR is also connected to the outer layer of the rectum (marked with black stars) In this figure it is also possible to observe the dorsal vein complex (DVC) and the MU (membranous urethra) – adapted from [25]. ... 5 Figure 2.5 Absolute incident cases (in 2016) for male subjects, color encoded by cancer type. As we can see, PC (shown in purple) is the most incident cancer in men worldwide, and the one with a higher incidence in men in Portugal – adapted from [5]. ... 6 Figure 2.6 PI-RADS assessment categories for lesions on each prostate region, PZ and TZ, based on the DWI/ADC and the T2-weighted image, respectively. To distinguish between similar lesions, other mpMRI sequences can be used as reference, such as the DCE image – adapted from [32]. ... 8 Figure 2.7 The Stejskal-Tanner imaging sequence, where G represents the magnitude of the applied gradient, ! the duration of each diffusion gradient and ∆ the duration between the application of the two gradients - adapted from [52]. ... 11 Figure 2.8 From diffusion image to tensor. Note that we only need to apply the gradient in six different directions to generate a 3 x 3 matrix, because #$% = #%$, #$' = #'$ and #%' = #'% - adapted from [56]. ... 13 Figure 2.9 Different shapes of the diffusion tensor, and its relationship with diffusion eigenvalues - adapted from [56]. ... 13 Figure 2.10 Diffusion ellipsoids - adapted from [53]. ... 14 Figure 2.11 Schematic comparison between two tractography propagating methods, a deterministic (A) and a probabilistic (B) algorithms starting from the seed point (green) - adapted from [64]. ... 15 Figure 2.12 Main important steps of the DTI workflow - adapted from [14]. ... 16 Figure 3.1 DTI of a mouse kidney, created using DSI Studio by Nian Wang, Center for In Vivo Microscopy (Directed by Dr. G. Allan Johnson), Duke University, U.S – adapted from the BMC ‘Research in progress’ 2018 competition results [93]. ... 20 Figure 3.2 Tractography of the prostate gland, with a dominancy of blue tracts (superior-inferior orientation), especially in the CG – adapted from [92]. ... 21
Figure 3.3 Evolution on the density of striated muscle cells of rhabdosphincter with age, both in males
and females – adapted from [111]. ... 23
Figure 3.4 Transverse FA map on the inferior pelvic floor of a 31 year female subject (a) – depicting the external obturator muscle (OE) and the puborectal sling (PS)-, and tractography of the female urethral sphincter fibers in an antero-lateral (b) and cranial view (c) – adapted from [19]. ... 24
Figure 3.5 Tractography of the male urethral proximal and distal sphincters, as well as the membranous urethra (in green are depicted the ROIs drawn for the tracking, positioned at the level of the sphincters), for three healthy subjects – adapted from [3]. ... 25
Figure 4.1 Representation of a 70 years old subject submitted to brachytherapy to treat PC, reason to be excluded from the study. The radioactive seeds implanted on the prostate can be seen on the anatomical T2-weighted image (marked by yellow arrows), both an axial (a1) and sagittal views (a2). The presence of these seeds causes imaging artifacts on the DWI with a b-value of a 1500 s/mm2 (a3) and on the ADC map (a4). ... 26
Figure 4.2 Representation of a 70 years old subject submitted to a RP to treat PC, reason to be excluded from the study. The absence of the prostate can be identified on the anatomical T2-weighted image, both an axial (a1) and sagittal views (a2), a DWI with a b-value of a 1500 s/mm2 (a3), and an ADC (a4). The level at which the prostate is missing is marked in blue. ... 27
Figure 4.3 MRI T2-weighted image of the mid-sagittal slice, labelled with the relevant anatomy, where the orange lines define the proximo-distal extent imaged in the DTI acquisition. ... 29
Figure 4.4 Schematic representation of the DTI processing and analysis pipeline. ... 32
Figure 4.5 FSL's "topup" schematic representation. ... 33
Figure 4.6 FSL's "eddy" schematic representation. ... 33
Figure 4.7 Axial views obtained from DSIStudio showing the ROI placement on the color-coded FA maps for the proximal sphincter (a) and distal sphincter (b), and on the T2-weighted image for the apex (c1) and bulb (c2) to track the membranous urethra. ... 34
Figure 5.1 Age distribution of the 95 male study subjects. The normal distribution curve that better fits the data is plotted on top of the histogram (in black). ... 38
Figure 5.2 Subjects’ distribution by age group. The majority of subjects lie in the age group between 60 to 69 years old. ... 39
Figure 5.3 Representative 70 years old HC subject with a normal prostate with a volume of 50 cm3 (a) and a 80 years old BPH subject with a clearly enlarged prostate volume of 110 cm3 (b). The prostate extension is highlighted in blue. For each subject is shown an anatomical T2-weighted image, both on axial (1) and sagittal views (2), a DWI with a b-value of 1500 s/mm2 (3), and an ADC (4). Images for the HC subject (a) presented some geometrical distortions caused by air in the rectum, as marked by orange arrows. ... 40 Figure 5.4 Representative 60, 75 and 70 years old PC patients with different tumor locations, namely, with a tumor on the right middle third and apex of the PZ (c), on the right middle third of the TZ (d) and on the anterior right middle third and apex of both PZ and TZ (e). These patients have a Gleason score of 3 + 4, a PIRADS of 5 and an index lesion of, respectively, 25, 25 and 20 mm. For each subject is shown an anatomical T2-weighted image, both an axial (1) and sagittal views (2), a DWI with a b-value of 1500 s/mm2 (3), and an ADC (4). Tumors are marked by a yellow arrow and a cyst in (d) is marked
Figure 5.5 Subjects’ distribution by disease group. Here the PC group is represented by the red bar, the BPH by the orange and the HC group by the green. ... 42 Figure 5.6 Subjects’ distribution by cancer status. Here the PC group is represented by the red bar and the non-PC group is represented by the grey bar. ... 42 Figure 5.7 Age distribution of patients within each disease group, respectively the PC (red), the BPH (in orange) and the HC (in green) groups. The latter represents the age distribution of patients for the non-PC group (in grey). ... 43 Figure 5.8 Pie charts representing the number of PC patients within each category of Gleason score, tumor location and PI-RADS score. The NA group present in the three categories represents the PC patients for each that information was not available. ... 44 Figure 5.9 Tumor index lesion size (maximum length) distribution for PC patients. ... 44 Figure 5.10 Fiber tracking results derived from the DTI images of an arbitrarily chosen study subject, a 61 years old PC patient with a tumor located on the PZ. This figure shows the microstructure of the proximal and distal sphincters and the membranous urethra, color-coded based on the direction of the fibers - red for left-right (x), green for anterior-posterior (y) and blue for superior-inferior (z) directions. ... 47 Figure 5.11 Fiber tracking results overlaid on the T2 maps, for one of the study subjects arbitrarily chosen. From top to bottom, respectively, it is represented the proximal sphincter, the distal sphincter and the membranous urethra for this subject. From left to right, respectively, each structure of interest is shown on the axial, sagittal and coronal views. ... 48 Figure 5.12 Color-encoded DTI metrics (from top to bottom, FA, AD, MD and RD) for the proximal sphincter of four study subjects representative of each age decade. Red depicts regions with a higher DTI metric value, while blue depicts regions with a DTI metric value closer to zero. ... 49 Figure 5.13 Color-encoded DTI metrics (from top to bottom, FA, AD, MD and RD) for the distal sphincter of the same four study subjects chosen for Figure 5.12. Red depicts regions with a higher DTI metric value, while blue depicts regions with a DTI metric value closer to zero. ... 49 Figure 5.14 Color-encoded DTI metrics (from top to bottom, FA, AD, MD and RD) for the membranous urethra of the same four study subjects chosen for Figure 5.12. Red depicts regions with a higher DTI metric value, while blue depicts regions with a DTI metric value closer to zero. ... 50 Figure 5.15 Color-encoded DTI metrics (from top to bottom, FA, AD, MD and RD) for the proximal sphincter of three study subjects representative of each disease group –HC, PC subjects and BPH subjects. Red depicts regions with a higher DTI metric value, while blue depicts regions with a DTI metric value closer to zero. ... 50 Figure 5.16 Color-encoded DTI metrics (from top to bottom, FA, AD, MD and RD) for the distal sphincter of the same three study subjects chosen for Figure 5.15. Red depicts regions with a higher DTI metric value, while blue depicts regions with a DTI metric value closer to zero. ... 51 Figure 5.17 Color-encoded DTI metrics (from top to bottom, FA, AD, MD and RD) for the membranous urethra of the same three study subjects chosen for Figure 5.15. Red depicts regions with a higher DTI metric value, while blue depicts regions with a DTI metric value closer to zero. ... 51 Figure 5.18 Color scheme for the statistically significant p-values. ... 53
Figure 5.19 Boxplots representing statistically significant ANOVA (or the non-parametric Kruskal-Wallis) test results on DTI metrics of the proximal sphincter between age groups. Post-hoc t-test p-values for each pair of age decades is on the top of each figure. ... 55 Figure 5.20 Boxplots representing statistically significant ANOVA (or the non-parametric Kruskal-Wallis) test results on DTI metrics of the distal sphincter between age groups. Post-hoc t-test p-values for each pair of age decades is on the top of each figure. ... 56 Figure 5.21 Boxplots representing statistically significant ANOVA (or the non-parametric Kruskal-Wallis) test results on DTI metrics of the membranous urethra between age groups. Post-hoc t-test p-values for each pair of age decades is on the top of each figure. ... 57 Figure 5.22 Boxplots of statistically significant ANOVA (or Kruskal-Wallis) comparisons of DTI metrics between disease groups. Here the PC group is represented in red, the BPH in orange and the HC group in green. Post-hoc t-test p-values for each pair of disease groups is on the top of each figure. .. 58 Figure 5.23 Boxplots of statistically significant t-test comparisons of DTI metrics between cancer status groups. Here the PC group is represented in red, whereas the non-PC group is shown in grey. ... 59
LIST OF TABLES
Table 2.1 Acronyms for the 6 sectors repeated on both sides of base, midgland and apex. ... 3 Table 4.1 Optimization of DTI acquisition parameters for the first 5 study subjects. The * indicates that this subject had an acquisition extension displaced to a more distal region. ... 30 Table 4.2 Description on the anonymized DICOM variables, based on its value representation (VR) 31 Table 4.3 Fixed fiber tracking parameters for the studied structures of the male urethral complex. .... 35 Table 5.1 Numerical clinical variables for the total dataset (95 subjects) and for each of the individual disease groups of the 69 diagnosed subjects. Each numerical variable was presented as Median; IQR [min.-max.](N), where IQR stands for interquartile range and N for the number of subjects for which that variable information was available. ANOVA (or the non-parametric Kruskal-Wallis, marked by a *) test p-values for the comparison of each variable between disease groups, is shown on the last column. Statistically significant p-values are highlighted in orange. ... 43 Table 5.2 Statistical test results for motion correction. Non-parametric tests are marked by an *. ... 45 Table 5.3 Statistical test results for eddy currents correction. Non-parametric tests are marked by an *. ... 46 Table 5.4 Mean and standard deviation (mean ± sd) values on the DTI metrics of the 95 male study subjects, for each analyzed structure of the urethral complex. Tract density is expressed in tracts/mm3;
Tract length in millimeters (mm); Diffusivity measures - AD, MD and RD - in 10-3 mm2/s; FA is
dimensionless. ... 52 Table 5.5 Pearson or Spearman (marked with an *) correlation coefficients (r or rS) between age and
each of the DTI metrics (FA, AD, MD and RD) mean, standard deviation (sd), median, trimmed mean, median absolute deviation (mad), minimum, maximum, range, skewness, kurtosis, standard error (se), and the 5th, 25th, 75th and 95th percentiles values, calculated for the male urethral complex structures
studied. Statistically significant correlation p-values are color-coded, as shown by Figure 5.18. ... 53 Table 5.6 Pearson or Spearman (marked with an *) correlation coefficients (r or rS) between age and
each of the DTI metrics tract length and tract density, calculated for the male urethral complex structures studied. Statistically significant correlation p-values are color-coded, as shown by Figure 5.18. ... 53 Table 5.7 Adjusted R-squared values on the linear regressions performed between age and each of the DTI metrics (FA, AD, MD and RD) mean, standard deviation (sd), median, trimmed mean, median absolute deviation (mad), minimum, maximum, range, skewness, kurtosis, standard error (se), and the 5th, 25th, 75th and 95th percentiles values, calculated for the male urethral complex structures studied.
Statistically significant correlation linear regressions are color-coded, as shown by Figure 5.18. ... 54 Table 5.8 Adjusted R-squared values on the linear regressions performed between age and each of the DTI metrics tract length and tract density, calculated for the male urethral complex structures studied. Statistically significant correlation p-values are color-coded, as shown by Figure 5.18. ... 54
LIST OF ACRONYMS
AD Axial diffusivityADC Apparent diffusion coefficient AFS Anterior fibromuscular stroma BPH Benign prostatic hyperplasia CG Central gland
DCE Dynamic contrast enhanced DRE Digital rectal exam
DTI Diffusion tensor imaging DWI Diffusion weighted imaging FA Fractional anisotropy
FACT Fiber assignment by continuous tracking FOV Field of view
HC Healthy controls
ICIQ-SF Incontinence questionnaire-short form LUTS Lower urinary tract symptoms
MD Mean diffusivity mpMRI Multiparametric MRI PC Prostate cancer
PI-RADS Prostate Imaging Reporting and Data System PE Phase-encoding
MRI Magnetic resonance imaging PNFs Periprostatic neurovascular fibers PSA Prostate specific antigen
PZ Peripheral zone
RALRP Robotic assisted laparoscopic radical prostatectomy RD Radial diffusivity
ROI Regions of interest RP Radical prostatectomy SENSE Sensitivity encoding SP-EPI Spin-echo planar imaging SNR Signal-to-noise ratio TZ Transition zone
1 INTRODUCTION
Urinary incontinence is a post-surgical complication that diminishes prostate cancer (PC) patients quality of life. The main focus should be, not on the treatment of urinary incontinence, but rather on its prediction before occurrence. Individual preoperative imaging parameters of the male urethral sphincter complex microstructure can potentially be used to predict the rate of post-surgical continence recovery. However, since its microstructure is thought to change with age, it is important to access age-related differences in the male urethral sphincter complex.
1.1 Objectives and hypothesis
To our knowledge, there is one published study that has successfully shown that diffusion tensor imaging (DTI) can be used to study the male urethral sphincter complex [3]. After feasibility of urethral sphincters’ DTI has been proven for eleven healthy young subjects, we aim at addressing a gap in the literature with the investigation of age and disease related changes on DTI metrics of older male subjects with (suspected) PC, benign prostatic hyperplasia or without any prostate condition. Additionally, there is no stablished consensus on whether motion and eddy currents corrections should be performed on DTI of the male urethral complex and which is the recommended method, due to the limiting number of existing studies.
Hereupon, this thesis has the following objectives:
1) Studying the influence of motion and eddy currents correction on the analysis of DTI metrics of the male urethral sphincter complex;
2) Investigating whether DTI metrics significantly change in the presence of a prostate condition, namely PC and benign prostatic hyperplasia (BPH);
3) Investigating age-related differences in the male urethral sphincter microarchitecture, studying whether there is a linear relationship or correlation between age and DTI metrics of the sphincter complex, and by comparing DTI metrics by age decades – which is the current thesis main goal. Regarding 3), since it is expected a decrease in fiber integrity with age, it is hypothesized a reduction in fractional anisotropy (FA) with increasing age. Also, it is hypothesized a reduced tract density and length in older subjects, reported by tractography findings. These findings may help understanding the effect of ageing in the male urethral sphincter microstructure, in order to be able to weight in the influence of age when predicting the rate of recovery from postoperative urinary incontinence.
The current master thesis has been structured to first cover the relevant theory on the anatomy of the prostate and adjacent structures of the male pelvic complex, prostate conditions focusing on PC, postoperative complications following radical prostatectomy (RP) centering on urinary incontinence, and several aspects related with diffusion tensor imaging (DTI) as a non-invasive technique to study the sphincters’ microarchitecture. In chapter 3, the current state-of-the-art for DTI is addressed, from brain applications, passing through studies of DTI on pelvic organs, to applications on the prostate, periprostatic neurovascular fibers (PNFs) and the urethral sphincter complex. Afterward, in chapter 4, the materials and methods used for data acquisition, imaging processing, tractography and statistical analysis are presented. In the following chapter, the results are presented for addressing each one of the study goals, related with the effect of motion and eddy currents corrections, as well as the fiber tracking results analyzed both with age and disease. Lastly, the discussion and study conclusions, limitations, and future work are presented in chapter 6.
2 BACKGROUND
2.1 Normal prostate and its conditions
2.1.1 Prostate anatomy
The prostate is an accessory gland of the size and shape of a walnut, with about 4 cm long and 2 cm wide, that is part of the male reproductive system [20]. During ejaculation, this gland contracts to accomplish its main function of secreting a fluid to nourish and protect sperm, contributing to 30% of the semen. This gland is located inferior to the urinary bladder, superior to the penile bulb and anterior to the rectum. If one is to divide the prostate into three thirds in the superior-inferior direction, it is possible to consider, respectively, the base (right below the bladder), the midgland and the apex [21]. An extra prostatic capsule incompletely encircling the prostate, made of smooth muscle on the internal portion and fibrous connective tissue on the external portion, can be acknowledged. However, histological evaluation confirms the nonexistence of a real prostate capsule (in return one can designate it as a pseudo capsule), since this tissue is inseparable from prostatic stroma.
This gland is crossed by the prostatic segment of the urethra, that can be used as a central anatomical reference point to locate each one of the prostate regions [22]. Considering the zonal anatomy of the prostate, it is possible to divide it into four histologically and anatomically distinct zones: peripheral zone (PZ), transition zone (TZ), central zone (CZ) and anterior fibromuscular stroma (AFS). The peripheral zone constitutes 70% of glandular tissue and it is located on the posterior and lateral side of the prostate, radiating laterally to the urethra. The transition zone is crossed by the prostatic urethra and constitutes only 5% of the prostate glandular tissue. Posteriorly to the transition zone, is the central zone that follows left and right ejaculatory ducts, branching laterally into the prostate base. This region constitutes 25% of the glandular tissue. Finally, the non-glandular anterior fibromuscular stroma is the smaller area that occupies the totality of the anterior surface of the prostate. The prostate zonal anatomy can be depicted in Figure 2.1, that also shows how each third of the prostate can be subdivided into 6 sectors on each side.
Figure 2.1 Zonal anatomy of the prostate gland, showing the peripheral zone (PZ) in pink, the central zone (CZ) in green, the transition zone (TZ) in yellow, the urethral sphincter (US) in brown and the anterior fibromuscular stroma (AFS) in blue. On
the right side of the image, it is possible to see the seminal vesicles, the urethra and the subdivision of the prostate base, midgland and apex into 12 sectors described on Table 2.1. – adapted from [23].
Table 2.1 Acronyms for the 6 sectors repeated on both sides of base, midgland and apex.
Base
AS Anterior fibromuscular stroma
TZa; TZp Anterior (a) and posterior (p) transition zone PZa; PZpl Anterior (a) and posterolateral (pl) peripheral zone CZ Central zone around the ejaculatory ducts
Midportion
AS Anterior fibromuscular stroma
TZa; TZp Anterior (a) and posterior (p) transition zone PZa; PZpm;
PZpl
Anterior (a), posteromedial (pm) and posterolateral (pl) peripheral zone
Apex
AS Anterior fibromuscular stroma
TZa; TZp Anterior (a) and posterior (p) transition zone PZa; PZpm;
PZpl
Anterior (a), posteromedial (pm) and posterolateral (pl) peripheral zone
2.1.2 Anatomy of other relevant structures of the male pelvic complex
The seminal vesicles are two sac-shaped glands, divided into left and right, with about 5 cm long. Each gland has a capsule of both fibrous connective tissue and smooth muscle. The seminal vesicles contribute with about 60% of fluids to the semen [20].
The male urethral sphincter is composed by a continuous muscle around the urethra with variable thickness in cranial to caudal extension [24]. However, it forms a functional subdivision into two muscles, the lisso-sphincter and the rhabdosphincter (Figures 2.2 and 2.3). Whereas the lisso-sphincter (also known as proximal sphincter) is composed of smooth muscle and forms a complete ring around the urethra, the rhabdosphincter (also known as distal sphincter) is composed of skeletal muscle and has a shape of a horseshoe, being thickest around the membranous urethra and less distinct near the bladder (in opposition to the proximal sphincter). The rhabdosphincter configuration may vary from an extended circular shape with over half circumferential orientation with limited proximal-distal length and thickness, to a restricted circular pattern such as a thin arc-like structure [25]. The primary function of the lisso-sphincter is maintaining continence at rest, whereas the rhabdosphincter has a dual genitourinary function, both related with erection and active continence - related with the forceful closure of the urethra in stress conditions [24].
Figure 2.2 Mid-sagittal male anatomy near the bladder and urethra, including a schematic on that section (a) and a magnetic resonance imaging (MRI) high-resolution proton density image on an increased field of view (FOV) (b) - adapted
from [3].
Figure 2.3 Schematic neuroanatomy of the male urethral sphincter complex, including the bladder musculature (1), the perineal membrane (6), the prostate (7), and with particular attention to the following: the proximal (2) and distal (3) parts
The levator ani fascia is composed of smooth muscle tissue, mostly with bulky and multilayered fibers [25]. In most men, it can be observed that the levator muscle is connected by a connective tissue mass with the urethral sphincter, the distal half portion of the prostate and the membranous urethra. Posteriorly to the membranous urethra, this muscle is also connected with the outer layer of the rectum (Figure 2.4).
Figure 2.4 Gross slice of the pelvis showing the levator ani (LA) fascia and the urethral rhabdosphincter (URS). The URS and the puborectalis muscle (PR) are connected by a thick tissue mass (marked with white stars). The PR is also connected to
the outer layer of the rectum (marked with black stars) In this figure it is also possible to observe the dorsal vein complex (DVC) and the MU (membranous urethra) – adapted from [25].
The neurovascular bundles comprise the association of nerves that supply the corpora cavernosa with arterial branches that come from the inferior vesicle artery and with veins [21]. This bundle appears bilaterally to the prostate and its function is intimately related with sexual function.
2.1.3 Prostate conditions
Most men during their lifetime, end up having some condition that affects the prostate. These can be benign, like prostatitis or BPH, or malignant, considering PC. The former is characterized as an inflammation of the prostate that can be caused by bacterial agents, and it is more easily treated through antibiotic administration. The other benign prostate condition, BPH, is mostly related with ageing, affecting more than 50 % of men over 60 years old and about 90% when they reach their eighties [26]. Not only ageing, but also infections and tumors can be a cause for this condition [20]. BPH is characterized by an enlargement of the prostate volume, where the majority of its growth occurs in the TZ. Looking from a molecular perspective, it was found that the prostate enlargement is related with higher concentrations of serum insulin-like growth factor 1.
Normally, BPH is diagnosed through patient history, physical and rectal examinations, investigations to exclude urinary tract infection and renal damage, and urinary flow measurement. Regarding treatment, active surveillance in combination with urodynamic pressure/flow studies are recommended priory to
any kind of invasive treatment that involves the removal of obstructing tissue, such as laser therapy or transurethral resection of the prostate. This procedure takes about 20-30 minutes, considering a gland of 30 g, and has a small mortality rate of around 0.2-0.4 % [26].
Apart from detrusor muscle and bladder overactivity, age-related smooth muscle dysfunction, and neurological factors, prostatitis and BPH are some of the main causes for lower urinary tract symptoms (LUTS) in men. LUTS are not defined as a disease, but rather as a symptom-complex that affects ageing women and men. Main symptoms, that are frequently accepted by the elderly as normal but significantly impact their quality of life, can be categorized into voiding symptoms - including hesitancy in urinating, poor urinary flow, sensation of incomplete bladder emptying, late urine dribbling and prolonged urination - and into storage symptoms - comprising frequent daytime voiding, nocturia, urgency in voiding and involuntary incontinence of urgency.
2.1.4 Prostate cancer
Epidemiology, Detection, Diagnosis and Staging
Prostate cancer is a clinically heterogeneous disease and the most diagnosed cancer in men in the world (Figure 2.5), with approximately 1.4 million incident cases and 381,000 deaths in 2016 [5]. The incidence of PC has been increasing by 40% since 2006, due to a change in the age structure and size of the population, and due to an alteration in the age-specific incident rates. Prostate cancer represents the fifth most common cause of cancer death worldwide, with higher incidence in developed countries [27]. Particularly, while the odds of developing PC are of 1 in 16 for low-middle sociodemographic index countries, these are of 1 in 7 for countries with a high index [5].
Figure 2.5 Absolute incident cases (in 2016) for male subjects, color encoded by cancer type. As we can see, PC (shown in purple) is the most incident cancer in men worldwide, and the one with a higher incidence in men in Portugal – adapted from
[5].
Two risk factors clearly associated with PC are age, with 36.3 % of cancers being diagnosed between 60 to 69 years old [28], and heredity, being PC a polygenic disease. Apart from these, other risk factors may play a role in this condition [29], including race (African individuals are more prone on developing PC), inflammation (having some chronical inflammatory process that may affect the prostate), hormones (specifically, patients that undergo hormonotherapy for suppression of male sexual hormones after puberty have a higher risk of developing PC), metabolic syndrome, diets based on certain vitamins and
circulatory system may increase the change of cellular oxidation) and physical activity (that increases overall quality of life, helping to minimize the risk of PC). Although the prevention is key in decreasing the incidence of some cancers, like lung cancer (through the control of tobacco exposure) and skin cancer (through the reduction of exposure to ultra-violet radiation), in PC the prevention efforts can be less effective. Additionally, the early signs and symptoms of PC are very rare. So, prevention should be done in conjunction with the utilization of early detection methods and better access to treatment. Detection of PC can be assessed by an increase in the prostate specific antigen (PSA) levels in the blood or by textural or consistency changes on the prostate’s posterior aspect of the PZ detected by the digital rectal exam (DRE). Although a PSA threshold of higher than 4.0 ng/mL is commonly used as an indicator for performing a PC diagnosis, PSA values can change with different factors, and there is no such thing as a normal/abnormal PSA test result [30]. For each case, patient characteristics should be incorporated in the evaluation of PSA test results, and the evolution of PSA levels over time should be monitored.
The gold standard for diagnosis remains the biopsy, which consists on the analysis of prostate tissue samples from 10 to 12 different locations in a grid-like pattern, collected via transrectal ultrasound [6]. Then, the pathologist assigns a score, the Gleason grade, that reflects tumor aggressiveness by the sum of a primary score on the largest area of the tumor plus a score on the second largest area, each ranging from 1 (closer to healthy tissue) to 5 (closer to abnormal tissue). For instance, a Gleason score of 3 + 4 (grade 2) is different from a Gleason score of 4 + 3 (grade 3). However, even the ultrasound-guided biopsy has the limitations of undetecting 21-28% of prostate tumors, as well as, of assigning a lower Gleason grade to 14-17% of cases. Combination of biopsies with other techniques, such as, new molecular biomarkers, measurement of PSA levels and multiparametric MRI (mpMRI) – including high resolution T1 and T2 weighted imaging, diffusion weighted imaging (DWI) and dynamic contrast enhanced (DCE) imaging – for a targeted biopsy, can help identify false negative cases. A targeted biopsy, meaning MRI fused with ultrasound, increases the correct stratification of patients, compared with a systematic prostate biopsy. Prostate metastases and PC recurrence – defined as a PSA > 0.2 ng/mL after surgery – are usually diagnosed by cross-sectional body imaging with computed tomography, MRI or positron emission tomography with recently FDA approved radiotracers that have demonstrated activity on PC.
Based on the mpMRI acquisition, a more standardized classification system was introduced in 2012, called the Prostate Imaging Reporting and Data System (PI-RADS) [21]. This classification system provides a score from 1 (very low) to 5 (very high) to each prostate lesion, according to the likelihood of a clinically significant PC. Depending on the prostate region, the PI-RADS category is assigned based on the characteristics of the lesion in a specific MRI sequence (as observed in Figure 2.6), namely, for lesions in the PZ the primary sequence used are the diffusion weighted imaging (DWI) or the apparent diffusion coefficient (ADC), while for the TZ is the T2-weighted imaging. Most prostate tumors (75 to 85%) originate in the PZ [31], that appears as a thin layer of high signal intensity in the T2-weigthed imaging. It is less common (less than 25%) for cancer to be originated in the TZ – an heterogenous region of intermediate signal intensities –, and even less on the CZ or AFS (although tumors originated elsewhere can spread to these regions). The pseudo capsule, that appears as a hypointense line on the T2-weighted imaging, is considered to be useful as a reference to assess the extra prostatic extension of the tumor.
Regarding the interpretation of prostate tumors on the mpMRI, these appear to be hypointense (dark) on the T2-weighted imaging and on the ADC map, and hyperintense (bright) on the DWI. In fact,
malignant cells create a restriction to diffusion (low ADC), translating in a high DWI signal, that is evidenced when using a higher b-value (at least 1400 s/mm2) that improves lesion conspicuity [21].
Figure 2.6 PI-RADS assessment categories for lesions on each prostate region, PZ and TZ, based on the DWI/ADC and the T2-weighted image, respectively. To distinguish between similar lesions, other mpMRI sequences can be used as reference,
such as the DCE image – adapted from [32].
Recent advances on diagnosis techniques, have allowed a better stratification of PC patients by risk, which is key to make a balanced choice on disease treatment [6]. Prostate tumors can be stratified by risk into very low, low, intermediate, high or very high, as proposed by the National Comprehensive Cancer Network. This risk stratification is done by a combination of the biopsy Gleason score, the PSA and the TNM (Tumor, Node, Metastasis) clinical staging – the latter is based on clinical and pathological findings and it is mainly divided into T1 (inapparent tumor), T2 (tumor confined to the prostate), T3 (tumor extends through the prostate capsule), T4 (tumor invades other nearby structures), N0 (absence of regional lymph node metastasis), N1 (metastasis in regional lymph nodes), M0 (no distant metastasis) and M1 (distant metastasis). An accurate biopsy is of crucial importance for a correct risk stratification. Based on the risk stratification assigned to each patient, plus his individual preferences and values, clinicians can guide patients on the decision-making process regarding treatment type.
Treatment of Prostate Cancer
It is normally recommended that patients with a less aggressive prostate tumor, defined as a PSA < 10 ng/mL or a Gleason score of 3 + 3, choose to be in active surveillance for PC [6]. This consists of a combination of techniques to regularly monitor the disease evolution, including PSA testing, physical examinations and prostate biopsies.
On the opposite side, patients with metastatic PC (including regional lymph node or distant metastases) are usually recommended an initial treatment of chemotherapy (using drugs like abiraterone, enzalutamide or others), that is commonly preferred over traditional hormonal therapy, like androgen deprivation therapy.
On the intermediate side, patients with localized PC, with a PSA > 10 ng/mL and nodules palpable on DRE, mostly rely on expectant management, radiation and surgery as the available treatment options. Expectant management comprises both active surveillance and watchful waiting, that consists on treating disease symptoms with a palliative intent. Regarding curative approaches, radiation treatment can be done both by external radiotherapy or brachytherapy (through the implantation of radioactive seeds on the prostate), or through a procedure called RP. The latter has been considered the main choice for locally advanced PC, because of the accuracy in tumor excision [7].
Additionally, curative approaches generally offer a higher life expectancy, which is considered a predominant decision-making factor to patients [33]. Although in the past, RP was not recommended for older patients (>70 years old), this trend has been changing, mainly due to higher survival rates and better functional outcomes, related with increased life expectancy and advances in surgical techniques [34].
Postoperative complications following Radical Prostatectomy
Despite significant improvements in the last years, severe post-surgical complications may still arise from RP, namely urinary incontinence and erectile dysfunction [35], that can significantly reduce the patient’s quality of life. While urinary incontinence is mostly related with the removal of the proximal lisso-urethral sphincter (even in the presence of an intact distal rhabdosphincter) [3], the recovery of erectile dysfunction after RP is mostly associated with the degree of PNFs sparing [36] - since periprostatic autonomic nerves are crucial for erectile function. Despite that, the mechanisms of post-surgical urinary incontinence are still to be stablished, since they are known to be a result of the combined integrity between the proximal and distal sphincters and of surrounding prostate structures, including muscles and fasciae [37]. Urinary incontinence has been reported in 4 to 69 % of patients that undergo RP [1]. This wide range of reported incidence may be due to the evaluation tool used, the length of the follow-up chosen, and mainly, to the definition used to classify incontinence [38]. There are different forms of quantifying the patient’s continence, but traditionally, a definition of using zero pads per day is better correlated with the quality of life after RP [39]. This can be accessed among patients using the international consultation on incontinence questionnaire-short form (ICIQ-SF) score [40], that is presented to the patient at several time points after RP to evaluate the severity of urine leakage and impact on quality of life. Incontinence after RP is likely to emerge from multifactorial causes, including patient characteristics, preoperative continence status, urethral characteristics, detrusor function, and those related with the surgical technique [1]. Particularly, higher surgeon experience has been shown to reduce the rate of postoperative complications [35]. Regarding patient characteristics, the patient age at surgery has been considered a stablished predictor for urinary incontinence recovery. Although some studies have not found a statistically significant trend between post-surgical continence recovery rate and ageing [37], most studies have correlated increasing patient age at surgery with higher risk of urinary incontinence. It was found that while 3% of patients aged below 60 show complete incontinence after surgery, this percentage is more that 20% in patients older than 70 years old [2]. A recent study [34] has found that younger patients (age <= 70 years old) have a higher urinary continence recovery rate after 3 and 12 months, comparing with older patients (age > 70 years old), although the rate gap between age groups has decreased during the study period (2004 to 2015). This same study aimed at defining the
predictor factors of post-surgical urinary incontinence following RP for the two different age groups. They have found that, while different predictors can be used for younger patients, namely, age, robot-assisted RP, prostate volume, membranous urethral length (MUL) and neurovascular bundles’ sparing, only the age and MUL were found to be predictors for continence recovery in older male.
Regarding urethral characteristics, they are the result of sphincter incompetence, changes in urethral length or preoperative strictures [41]. In fact, the proximal sphincter is completely removed during RP, which can explain the high risk of postoperative urinary incontinence. So, post-operative continence mostly relies on the rhabdosphincter [41].
Currently, the available treatment options for post-operative incontinence comprise conservative approaches - pelvic floor exercises or biofeedback -, pharmacotherapy, transurethral bulking agents or artificial urinary sphincter and male slings [1]. However, the goal of the urologic surgeon should be, not on the treatment of postoperative incontinence, but rather on the reduction of its rate, before occurrence [41]. Some studies [42] argue that the solution to reduce the complication should focus on the alteration of the technical aspects of the surgical procedure. For instance, this study [43] has introduced a method for reconstructing the rhabdosphincter during the RP performed with the robotic system. Traditional laparoscopic procedures have been replaced by RALRP, a robotic surgical system offering 7 degrees of freedom, tridimensional magnification and scaling of movements [39]. This technique has been gaining an increased acceptance for the treatment of localized PC - with less blood losses and transfusion rates, better perioperative outcomes and possible faster recovery of urinary continence and erectile function [39].
The TransDouglas project aims at validating the efficacy of a new surgical procedure for RP, which is the improved version of RALRP. This technique, called Retzius-sparing robotic assisted laparoscopic RP, proposed by Galfano [44], spares the retropubic space by passing through the Douglas pouch. By doing that, it is expected a faster postoperative recovery of urinary continence, since most anatomical structures involved in continence remain intact [45]. Particularly, the reduced damage of the PNFs and the preservation of the distal rhabdosphincter can lead to better post-operative outcomes regarding, respectively, erectile function and urinary incontinence.
2.2 Diffusion tensor imaging
Previously, a study [3] has shown the feasibility of visualizing muscle fibers of the prostate sphincters using diffusion tensor imaging (DTI), a useful technique to understand tissue microarchitecture, in terms of fibers integrity and directionality. In this section, a theoretical introduction to DTI is presented, followed by a brief introduction to tractography methods, a popular method used for fiber reconstruction and 3D visualization of fibers, and to different steps of the DTI processing and analysis workflow, including motion and eddy currents correction methods.
2.2.1 Theoretical background
Brownian motion
The terms “Brownian motion” or diffusion can be used to describe the random thermal movement of molecules [46]. Einstein has described mathematically this physical property at a given temperature by Equation 2.1.
〈*+〉 = 6 # . (2.1)
where the first term represents the mean squared displacement of the molecules, # is the diffusion coefficient, a constant that relates diffusive flux to a concentration gradient, and . the diffusion time. The diffusion coefficient (#), accounting for several factors that influence diffusion in living systems, can be referred to as the ADC [47]. The ADC for water molecules at a body temperature of 37° C is 3 × 1034 mm+/s [48]. Considering a diffusion time in the order of milliseconds according to the typical
MR measurement time (10–100 ms) [49], water molecules will travel a distance in the order of micrometers. This displacement is in the same order of magnitude as the cellular dimensions, which makes it possible to access the microstructural properties of biological tissues.
Diffusion weighted imaging
Diffusion weighted imaging (DWI) is sensitive to the Brownian motion of water molecules in biological tissues, and so, it can be used to explore tissues’ microarchitecture [50]. The diffusion-weighted pulse sequence corresponds of two gradients, equal in magnitude, that are applied to the T2-weighed spin-echo sequence (Figure 2.7). These gradients are applied before and after the 180° refocusing radiofrequency pulse, symmetrically centered at it, which is known as the Stejskal-Tanner diffusion encoding [51].
Figure 2.7 The Stejskal-Tanner imaging sequence, where G represents the magnitude of the applied gradient, ! the duration
of each diffusion gradient and ∆ the duration between the application of the two gradients - adapted from [52].
Whereas the first applied gradient is responsible for a phase shift in proton spins, the second one will be cancelling the gained phase shift for stationary molecules. However, diffusing molecules will not allow the rephasing by the second gradient, since they are changing position during its application [50]. Faster molecules travel a wider distance, which will translate in more signal loss which is represented by darker image voxels [53]. So, image contrast in DWI is based on the differences in diffusion magnitude. The diffusion-weighted contrast can be described by the Stejskal-Tanner equation (Equation 2.2) which explains the signal intensity decrease due to Gaussian diffusion.
89= 8: ;3 < =>?@ (2.2)
where 89 refers to the diffusion-weighted signal intensity at a given voxel with gradients applied along direction i, 8: refers to the original signal or the diffusion-weighted signal intensity when no gradients are applied, the b-value refers to the LeBihan’s factor [54] that describes the diffusion sequence, gradient strength and physical constant, and A#B9 is the A#B at direction C. For rectangular gradient pulses, the b-value can be obtained by Equation 2.3.
D = E+ F+ !+ G∆ − I
4J (2.3)
where E is the gyromagnetic ratio, F the gradient’s amplitude, ! the duration of each diffusion gradient and ∆ the duration between the application of the two gradients.
It is important to note, using Stejskal-Tanner equation, that an increase in the b-value increases the degree of diffusion weighting and it is related with a loss of signal intensity along the direction of the applied gradients.
Anisotropy vs isotropy
Depending on tissues’ properties – type, integrity, architecture and presence of barriers – water molecules will present different diffusivity behaviors [14]. The water molecules in a wider space move randomly in all directions, known as isotropic diffusion. On the other hand, if the movement is confined along a particular direction and molecules will no longer move equally in all directions, it is called anisotropic diffusion. The example of the brain can be used for a better analogy, where the water molecules in the cerebrospinal fluid have an isotropic movement and in the white matter this movement is anisotropic. Whereas in the first case, the diffusion is similar in all directions, in the second, the diffusion is higher along the tract but reduced in the other directions. So, there is a need of applying gradients in more than one diffusion-encoding directions to characterize anisotropic diffusion. These directions should be noncollinear, that is, not applied on the same line.
Diffusion tensor
In order to understand the anisotropy profile in 3D, the acquisition of at least six image sets in noncollinear directions - and one baseline image for a null b-value - is needed. Having six different signal intensities for noncollinear gradient directions, allows the utilization of a multivariate linear regression to calculate the diffusion tensor (Figure 2.8). The diffusion tensor provides a rotationally invariant description of the shape of water diffusion and uses a Gaussian model [53].
about direction and magnitude of diffusion, by relating the measured signal with the applied gradient. This technique is highly sensitive to changes in diffusion, which allows to indirectly infer about biological tissues’ micro- and macro- structure and tissue orientation.
Figure 2.8 From diffusion image to tensor. Note that we only need to apply the gradient in six different directions to generate a 3 x 3 matrix, because #KL= #LK, #KM= #MK and #LM= #ML - adapted from [56].
Diffusion tensor metrics
From the diagonalization of the diffusion tensor, three orthogonal eigenvectors (;OOO⃗, ;N OOO⃗, ;+ OOO⃗) and three 4
positive eigenvalues (RN, R+, R4) are obtained [53] (Figure 2.9). The eigenvectors reflect the diffusion direction (for instance, ;OOO⃗ is the major eigenvector which points in the direction of fastest diffusion), N whereas the rotationally invariant eigenvalues reflect the length of diffusion. RN, also called the axial
diffusivity (AD), is the principal eigenvalue since it reflects the magnitude of greatest diffusion (Equation 2.4). The second and third eigenvalues (R+ and R4, respectively) can be averaged to obtain the radial diffusivity (RD), the contribution of diffusion in the transverse plane (Equation 2.5). Other combinations of eigenvalues can be performed to calculate useful metrics of diffusion, including the mean diffusivity (MD) and fractional anisotropy (FA). MD can be calculated as the mean of the three eigenvalues, reflecting the total amount of diffusion for each voxel (Equation 2.6). The most widely used measure for quantifying the degree of anisotropy in each voxel, FA [57], is able to characterize the microstructural integrity of biological tissues (Equation 2.7). FA ranges from 0 and 1, meaning maximal isotropic diffusion and maximal anisotropic diffusion, respectively. In other words, FA gives how far the tensor is from a sphere. Color-coded FA maps [58] can be generated by assigning a color accordingly to the principal diffusion direction (red to left-right, green to anterior-posterior, and blue to superior-inferior). By combining the directional information of individual voxels main tracts are reconstructed.
Figure 2.9 Different shapes of the diffusion tensor, and its relationship with diffusion eigenvalues - adapted from [56].


![Figure 2.7 The Stejskal-Tanner imaging sequence, where G represents the magnitude of the applied gradient, ! the duration of each diffusion gradient and ∆ the duration between the application of the two gradients - adapted from [52]](https://thumb-eu.123doks.com/thumbv2/123dok_br/15466785.1032853/26.892.148.770.894.1053/stejskal-sequence-represents-magnitude-gradient-diffusion-application-gradients.webp)

![Figure 3.3 Evolution on the density of striated muscle cells of rhabdosphincter with age, both in males and females – adapted from [111].](https://thumb-eu.123doks.com/thumbv2/123dok_br/15466785.1032853/38.892.286.606.851.1063/figure-evolution-density-striated-muscle-rhabdosphincter-females-adapted.webp)