Faculdade de Medicina da Universidade de Lisboa
Original ThesisMaster in Metabolic Diseases and Eating Disorders
Predictors of Early Readmission in Chronic Heart
Failure
REFERENCE
(pREdictors oF Early REadmission iN Chronic hEart failure)
Mário Augusto Rodrigues Teixeira Barbosa, MD
Coordinator: Luiz Filipe Menezes Falcão, MD, PhD
Faculdade de Medicina da Universidade de Lisboa
Predictors of Early Readmission in Chronic Heart
Failure
REFERENCE
(pREdictors oF Early REadmission iN Chronic hEart failure)
Mário Augusto Rodrigues Teixeira Barbosa, MD
Coordenador: Luiz Filipe Menezes Falcão, MD, PhD
Dissertação elaborada para obtenção do grau de Mestre em Doenças Metabólicas e Comportamento Alimentar
A impressão desta dissertação foi aprovada pelo Conselho Científico da Faculdade de
Medicina de Lisboa em reunião de 19 de Fevereiro de 2019
Ser Médico é deixar de pertencer a ti próprio,
deixar de pertencer aos teus amigos,
à tua família e passar a pertencer
à grande família…
a Humanidade.
INDEX
1. SUMMARY ... 1
2. RESUMO ... 2
3. ABBREVIATIONS AND ACRONYMS ... 6
4. INTRODUCTION... 8
5. FUNDAMENTALS ... 10
5.1. THE IMPACT OF CHRONIC HEART FAILURE READMISSIONS ... 11
5.2. THE IMPORTANCE OF BIOMARKERS ... 12
6. METHODS ... 14
6.1. STUDY POPULATION ... 14
6.1.1. RECRUITMENT, ENROLLMENT PERIOD, AND SAMPLE SIZE ... 14
6.1.2. INCLUSION CRITERIA... 14 6.1.3. EXCLUSION CRITERIA ... 14 6.2. STUDY DESIGN ... 14 6.2.1. STUDY DESIGN... 14 6.2.2. ENDPOINTS ... 14 6.3. STUDY PROCEDURE ... 15 6.3.1. STUDY PATIENTS ... 15 6.3.2. MASKING ... 15 6.3.3. EXAMS... 15 6.3.4. BLOOD SAMPLES ... 16
6.4. DATA COLLECTION INSTRUMENTS ... 17
6.5. STATISTICAL METHODS ... 17
6.5.1. STUDY ENDPOINTS ... 17
6.5.2. GENERAL STATISTICAL METHODS ... 18
6.5.2.1. Descriptive Analysis ... 18
6.6. COMPLIANCE STATEMENTS ... 19
6.6.1. GENERAL REQUIREMENTS ... 19
6.6.2. SUBJECT INFORMATION AND INFORMED CONSENT ... 19
6.6.3. CLINICAL STUDY RESULTS AND PUBLICATION ... 19
6.6.4. DATA CONFIDENTIALITY AND DATA PROTECTION ... 19
7. DEFINITIONS ... 20
8. RESULTS ... 21
8.1. BASELINE CHARACTERISTICS ... 21
8.1.1. READMISSIONS ... 21
8.1.2. MORTALITY ... 21
8.2. DISEASE RELATED DETERMINANTS ... 22
8.2.1. HOSPITALIZATIONS ... 22
8.2.2. ETIOLOGY ... 23
8.2.3. LEFT VENTRICULAR EJECTION FRACTION ... 23
8.2.4. REDUCED RIGHT VENTRICULAR FUNCTION ... 23
8.2.5. OTHER ECHOCARDIOGRAPHIC FINDINGS ... 24
8.2.6. REFRACTORY SIGNS OF CONGESTION ... 24
8.2.7. THERAPEUTICS ... 25
8.2.8. MODIFIABLE CARDIOVASCULAR RISK FACTORS- THE METABOLIC SYNDROME ... 25
8.2.9. OTHER RISK FACTORS ... 26
8.2.9.1. Blood Pressure ... 26
8.2.9.2. Renal Function ... 29
8.2.9.3. Atrial Fibrillation ... 34
8.2.9.4. Bundle Branch Block ... 34
8.2.9.5. Hyponatremia ... 35
8.2.9.6. Free Thyroxine ... 35
8.2.9.7. Anemia and Iron Deficiency ... 35
8.2.9.8. Red Cell Distribution Width ... 37
8.2.9.9. Erythropoietin ... 38
8.3. BIOMARKERS ... 40
8.3.2. TROPONINS ... 41
8.3.3. GALECTIN-3 ... 42
8.3.4. PRO-ADM ... 45
8.3.5. ST2 ... 46
8.3.6. Receiver-Operator Characteristic (ROC) ANALYSIS ... 48
9. DISCUSSION ... 51
9.1. DISEASE RELATED DETERMINANTS ... 52
9.1.1. ETIOLOGY ... 53
9.1.2. LEFT VENTRICULAR EJECTION FRACTION ... 53
9.1.3. NYHA FUNCTIONAL CLASS ... 54
9.1.4. REDUCED RIGHT VENTRICULAR FUNCTION ... 55
9.1.5. OTHER ECOGRAPHIC FINDINGS ... 55
9.1.6. REFRACTORY SIGNS OF CONGESTION ... 55
9.1.7. THERAPEUTICS ... 55
9.2. HIGH RISK PATIENTS’ PROFILE ... 57
9.2.1. NON MODIFIABLE CARDIOVASCULAR RISK FACTORS ... 57
9.2.2. MODIFIABLE CARDIOVASCULAR RISK FACTORS- THE METABOLIC SYNDROME ... 58
9.2.3. OTHER RISK FACTORS ... 60
9.2.3.1. Blood Pressure ... 60
9.2.3.2. Renal Function ... 61
9.2.3.3. Atrial fibrillation ... 62
9.2.3.4. Bundle Branch Block ... 62
9.2.3.5. Hyponatremia ... 63
9.2.3.6. Free Thyroxine ... 63
9.2.3.7. Anemia and Iron Deficiency ... 64
9.2.3.8. Red Cell Distribution Width ... 67
9.2.3.9. Erythropoietin ... 67
9.2.4. BIOMARKERS ... 69
9.2.4.1. Brain Natriuretic Peptides ... 69
9.2.4.2. Troponins ... 71
9.2.4.3. Galectin-3 ... 73
9.2.4.4. Pro-ADM ... 75
11. STRATEGIES TO DECREASE READMISSIONS AND MORTALITY ... 81 12. CONCLUSIONS ... 84 13. REFERENCES ... 86 14. FUNDING ... 104 15. ACKNOWLEDGMENTS ... 105 16. ATTACHMENTS ... 107
INDEX OF TABLES
Table 1 - Primary endpoints ... 17
Table 2 - Baseline characteristics ... 49
INDEX OF FIGURES
Figure 1 - Long-term mortality - Kaplan Meier: Gender ... 22Figure 2 - Baseline comparison of subjects by short-term mortality status: Hepatomegaly ... 25
Figure 3 - Short-term mortality - Kaplan Meier: Systolic blood pressure <100 mmHg ... 27
Figure 4 - Baseline comparison of subjects by long-term mortality status: Systolic blood pressure ... 28
Figure 5 - Baseline comparison of subjects by short-term mortality status: Diastolic blood pressure ... 29
Figure 6 - Baseline comparison of subjects by short-term mortality status: Chronic kidney disease ... 30
Figure 7 - Baseline comparison of subjects by short-term mortality status: Admission creatinine... 31
Figure 8 - Short-term mortality - Kaplan Meier: Cardiorenal syndrome ... 33
Figure 9 - Short-term mortality - Kaplan Meier: LBBB ... 34
Figure 10 - Baseline comparison of subjects by early rehospitalization status: Hemoglobin ... 36
Figure 11 - Short-term mortality - Kaplan Meier: Serum ferritin <100 ng/mL ... 37
Figure 12 - Baseline comparison of subjects by early rehospitalization status: RDW ... 38
Figure 13 - Baseline comparison of subjects by long-term mortality status: EPO ... 39
Figure 14 - Baseline comparison of subjects by long-term mortality status: Admission NT-proBNP ... 40
Figure 15 - Baseline comparison of subjects by long-term mortality status: Discharge NT-proBNP ... 41
Figure 16 - Long-term mortality - Kaplan Meier: hsTnT ≥52 ng/L ... 42
Figure 17 - Baseline comparison of subjects by early rehospitalization status: Gal-3 ... 43
Figure 18 - Short-term mortality - Kaplan Meier: GAL3 ≥10.97 ng/mL ... 44
Figure 19 - Long-term mortality - Kaplan Meier: GAL3 ≥9.99 ng/mL ... 45
Mário Barbosa Página | 1
1. SUMMARY
The present thesis is based on the premise that chronic heart failure patients have a high morbidity and mortality due to the fact that cardiac insufficiency per se evolves inexorably, and that it affects an elder and frail population, suffering from multiple pathologies, polymedicated and even socio-economically vulnerable.
The increase of life expectancy, inherent to the improvement of health care, determined a parallel augment of chronic heart failure patients.
Albeit we have assisted to a consistent decline in the rate of heart failure hospitalizations, surprisingly, short-term readmission and mortality persist high, irrespective of clinical innovations and guideline directed management, representing a tremendous health care burden.
It urges to define a short-term prognosis for these patients in order to reduce the readmission and premature mortality rates due to its socio-economic impact.
The main purpose of this dissertation is to characterize at risk patients for early (defined as a period of 90 days post-discharge) readmission, due to heart failure, and overall death.
The putative role of biochemical cardiovascular markers in clinical decision making, principally in recognizing high risk patients that could benefit from therapeutic intensification and stricter surveillance is also addressed.
To characterize the population we addressed disease related risk factors [namely the etiology, the New York Heart Association Functional (NYHA) Class, left ventricular ejection fraction (LVEF), right ventricular function, signs and symptoms], non-modifiable cardiovascular risk factors, modifiable cardiovascular risk factors, comorbidities [chronic kidney disease (CKD), anemia, iron deficiency, thyroid function], therapeutic and biomarkers [specifically troponins, proBNP-Aminoterminal B-type Natriuretic Peptide (NT-proBNP),
Galectin-3 (Gal-3), Suppression of Tumorigenicity 2 (ST2), Mid-Regional pro-Adrenomedullin (pro-ADM)] and Erythropoietin (EPO).
Key words:
Mário Barbosa Página | 2
2. RESUMO
A presente tese baseia-se na premissa de que os doentes que padecem de insuficiência cardíaca crónica apresentam uma morbilidade e mortalidade elevadas fruto da evolução per se inexorável da insuficiência cardíaca e do facto de afetar uma população maioritariamente idosa, frágil, que sofre de múltiplas patologias, polimedicada e, inclusive, socioeconomicamente desprovida.
O aumento da esperança de vida, inerente à melhoria dos cuidados de saúde, determinou um incremento paralelo da prevalência da insuficiência cardíaca crónica.
Apesar de se ter assistido a um declínio das taxas de internamento por insuficiência cardíaca, surpreendentemente, as taxas de reinternamento e mortalidade precoces mantêm-se elevadas, independentemente dos avanços clínicos e abordagem em conformidade com as directrizes preconizadas, sobrecarregando tremendamente o sistema de saúde.
Atendendo ao seu impacto socioeconómico urge definir o prognóstico a curto prazo destes doentes a fim de reduzir a taxa de readmissão e mortalidade precoces.
Trata-se de um estudo de coorte prospetivo observacional, unicêntrico, com um único braço, de utilidade diagnóstica.
O objetivo principal do estudo foi caracterizar os doentes de risco para readmissão e mortalidade precoces (definido como o período até 90 dias pós-alta) por insuficiência cardíaca.
Apesar do propósito deste estudo ser, primeiramente, definir o prognóstico a curto prazo da insuficiência cardíaca, o seguimento prolongado permitiu-nos caracterizar, também, a mortalidade a longo prazo.
Consideramos a mortalidade global atendendo a que a maioria dos doentes não faleceu no hospital, pelo que não tivemos acesso às certidões de óbito.
O objetivo secundário foi avaliar a importância de biomarcadores emergentes no prognóstico da insuficiência cardíaca.
Para caracterizar a população abordamos fatores de risco relacionados com a insuficiência cardíaca per se (nomeadamente a etiologia, a classe funcional da NYHA, a fração de ejecção do ventrículo esquerdo, a função do ventrículo direito, sinais e sintomas), fatores de risco cardiovasculares não-modificáveis, factores de risco cardiovasculares modificáveis, comorbilidades (tais como a doença renal crónica, a anemia, a deficiência de ferro, a função tiroideia), a terapêutica e biomarcadores (troponinas, NT-proBNP, galectina-3, ST2, pro-ADM e EPO).
Os critérios de inclusão foram:
admissão por insuficiência cardíaca classe III ou IV de NYHA;
idade igual ou superior a 18 anos. Os critérios de exclusão foram:
Mário Barbosa Página | 3
óbito no primeiro internamento;
alta contra-parecer médico;
doença renal crónica com uma taxa de filtração glomerular <30 ml/min/1.73 m2 [calculada através da fórmula Modification of Diet in Renal Disease (MDRD)] ou sob técnica de substituição renal;
doença hepática moderada a grave;
neoplasia ativa com ou sem metástases.
Foram recrutados 70 doentes dos quais 5 foram excluídos por lhes ter sido diagnosticado neoplasia ativa. O recrutamento teve a duração de 12 meses, começando (primeiro participante) a 19/11/2015.
Os participantes foram seguidos até 30/09/2017 ou até à data de óbito. Todos os participantes assinaram um consentimento informado. Os métodos estatísticos utilizados foram:
Análise Descritiva:
As varáveis contínuas foram sumarizadas por média, mediana, desvio padrão, 1º e 3º quartis, intervalo interquartil e mínimo/máximo.
A comparação entre pacientes foi realizada para todas as variáveis utilizando o t test ou o Wilcoxon Rank test conforme aplicável.
As variáveis categóricas foram sumarizadas por frequências relativas e absolutas, e comparadas mediante o teste qui quadrado ou o teste exacto de Fisher, conforme aplicável.
Consideraram-se como variáveis de estratificação:
a readmissão precoce;
a mortalidade precoce;
mortalidade a longo prazo.
Utilizou-se o Shapiro-Wilk test para avaliar a normalidade das variáveis contínuas.
Análises de Objetivos Primários:
Para se avaliar os objetivos primários deste estudo, efectuou-se uma análise de sobrevivência para cada um dos pontos de interesse (i.e. readmissão precoce, mortalidade precoce e mortalidade a longo prazo), utilizando curvas de sobrevivência de Kaplan Meier.
Aplicou-se o teste Log rank para comparar probabilidades de sobrevivência para cada uma das referidas variáveis.
Um modelo univariável de Cox (proporcionalidade das funções de risco) foi usado para se obter Hazard Ratios (HR) e intervalos de confiança de 95% para cada variável.
Utilizaram-se os resíduos de Schoenfeld para testar os hazards proporcionais. Todas as análises foram conduzidas com um nível de significância global de 5%.
Mário Barbosa Página | 4 Não se efetuou imputação de dados em falta.
Não se fizeram ajustes para multiplicidade.
Toda a análise estatística foi realizada com o programa R Statistical Software version 3.4.3.
Atendendo a que alguns dos biomarcadores estudados não têm cut-offs definidos utilizou-se a Area Under the Curve Receiver-Operator Characteristic (AUCROC) conforme definida por Hand e Till.
O cut-off adequado para cada biomarcador foi definido usando o Índice de Youden. Da análise estatística concluiu-se que o seguimento mediano foi de 13.7 (6.7-18.9) meses. A idade média da população estudada foi 79.2 ±10.8 anos.
A amostra foi constituída maioritariamente por participantes do sexo feminino (56.9%). Salientamos que a fração de ejecção média foi de 50.38 ± 19.07 %.
A taxa de readmissão aos 30 dias pós-alta foi de 15.4% e aos 90 dias de 33.8%, em sintonia com dados nacionais.
A mortalidade aos 30 dias pós-alta foi de 10.8% e aos 90 dias de 18.5%, também de acordo com a literatura. Destacamos que a mortalidade anual foi de 36.9% e no fim do seguimento [mediana 13.7 (6.7-18.9) meses]
40% dos participantes tinha perecido.
Estes dados espelham a gravidade clínica dos doentes que padecem de insuficiência cardíaca. O internamento médio foi de 8.3 dias, o que, também, reflecte a complexidade dos casos abordados.
Os doentes com vários internamentos, com maior número de dias de internamento acumulado e com internamentos prolongados tiveram pior prognóstico.
De acordo com os resultados obtidos, o doente de risco para readmissão e morte no período crítico dos 90 dias após alta, é idoso e sofre de várias comorbilidades, nomeadamente doenças metabólicas.
Curiosamente, a obesidade correlacionou-se com um melhor prognóstico.
Das várias comorbilidades de que padecem os doentes com insuficiência cardíaca, verificamos que a insuficiência renal se correlacionou com todos os objetivos primários visados.
Salientamos que a síndrome cardiorenal tipo 1 determinou um risco acrescido de mortalidade precoce e a longo prazo.
A anemia e a ferropenia absoluta condicionaram o prognóstico, sendo que valores elevados do estimulador da hematopoiese, eritropoeitina, se correlacionaram com a mortalidade precoce e a longo prazo.
O índice de dispersão eritrocitário, frequentemente negligenciado na estratificação do risco do doente com insuficiência cardíaca, apresentou-se como um interessante preditor de mau prognóstico para a readmissão e mortalidade precoces e para a mortalidade tardia.
A fracção de ejecção do ventrículo esquerdo revelou-se um preditor de mortalidade a longo prazo nos doentes com fracção de ejeção reduzida, e apresentou uma tendência para a readmissão e mortalidade precoces no mesmo subgrupo.
Mário Barbosa Página | 5 A avaliação de elementos ecocardiográficos (pressão sistólica da artéria pulmonar, excursão sistólica do plano do anel tricúspide e ausência de colapso da veia cava inferior) permitiu a identificação de uma relação entre disfunção sistólica do ventrículo direito e pior prognóstico.
Estes dados corroboram a impressão que apesar da importância lapidar da função do ventrículo esquerdo, a avaliação da função ventricular direita acrescenta informação valiosa para a estratificação do risco dos doentes com insuficiência cardíaca.
Potenciais causas de hipoperfusão, tais como a hipotensão sistólica e diastólica foram marcadores de mau prognóstico para mortalidade precoce e a longo prazo.
O péptido natriurético NT-proBNP, apontado na literatura, essencialmente, como adjuvante no diagnóstico, destacou-se como um preditor fidedigno de mortalidade precoce e a longo prazo, por correlação positiva. A troponina ultra-sensível (hsTnT) revelou-se um preditor de mortalidade a longo prazo, por correlação positiva, e quando associada a valores elevados de NT-proBNP agravou o risco de readmissão precoce. Ressalvamos que os biomarcadores supracitados, quando avaliados por separado não se correlacionaram com a readmissão precoce, mas a aferição conjunta ditou um risco acrescido desse objetivo primário.
A Gal-3 foi um marcador de mau prognóstico para a readmissão e mortalidade precoces e para a mortalidade tardia.
Quanto ao ST2 foi um preditor de mortalidade a longo prazo.
Não se estabeleceu qualquer relação com significado estatístico com a pro-ADM, possivelmente pelo facto da amostra ser relativamente pequena.
Cremos que o nosso estudo poderá contribuir para a definição do doente de risco com insuficiência cardíaca no período crítico dos 90 dias após a alta clínica.
Palavras-chave:
Mário Barbosa Página | 6
3. ABBREVIATIONS AND ACRONYMS
ACC - American College of Cardiology ACE - Angiotensin-Converting-Enzyme ADHF - Acute Decompensated Heart Failure ADQI - Acute Disease Quality Initiative AF - Atrial Fibrillation
AHA - American Heart Association ARB - Angiotensin Receptor Blocker AUC - Area Under the Curve
BB - Beta Blocker BMI - Body Mass Index
BNP - B-type natriuretic peptide CHF - Chronic Heart Failure CI - Confidence Interval
CKD - Chronic Kidney Disease cTnI - Cardiac Troponin I cTnT - Cardiac Troponin T CV - Cardiovascular
EAS - European Atherosclerosis Society ECG - 12-lead electrocardiogram
EDTA - Ethylenediaminetetraacetic Acid
ELISA - Enzyme-Linked Immunosorbent Assay EPO - Erythropoietin
ESC - European Society of Cardiology ESH - European Society of Hypertension FT3 - Free Triiodothyronine
FT4 - Free Thyroxine Gal-3 - Galectin-3
GFR - Glomerular Filtration Rate HR - Hazard Ratio
HF - Heart Failure
HFSA - Heart Failure Society of America
HFmrEF - Heart Failure with Mid-Range Ejection Fraction HFpEF - Heart Failure with Preserved Ejection Fraction
Mário Barbosa Página | 7
HFrEF - Heart Failure with Reduced Ejection Fraction hsTnT - Highly Sensitive Troponin T
IDF - International Diabetes Federation IL - Interleukin
LBBB - Left Bundle Branch Block LV - Left Ventricular
LVEF - Left Ventricular Ejection Fraction
MR-proADM - Mid-Regional pro-Adrenomedullin MRA - Mineralocorticoid Receptor Antagonist NPV- Negative Predictive Value
NT - proBNP- Aminoterminal B-type Natriuretic Peptide NYHA - New York Heart Association
PASP - Pulmonary Artery Systolic Pressure PPV - Positive Predictive Value
RBBB - Right Bundle Branch Block RDW - Red Cell Distribution Width ROC - Receiver-Operator Characteristic SD - Standard Deviation
ST2 - Suppression of Tumorigenicity 2
TAPSE - tricuspid annulus plane systolic excursion TSH - Thyroid Stimulating Hormone
USA - United States of America WHO - World Health Organization
Mário Barbosa Página | 8
4. INTRODUCTION
The current European guidelines define heart failure (HF) as an alteration of the cardiac structure or function resulting in a deficient oxygen intake to the tissues, despite adequate filling pressures (or solely at expenses of high filling pressures), which is clinically characterized by a constellation of symptoms and typical signs.1 It is estimated that around 15 million europeans2 and 6 million americans3 suffer from chronic heart failure (CHF), moreover the prevalence is superior to 10% in the population over 70 years of age.4
Although we have witnessed a decrease in hospitalization due to CHF of about 30.5% in the last decade, the rehospitalization rate dropped just 9.7% in the same time period.5,6
Up to 25% of patients with HF are readmitted in the first 30 days after hospital discharge7,8 and approximately 30% are readmitted 60 to 90 days post-discharge9,10 despite management consentaneous with the preconized guidelines and evidence based, diagnostic advances, innovative drugs and new therapeutic devices.
Adding to this matter is the mortality rate 60 to 90 day post-discharge of about 15%.8
Decompensated HF requiring hospitalization is a serious condition which progresses with high mortality and high readmission rates.
Strikingly, the 10-year mortality for patients newly admitted with HF is estimated to be around 100%.11 Due to its poor outcome, HF could be considered a “malignant condition”.12
Patients with HF are mostly elderly, with multiple comorbidities, namely metabolic diseases, and are polymedicated, showing a readmission and mortality rate at 90 days of discharge, respectively 8 and 11 times higher than the general population.13
Most of these diseases are both the primum movens and independent risk factors, as HF etiology determines its prognosis.
According to the Prevalence of Chronic Heart Failure in Southwestern Europe (EPICA) trial, the estimated prevalence of CHF, in Portugal, between the ages of 20 and 50 is 1.36%, peaking to 16% in the population older than 80 years.14,15
The EPICA investigators also found that two-thirds of HF patients are hospitalized, in average, twice in a year and that 20 to 30% are readmitted within three months of hospital discharge.14,15
Given the complexity and prevalence of the HF syndrome, it is mandatory to discriminate high risk patients that can benefit from a thorough assessment and define effective diagnosis and prognosis strategies.
Early readmissions are mainly related with volume overload, while later rehospitalizations are the consequence of the inexorable progression of this syndrome, which is inherently linked to cardiac remodeling. 16
Mário Barbosa Página | 9 Ergo, the first three months post-discharge are crucial in HF’s evolution, and since the short-term prognosis has failed to improve over the past decade despite updated management, one should intervene assertively in this golden period.
Mário Barbosa Página | 10
5. FUNDAMENTALS
A policy statement from the American Heart Association (AHA) underlines that the number of HF patients is expected to duplicate until 2030 and consequently its social impact.17
Hospitalization for HF represents a major burden on healthcare services worldwide, and is a strong predictor of increased mortality, particularly, in the first months post-discharge.18
Heart failure is the leading cause of admission in Europe and in the United States of America (USA), accounting for 1 to 2% of all hospitalizations.16
Furthermore, around 30% of these patients require rehospitalization within 60 to 90 days.19
The National Heart Failure Audit of almost 57 000 hospitalizations in England and Wales, from 2014 to 2015, showcased an in-hospital mortality of 9.6%, a 30-day mortality of nearly 20% and a mortality at one year of 30%. Unfortunately, the reported rates did not improve for the past six years.20
Despite the socio-economic relevance that the characterization and acknowledgement of rehospitalizations due to HF may yield, national trials focusing this topic are scant, thus this study could render a little contribution to this matter.
The EPICA trial, dating from 2002, is the only Portuguese HF prevalence study, so, given the substantial social, economic and cultural changes in our country in the past two decades it is crucial to understand the new trends of this overwhelming syndrome.
The Portuguese Consensus Statement for the improvement of HF, released in 2017, recognized that, regardless of HF prevalence, general population and politicians are not aware of its social importance.21 The EPICA study estimated a 4.36% HF global prevalence, varying from 1.36% between the ages of 25-49, to 16.14% in the population over 80 years of age.
However, the ageing of the population led to an inevitable increase in HF’s prevalence, and based on the 2011 Portuguese Census, there is an estimated 380 000 HF patients in Portugal.22
Relying on recent Portuguese Health System official data, HF as the primary diagnosis represents the second highest hospital burden, being responsible for 182 512 hospitalization days corresponding to 18 588 patients, with a mean hospital stay of 9.8 days and an in-hospital mortality of 12.5%.23
Still, these numbers are underestimated as HF is often neglected when classified as a secondary diagnosis.24 From 2004 to 2012 the number of HF admissions in Portugal increased 33% and the readmission rate, especially at 30 (14.6%) and 60 days, also rose.25
Twenty years ago HF hospitalizations in Portugal represented a sum of around 24 million euros, nowadays the economic impact is surely higher given its increasing prevalence and prolongation of HF patients’ survival.26
Mário Barbosa Página | 11
5.1. THE IMPACT OF CHRONIC HEART FAILURE READMISSIONS
The increase in life expectancy generated what probably is the greatest challenge in modern medicine: to prolong the quantity of life while preserving the quality of life.27
The evolution towards chronicity of the most prevalent illnesses in the western world, and the consistent increase of survival in patients with chronical illnesses implies, inevitably, an enhanced hazard of readmissions due to acute decompensation.
Ageing of the population due to the prolongation of life span of patients with chronic conditions, inherent to the improvement in health care, has led to an increase in the prevalence of HF, making this disease a major and growing public health problem.
According to the latest European guidelines, HF has an estimated prevalence of 1 to 2% in the adult population. The percentage of HF patients increases with age, affecting at least 10% of the individuals aged 70 years or older.1
The acute pathologies, with emphasis towards infectious diseases, exacerbation of comorbidities, non-compliance to evidence-based therapies, clinical inertia/ patient under-treatment, complications associated to treatment, the inevitable evolution of some chronic diseases, the clinical and socio-economical fragility of the more advanced age groups, represent the main causes of chronic disease decompensation.
Acknowledging the precipitants of chronic illnesses decompensation, describing risk factors correlated to hospital readmission is fundamental.
Hospital readmission entails an expenditure of resources, being considered a quality parameter of the provided healthcare.28
High readmission rates translate into an increase in hospital expenses, a decline in provided care quality and are related to high hospital mortality percentages.29
In-hospital mortality rates are greater in readmitted patients, given the fact that readmissions often represent more severe clinical scenarios.30
The definition of hospital readmission is not consensual, determining great disparity among series (the percentage of readmissions in the USA for adult individuals varies between 5% and 29%).30
Readmission is defined as a new hospitalization occurring in a period of 1, 2, 4 or 12 months after discharge.31
Regardless of the generalized use of the readmission rate to ascertain the quality of healthcare, there is evidence that maybe it is not a reliable evaluation criterion.32
Such occurs due to the multiplicity of conditionings that envelop readmission.
Apart from patient characteristics, such as age, gender, comorbidities,29 hospital characteristics affect as well the readmission rate.33
Mário Barbosa Página | 12 Ansari et al., divulged that central hospitals have a higher readmission rate, since by being more specialized, receive more complex patients and with higher clinical severity, hence more prone to being readmitted.34 Kossovsky et al., disclosed that HF readmissions would be more related to the clinical and demographics characteristics rather than hospital care quality.35
A study addressing the same issue did not find a correlation between this parameter and hospital provided care.36
The understanding of the determining factors for rehospitalizations may contribute to outline strategies capable of reducing readmissions and consequently the costs related to healthcare.37
The identification of hospital readmission risk factors may improve, as well, the performance of healthcare practitioners and therefore the prognosis of chronic patients.
5.2. THE IMPORTANCE OF BIOMARKERS
Clinical judgement, the cornerstone of medical praxis is enhanced by imaging and biological diagnostic tests.
Eugene Braunwald, a decade ago, produced a meticulous review addressing the increasing importance of biomarkers in the management of HF, anticipating a multi-marker strategy for HF risk stratification.38
Since then, scientific advance has brought us several physiopathological biomarkers of HF.
Despite its undisputed utility, most of these biomarkers are expensive and are not available in most laboratories which limit its application in a daily basis.
Besides, some lack a well-consolidated threshold.
Multiple cardiovascular disorders provoke myocyte sustained injury leading to cardiac remodeling which stimulates proliferation of interstitial fibroblasts and biosynthesis of extracellular matrix components, culminating in cardiac fibrosis.
Beyond its diagnostic, prognostic and, eventual, therapeutic monitoring use, many researchers have explored its value in the inhibition of cardiac remodeling, raising the possibility of novel therapeutic targets.
The overwhelming amount of data exploring this topic favors natriuretic peptides as the most reliable diagnostic predictors.
Nonetheless, promising novel biomarkers, namely galectin-3, mid-regional pro-adrenomedullin and ST2 seem to be superior to the traditional natriuretic peptides concerning prognosis.
Furthermore, a multi-marker strategy appears to yield additional information, as current data alludes a synergism between natriuretic peptides and the cited biomarkers.
Mário Barbosa Página | 13 Ideally, a marker should fulfill the following criteria: accuracy warranting a precise identification of at risk subjects; reliability which represents the ability of reproducing consistently the results; and therapeutic importance with early intervention.40
The vast consistent data addressing emerging cardiac fibrosis markers as adjunctive to conventional clinical risk factors and natriuretic peptides dosing, led the American College of Cardiology (ACC)/ American Heart Association to grant ST2 and Gal-3 evaluation a class II recommendation for CHF prognosis, in 2013.41 Heart failure management through biological markers is based on the assumption that variations over time reflect clinical improvement or disease progression. Yet, translating analytical data to clinical practice is complex.42
When it comes to biomarker interpretation two variables should be taken into account: the analytical variability (inaccuracy of the test) and the biological variability (anticipated variability within a person over time).43
Mário Barbosa Página | 14
6. METHODS
6.1. STUDY POPULATION
6.1.1. RECRUITMENT, ENROLLM ENT PERIOD, AND SAMPLE SIZE
The study was conducted in the Department I of Internal Medicine of the Santa Maria University Hospital, with the approval of the Academic Medical Center Ethics Committee. (Attachment I)
The study enrolled 70 patients admitted to ward with acute heart failure NYHA class III and IV, recruited over a planned recruitment period of 12 months, starting (first subject) on 19/11/2015.
Ages eligible for study: 18 years and older. Genders eligible for study: both.
All patients enrolled were followed until 30/09/2017 or date of death (whichever occurred first).
6.1.2. INCLUSION CRITERIA
Patients admitted with acute decompensated heart failure in class III or IV of NYHA. Written informed consent was requested to all eligible patients. (Attachment II)
6.1.3. EXCLUSION CRITERIA
in-hospital death in the first hospitalization;
hospital discharge against medical advice;
chronic kidney disease patients with a glomerular filtration rate (GFR) <30 ml/min/1.73 m2 (calculated with the MDRD score) or under kidney substitution technique;
moderate or severe hepatic impairment (calculated with the Child-Pugh score);
active neoplasm with or without metastasis.
6.2. STUDY DESIGN
6.2.1. STUDY DESIGN
Observational prospective cohort, single-center, single-arm, diagnostic utility study.
6.2.2. ENDPOINTS Primary endpoints:
Characterize at risk patients for early readmission due to heart failure (defined as readmission up to 90 days post-discharge) and for short-term mortality (defined as death occurred within 90 days post-discharge).
Mário Barbosa Página | 15 We considered all-cause mortality given that most of the patients did not die in the hospital and, therefore, we did not have access to the death certificates.
Secondary endpoints:
Assess the importance of new cardiovascular risk biomarkers (such as Gal-3, ST2, Pro-ADM and EPO) in the prognosis of cardiac insufficiency namely early readmission due to heart failure, overall short-term mortality and overall long-term mortality.
Although the purpose of this study was primarily to define short-term heart failure outcome, the extended follow-up allowed us to characterize long-term mortality.
6.3. STUDY PROCEDURE
6.3.1. STUDY PATIENTS
The study encompassed patients admitted to ward with acute decompensated heart failure NYHA class III and IV.
Patient assessment was based on a protocol that included clinical history, physical examination, 12-lead electrocardiogram (ECG), thoracic X-ray, blood sampling for laboratory tests, transthoracic Doppler echocardiography and therapeutic data. (Attachment III)
6.3.2. MASKING
The author was blinded for the measurements of the biomarkers since the results were only acknowledged at study completion.
It is an observational study as there was no interference in clinical decisions.
Protocol´s laboratory tests, ECG, thoracic X-ray and transthoracic Doppler echocardiography were performed as per routine clinical practice.
6.3.3. EXAMS
A postero-anterior chest X-ray was performed with a conventional equipment to the studied population. A 12 lead ECG was executed using a 3 channel conventional equipment, and its interpretation was based on the American Heart Association Electrocardiography and Arrhythmias Committee criteria (vide Protocol). All echocardiograms M mode, two-dimensional and Doppler were performed by an experienced operator.
Mário Barbosa Página | 16 Using a Hitachi Aloka alfa 6 Medical device with a 2.5 MHz transducer, an echocardiographic examination was made with the subject lying in the left lateral recumbent position. The parasternal long and short axis, and the apical four- and two-chamber views were observed.
Aortic, tricuspid and pulmonary transvalvular flows were also collected.
The segmental contractility was obtained using a 16 segments model and echocardiographic values were determined in accordance with the American Society of Echocardiography (vide Protocol).
Left ventricular (LV) volumes were calculated by the biplane Simpson method, performing manual planimetry of the left ventricle endocardial contour area, at the insertion of the mitral valve cusps to the apex, in systole and diastole.
Diastolic function evaluation was estimated through the observation of mitral transvalvular curves, based on E and A wave velocity and deceleration time; tissue Doppler was applied to record mitral annular velocities at the septal and lateral sides of the annulus. E/E`ratio was determined. Left atrial maximal volume index was calculated.
Pulmonary artery systolic pressure (PASP) was quantified through tricuspid regurgitant flow. A subcostal evaluation of the inferior vena cava was also performed.
6.3.4. BLOOD SAMPLES
Biomarkers were measured using plasma samples.
Plasma samples were stored at the study sites at -20ºC, followed by storage at -80ºC.
Galectin-3, ST2/IL-33R, mid-regional pro-adrenomedullin and erythropoietin were quantified in plasma using pre-coated human ELISA kits (galectin-3, ST2/ Interleukin (IL)-33R and erythropoietin with R&D Systems, Abingdon, USA and mid-regional pro-adrenomedullin with Elabscience Biotechnology Co., Ltd). The reference range for galectin-3, ST2/IL-33R, mid-regional pro-adrenomedullin and erythropoietin were 0.3-10 ng/mL, 31.3-2000 pg/mL, 15.625-1000 pg/mL and 2.5-200 mIU/mL, respectively; and the minimum detectable amounts was 0.085 ng/mL, 13.5 pg/mL, 9.375 pg/mL and 0.6 mIU/mL, respectively.
Plasma hsTnT levels were measured by electrochemiluminescence immunoassay Elecsys Troponin T high sensitive (limit of detection: 5 ng/L), Roche Diagnostics, GmbH, Mannheim, Germany.
Plasma proBNP values were measured using electrochemiluminescence immunoassay Elecsys NT-proBNP (measuring range: 5-35,000 ng/L) Roche Diagnostics, GmbH, Mannheim, Germany.
Biochemical parameters related to Cardiac Troponin I (cTnI), renal, hepatic and thyroid function, ionogram and iron kinetics were evaluated using the same plasma sample.
Mário Barbosa Página | 17
6.4. DATA COLLECTION INSTRUMENTS
Data was collected in an Excel database.
6.5. STATISTICAL METHODS
6.5.1. STUDY ENDPOINTS
This study has 3 primary endpoints directly associated with each of the primary objectives as presented and defined below:
Endpoint Baseline Censoring
Early Readmission Definition
Patient rehospitalization less than 90 days after a hospitalization discharge.
First observation (hospitalization) of each patient in which an early rehospitalization occurred after discharge (i.e. the patient was rehospitalized less than 90 days afterwards). For subjects without early rehospitalization events, the baseline (first observation) was considered.
It was also decided to consider the baseline data for subjects who did not have any early rehospitalization event after the baseline, but for whom the baseline was an early rehospitalization itself. In those cases, the subject was considered as having the event, and the time to event (used during survival analysis) was calculated based on the last hospitalization dates.
For subjects not having an early readmission event, censoring criteria was defined as 90 days.
Early Mortality
Definition
Patient died less than 90 days after a hospitalization discharge.
Last observation (hospitalization) of each patient before the early mortality event took place.
For subjects that did not suffer early death event, the baseline (first observation) was considered.
For subjects not having early mortality event, censoring criteria was defined as 90 days.
Long-term Mortality Definition
Patient died during follow-up.
Baseline (first observation) was considered for all patients.
For subjects alive by the end of the study, censoring criteria was defined as “End of study” date (30/09/2017).
Mário Barbosa Página | 18 6.5.2. GENERAL STATISTICAL METHODS
6.5.2.1. Descriptive Analysis
Unless specified otherwise, continuous variables were summarized by mean, standard deviation (SD), median, 1st and 3rd quartiles, interquartile range and minimum/maximum. Comparison between patients with and without each of the events was performed for all variables using t test or Wilcoxon Rank test as applicable. Categorical variables were summarized by relative and absolute frequencies, and compared using chi-squared test or Fisher’s Exact test as applicable.
The following were considered as stratification variables for:
Early readmission;
Early mortality;
Long term mortality
Shapiro-Wilk test was used to assess the normality of continuous variables.
6.5.2.2. Analysis of Primary Endpoints
For the analysis of the primary endpoints of this study, a survival analysis was performed for each of the 3 events of interest (i.e. early rehospitalization, early mortality and long-term mortality). For each endpoint, Kaplan Meier survival estimates were calculated and plotted for each categorical variable. Log rank test was used to compare survival probabilities in each of the considered variables. A univariate Cox proportional hazards model was fitted to the data to obtain HR and 95% confidence intervals for each variable. The proportional hazards assumption was tested using Schoenfeld residuals.
All analyses were conducted at an overall significance level of 5%. No imputation was performed on missing data. No adjustment for multiplicity was performed.
All statistical analyses were conducted using R Statistical Software version 3.4.3.
6.5.3. BIOMARKERS’ CUT-OFF
To be able to analyse the prognosis capabilities of each biomarker and using multiple biomarkers at the same time, specific cut-offs for each of them were needed. Since there are no standardized cut-offs defined for most of these biomarkers, the multiclass AUCROC as defined by Hand and Till was used to assess the overall performance of each biomarker as a predictor of each of the events of interest (i.e. early rehospitalization, early mortality and long-term mortality). Due to the low number of subjects, to be able to
Mário Barbosa Página | 19 calculate some viable cut-offs, it was decided to use cut-offs calculated for biomarkers with AUCROC above 0.7 and 95% confidence intervals (CI) significantly different from 0.5 (i.e. not containing 0.5).
The optimal cut-off value for each biomarker to predict each of the events was defined using the Youden Index, which maximizes the sensitivity and specificity of the predictor. Negative predictive values (NPV) and positive predictive values (PPV) were calculated and reported for the selected cut-offs.
6.6. COMPLIANCE STATEMENTS
6.6.1. GENERAL REQUIREMENTS
The study was performed in conformity with its protocol, the Declaration of Helsinki and the Oviedo Convention. The study was approved by the Faculty of Medicine of the University of Lisbon Academic Medical Center Ethics Committee.
6.6.2. SUBJECT INFORMATION AND INFORMED CONSENT
Subjects or legal surrogates were informed orally and in written about the purposes of the study, study procedures and potential risks.
Before any study-related activities were initiated, the subjects or legal proxies signed the written informed consent.
The participation in the study was entirely voluntary.
The subjects have the right to withdraw their willingness to participate in the study at any time without affecting their future medical care in any way.
6.6.3. CLINICAL STUDY RESULTS AND PUBLICATION
The results of the study are documented in the present dissertation and, if possible, will be published (e.g. in scientific journals and/or presented in scientific meetings).
6.6.4. DATA CONFIDENTIALITY AND DATA PROTECTION
Auditors, Ethics Committee, and the regulatory authorities will be granted access to the subjects’ medical records to the extent permitted by the applicable law and regulation for verification of clinical study procedures, and/or data control, ensuring subject data confidentiality.
The participants’ file and the source data will be archived in line with national and international legal requirements.
Mário Barbosa Página | 20
7. DEFINITIONS
Arterial Hypertension was defined according to the European Society of Hypertension (ESH)/ European Society of Cardiology (ESC) Guidelines and/or taking hypertensive medication).44
Diabetes was defined following the International Diabetes Federation (IDF) criteria and/or use of antidiabetic drugs.45
Dyslipidemia was defined in accordance with the European Atherosclerosis Society (EAS) and the ESC Guidelines and/or use of lipid-lowering medication.46
Obesity was defined as body mass index (BMI) ≥30 kg/m2 (calculated as weight divided by height squared)].47
Tabagism was defined as having ever smoked at least 100 cigarettes in the lifetime.48 Glomerular filtration rate was estimated using the MDRD formula.49
Cardiorenal syndrome type I was defined as an acute worsening of cardiac function leading to acute kidney injury (defined by an increase in serum creatinine of ≥0.3 mg/dL) in accordance to the 7th Acute Disease Quality Initiative (ADQI) Consensus Conference. 50
Anemia was defined according to the World Health Organization (WHO) as hemoglobin <13 g/dL in men and <12 g/dL in women.51
Iron deficiency associated to CHF is defined, by the ESC and the AHA/ACC/ Heart Failure Society of America (HFSA), as absolute (when ferritin <100 µg/L) and as functional (if ferritin is between 100-300 µg/L with a transferrin saturation <20%).1,52
Mário Barbosa Página | 21
8. RESULTS
8.1. BASELINE CHARACTERISTICS
From the 70 selected patients 5 were excluded given that during follow-up they were diagnosed with active cancer.
Based on the study protocol over 200 variables were extracted and analyzed resulting in an overwhelming amount of data.
To facilitate the interpretation of the results only the population characteristics considered primordial are described (Table 1).
This study included 65 patients who matched the selection criteria and had a median follow-up period of 13.7 (6.7-18.9) months.
The mean age of the patients was 79.2 ± 10.8 years, 56.9% were female, and their mean Left Ventricular Ejection Fraction (LVEF) was 50.38 ± 19.07 %.
8.1.1. READMISSIONS
From the 65 patients that full-filled inclusion criteria, 33.8% were rehospitalized within 90 days
post-discharge, 13.8% of which in the first 30 days after discharge.
In our study 32.4% of women were readmitted precociously versus 35.7% of men. The year readmission percentage was 61.5%.
8.1.2. MORTALITY
The 30-day mortality prevalence was 10.8% and the 90-day mortality prevalence was 18.5%.
A trend towards compromised short-term survival and age ≥90 years was noted in the Heart Failure with Preserved Ejection Fraction (HFpEF) group (HR: 6.632, 95% CI: 0.599-73.409, P-value=0.123).
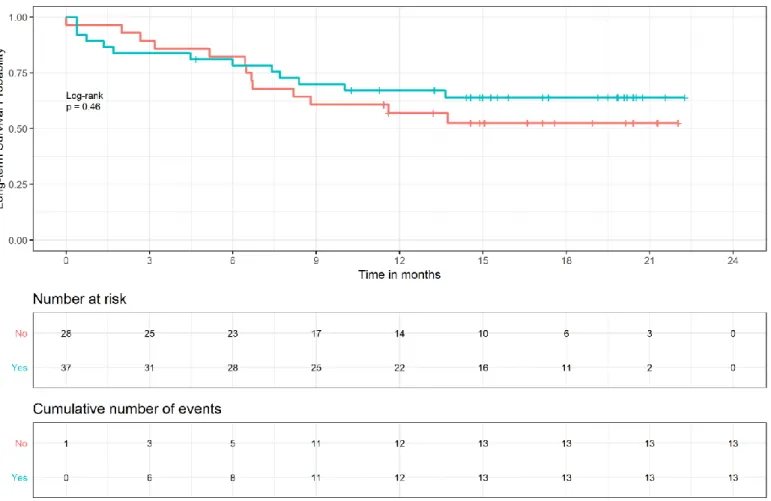
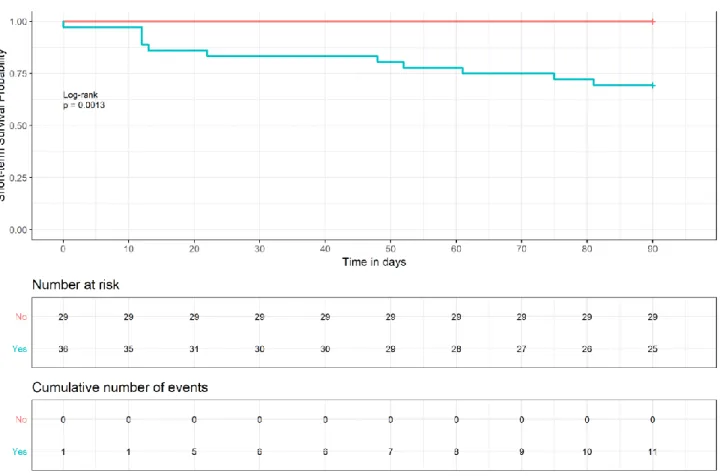
Short-term mortality was similar between genders (18.9% for the females versus 17.9% for the males) but men showed a greater percentage of long-term death (42.9% versus 37.8%). Nevertheless, none of these differences were statistically significant.
Mário Barbosa Página | 22
Figure 1 - Long-term mortality - Kaplan Meier: Gender
The year mortality was 36.9% and 40% of patients deceased at the end of follow-up.
8.2. DISEASE RELATED DETERMINANTS
8.2.1. HOSPITALIZATIONS
The accumulated length of stay represented a risk factor for short-term HF readmission in the general population study (HR: 1.022, 95% CI: 1.009-1.036, P-value<0.001).
The number of hospitalizations was related with short-term readmission in the general population (HR: 1.543, 95% CI: 1.224-1.945, P- value<0.001) and in the Heart Failure with Mid-Range Ejection
Fraction (HFmrEF) subgroup (HR: 2.814, 95% CI: 1.075-7.365, P- value=0.035) and expressed a trend
towards greater risk in the HFpEF subgroup (HR:1.391, 95% CI:0.989-1.956, P- value=0.058).
In patients suffering from Heart Failure with Reduced Ejection Fraction (HFrEF) early readmission risk, derived from the accumulated length of stay, was slightly superior to that of the general population (HR: 1.029, 95% CI: 1.008-1.050, P-value=0.006).
Mário Barbosa Página | 23 For the same group a trend towards the length of stay for a given hospitalization and early readmission was met (HR: 1.173, 95% CI: 0.985-1.395, P-value=0.073) and another trend was found between the number of hospitalizations and early readmission (HR: 1.560, 95% CI: 0.997-2.442, P-value=0.052).
A trend towards the accumulated length of stay and short-term mortality, close to reaching statistical significance (HR: 1.016, 95% CI: 0.999-1.032, P value=0.062), was identified in the general population study.
A trend towards the accumulated length of stay and long-term mortality was identified in the general population study (HR: 1.009, 95% CI: 0.996-1.022, P value=0.170) and in the HFmrEF subgroup (HR: 0.882, 95% CI: 0.740-1.052, P value=0.162).
A trend towards the number of hospitalizations and long-term mortality close to reaching statistical significance (HR: 1.506, 95% CI: 0.994-2.283, P value=0.054) was found in the HFrEF subgroup.
In the HFpEF subgroup both the length of stay per specific admission (HR: 1.063, 95% CI:
1.006-1.123, P value=0.030) and the accumulated length of stay for all admissions (HR: 1.051, 95% CI: 1.008-1.095, P value=0.019) were markers of worse long-term survival.
8.2.2. ETIOLOGY
The main causes of HF (i.e. ischemic cardiomyopathy, hypertensive cardiomyopathy and valvular cardiomyopathy) were studied but only the first showed an interesting result, since that in the subgroup of patients with HFrEF ischemic cardiomyopathy increased the risk of early readmission close to 5 times with an almost statistical significance (HR: 4.648, 95% CI: 0.892-24.225, P-value=0.068) and a trend towards ischemic cardiomyopathy and long-term mortality was also recognized (HR: 3.321, 95% CI: 0.789-13.977, P-value=0.102).
8.2.3. LEFT VENTRICULAR EJECTION FRACTION
We verified a trend towards short-term readmission and LVEF in the HFrEF subgroup (HR: 0.516, 95% CI: 0.228-1.168, P-value=0.112).
A trend towards short-term survival and LVEF was also patent in the HFrEF subgroup (HR: 0.274, 95% CI: 0.053-1.422, P-value=0.123).
As for long-term mortality, statistical significance was met in the HFrEF subgroup, as per increments of
10% of LVEF a risk reduction of 65.2% was found (HR: 0.348, 95% CI: 0.135-0.899, P-value=0.029).
8.2.4. REDUCED RIGHT VENTRICULAR FUNCTION
We were able to identify a trend towards decreased TAPSE and long-term mortality (P-value=0.092). The mean TAPSE of the group of deceased patients was 17 mm.
Mário Barbosa Página | 24 A trend towards elevated PASP [median value in the group of patients who died of 45.00 (30.60-54.34 mmHg)] and long-term mortality was found as well (P-value=0.086).
Using descriptive analyses, we acknowledged that the absence of inferior vena cava inspiratory collapse was far more frequent in the group that died during the first 90 days post-discharge (33.3%) than in the survivor group (9.4%). The difference between the two groups was significant (P-value=0.015).
Regarding long-term mortality, the absence of inferior vena cava inspiratory collapse was observed in only 2.6% of the patients who survived compared to 30.8% of those who died during follow-up, with an also significant difference between groups (P-value<0.001).
8.2.5. OTHER ECHOCARDIOGRAP HIC FINDINGS
In our study LV end-diastolic volume was a predictor of short-term mortality (P-value=0.027).
The median LV end-diastolic volume value for the patients that survived was 56.87 (36.37-82.88) cm3 whereas in the subset of patients who died before 90 days post-discharge the median value was 105.40 (85.25-150.00) cm3.
Long- term mortality was also predicted by LV end-diastolic volume (P-value=0.023).
The median value for the patients that survived was 44.57 (34.79-76.44) cm3 while in the subset of patients who died through follow-up the median value was 84.07 (58.83-151.00) cm3.
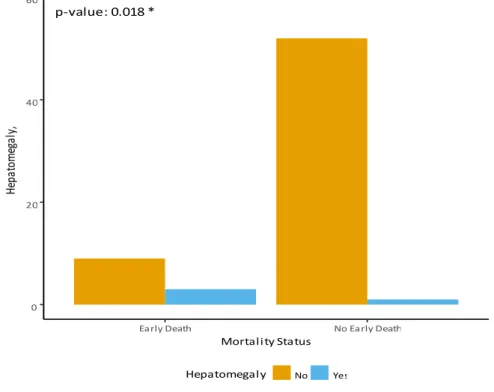
8.2.6. REFRACTORY SIGNS OF CONGESTION
According to descriptive analyses, hepatomegaly was observed in only 1.9% of the patients that
survived the first 90 days post-discharge versus 25% of those who deceased in that period.
The difference between the two groups was statistically significant (P-value=0.018), as represented in Figure 2.
Mário Barbosa Página | 25
Figure 2 - Baseline comparison of subjects by short-term mortality status: Hepatomegaly
As for long-term mortality, hepatomegaly was observed in 15.4% of the patients that died, but unremarkable in the survivors; again statistical power was achieved (P-value=0.022).
8.2.7. THERAPEUTICS
A trend towards angiotensin-converting-enzyme (ACE) inhibitor use and improved long-term survival was perceived in the general population study and in the HFmrEF subgroup (HR: 0.277, 95% CI: 0.050-1.535, P-value= 0.142).
8.2.8. MODIFIABLE CARDIOVASCULAR RISK FACTORS- THE METABOLIC
SYNDROME
Concerning cardiovascular (CV) risk factors, a trend towards dyslipidemia and risk of early readmission was identified in the subset of patients with HFrEF subgroup (HR: 3.952, 95% CI: 0.761-20.524, P-value= 0.102).
We detected a trend towards long-term mortality and dyslipidemia in the HFmrEF group HR: 5.346, 95% CI: 0.622-45.919, P-value=0.127).
A trend towards long-term mortality and diabetes, limited to the ischemic cardiomyopathy subgroup, was perceived (HR: 1.909, 95% CI: 0.738-4.940, P-value=0.183).
p-value: 0.018 * 0 20 40 60
Early Death No Early Death Mortality Status He pa to m eg al y, Hepatomegaly No Yes
Mário Barbosa Página | 26 A trend towards obesity and improved long-term survival was observed (HR: 0.436, 95% CI: 0.150-1.266, P-value=0.127) and a trend towards better short-term survival and higher BMI was identified in the HFpEF group (HR: 0.784, 95% CI: 0.570-1.077, P-value=0.133).
We verified a trend towards the number of metabolic comorbidities and short-term readmission in the general population study (HR: 1.293, 95% CI: 0.908-1.842, P-value=0.154) and in the HFpEF group (HR: 1.456, 95% CI: 0.826-2.564, P-value=0.194).
We acknowledged a trend towards the number of metabolic comorbidities and short-term mortality in the HFrEF subset of patients (HR: 0.471, 95% CI: 0.165-1.346, P-value=0.160).
8.2.9. OTHER RISK FACTORS
8.2.9.1. Blood Pressure
The mean systolic blood pressure of the patients that survived the first 90 days post-discharge was 147 ± 30.0 mmHg versus 125 ±24.7 mmHg in the decedents.
Univariate Cox regression revealed that, in general population study, the hazard of short-term mortality
for patients with systolic blood pressure <100 mmHg was 5.3 times higher than that for patients with
systolic blood pressure ≥ 100 mmHg (HR=5.330, 95% CI: 1.407-20.193, P-value=0.014).
Mário Barbosa Página | 27
Figure 3 - Short-term mortality - Kaplan Meier: Systolic blood pressure <100 mmHg
As shown in Figure 4, the mean systolic blood pressure was significantly lower in the long-term mortality group than in the patients who survived (mean 149 ± 30.9 mmHg in the survivors versus 134 ± 27.2 mmHg in the deceased).
Mário Barbosa Página | 28
Figure 4 - Baseline comparison of subjects by long-term mortality status: Systolic blood pressure
Comparatively to short-term mortality, for the referred value of systolic blood pressure (i.e. <100
mmHg) the risk declined to 3.6 times (HR: 3.629, 95% CI: 1.239-10.631, P-value=0.019).
Subgroup discrimination evidenced that long-term mortality hazard rose up to 6.3 times in the HFrEF subgroup (HR: 6.303, 95% CI: 1.224-32.452, P-value=0.028).
Regarding diastolic blood pressure, Figure5depicts that the mean diastolic blood pressure was significantly lower (P-value=0.014) in the patients who died precociously compared to those who survived the early post-discharge period (mean 80 ± 19.9 mmHg in the survivors versus 69 ± 10.6 mmHg in the decedents).
p-value: 0.046 * 120 160 200 Alive Dead Mortality Sy st ol ic B lo od P re ss ur e
Mário Barbosa Página | 29
Figure 5 - Baseline comparison of subjects by short-term mortality status: Diastolic blood pressure
The univariate Cox proportional hazard model estimated an increased risk of 11.1 times for short-term
mortality in the HFrEF patients with diastolic blood pressure <60 mmHg (HR: 11.116, 95% CI:
1.000-123.564, P-value=0.05).
During follow-up the hazard declined to 8.5 times in the mentioned subgroup (HR: 8.462, 95% CI:
1.662-43.096, P-value=0.010).
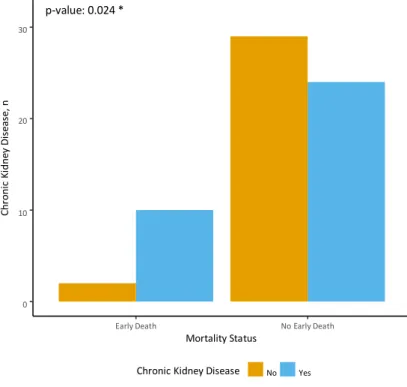
8.2.9.2. Renal Function
Chronic kidney disease was an important clinical prior regarding short-term mortality, being present
in 45.3% of the survivors versus 83.3% of the decedents (P-value=0.024), as illustrated in Figure6.
p-value: 0.014 *
60 90 120
Early Death No Early Death
Mortality Di as to li c B lo od P re ss ur e (m m H g)
Mário Barbosa Página | 30
Figure 6 - Baseline comparison of subjects by short-term mortality status: Chronic kidney disease
Regarding short-term readmission, median baseline urea in the non-early readmitted group was 44 (33-62) mg/dL versus 70 (44-84) mg/dL in the early readmitted group; and admission urea was 51 mg/dL (36-76) versus 92 (48-128) mg/dL for the referred groups, respectively.
As for short-term survival, median baseline urea in the patients who survived the first 90 days post-discharge was 44 (34-67) mg/dL versus 73 (66-89) mg/dL in those who died in that period; median
admission urea was 54 (35-80) mg/dL versus 104 (74-143) mg/dL for the same groups, respectively.
Minding long-term survival, median baseline urea was 44 (35-64) mg/dL in the survivors versus 70 (41-84) mg/dL in those who died during follow-up; whereas median admission urea was 49 (34-74) mg/dL in the survivors versus 83 (50-124) mg/dL in those who died along follow-up.
Median baseline creatinine in the non-early readmitted group was 1.0 mg/dL (0.8-1.2) versus 1.3 mg/dL (1.0-1.5) in the early readmitted group; while admission creatinine was 1.3 mg/dL (1.0-1.6) versus 1.6 mg/dL (1.1-2.3) for the mentioned groups, respectively.
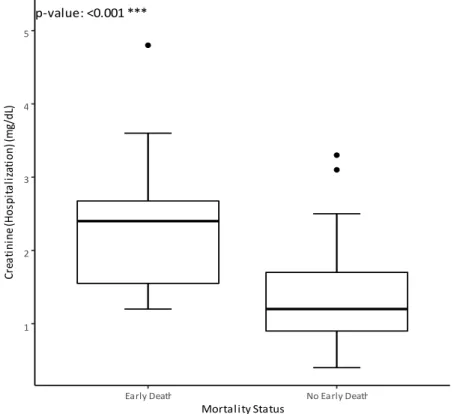
Considering early mortality, median baseline creatinine in the patients who survived the first 90 days post-discharge was 1.0 (0.8-1.3) mg/dL versus 1.4 (1.2-1.5) mg/dL in those who died in that period; median
admission creatinine was 1.2 (0.9-1.7) mg/dL versus 2.4 (1.6-2.7) mg/dL for the given subset of patients
(Figure7). p-value: 0.024 * 0 10 20 30
Early Death No Early Death
Mortality Status C h ro n ic Ki d n ey D is eas e, n
Mário Barbosa Página | 31
Figure 7 - Baseline comparison of subjects by short-term mortality status: Admission creatinine
In what matters to long-term mortality, median baseline creatinine in the patients who survived was 1.0 (0.8-1.3) mg/dL versus 1.2 (0.9-1.5) mg/dL in the group that died; while median admission creatinine was 1.2 (1.0-1.5) mg/dL in the survivors versus 1.7 (1.3-2.6) mg/dL in those who died through follow-up.
Referring to early readmission, median baseline GFR in the non-early readmitted group was 65.8 mL/min (48.1-83.3) versus 49.3 mL/min (41.1-74.7) mL/min in the early readmitted group; a median admission
GFR of 56.5 mL/min (35.6-69.1) versus 36.5 mL/min (23.4-54.5) was found in the considered groups.
Addressing short-term mortality, median baseline GFR in the early death group was 67.8 (47.3-83.5) mL/min versus 44.3 (35.6-50.5) in the group that died; while a median admission GFR of 56.5 (36.0-71.5) mL/min versus 23.4 (18.9-34.4) mL/min was observed in the two groups, respectively.
Descriptive analysis showcased a median baseline GFR of 68.6 (47.3-84.4) mL/min in the survivors versus 50.9 (41.8-74.5) mL/min in those who died throughout follow-up.
The same statistical method demonstrated a median admission GFR of 56.5 (35.0-72.4) mL/min in the survivors versus 39.0 (20.0-57.6) mL/min in those who died along follow-up.
The hazard for short-term rehospitalization increased 9.8% per 5 mg/dL increment of baseline urea (HR: 1.098, 95% CI: 1.022-1.179, P-value=0.01).
The risk for short-term rehospitalization augmented 4.8% per 5 mg/dL increment of admission urea (HR: 1.048, 95% CI: 1.013-1.084, P-value=0.006). p-value: <0.001 *** 1 2 3 4 5
Early Death No Early Death
Mortality Status C re a ti n in e (H o sp it a li za ti o n ) ( m g/d L)
Mário Barbosa Página | 32 An association between elevated baseline creatinine and early readmission was noticed (HR: 1.111, 95% CI: 1.004-1.229, P-value=0.041), the risk augmented 11.1% per 0.1 mg/dL increment of creatinine.
In relation to admission creatinine, the risk for early readmission augmented 4.7% per 0.1 mg/dL increment of creatinine (HR: 1.047, 95% CI: 1.005-1.092, P-value=0.027).
Early readmission hazard increased 3.5 times with admission GFR <30 mL/min (HR: 3.535, 95% CI: 1.467-8.518, P-value=0.005).
With reference to short-term mortality the results were also interesting as both baseline and admission urea were significant risk predictors (HR: 1.145, 95% CI: 1.032-1.270, P-value=0.010, determining a 14.5% additional risk per increments of 5 mg/dL and HR: 1.076, 95% CI: 1.021-1.135, P-value=0.006, implicating a 7.6% increased risk per increments of 5 mg/dL, respectively).
As for admission creatinine for each 0.1 mg/dL increment the risk for short-term mortality augmented 12.7% (HR: 1.127, 95% CI: 1.055-1.204, P-value<0.001), for the same amount of increase for baseline creatinine the risk augmented 15.7% (HR: 1.157, 95% CI: 1.009-1.328, P value=0.037).
Hazard analysis by subgroup of HF showed that for short-term mortality, focusing on HFrEF patients, the risk augmented 15.1% per 0.1 mg/dL increment of hospitalization creatinine (HR: 1.151, 95% CI: 1.010-1.311, P- value=0.034).
It is important to stress that admission GFR <30 ml/min increased the likelihood of early death 9.8 times in the entire population study (HR: 9.791, 95% CI: 2.855-33.580, P-value<0.001) and rose the risk up to 14.8 times in the HFrEF subgroup (HR: 14.783, 95% CI: 1.267-172.493, P-value=0.032).
On the subject of long-term mortality, admission urea elevated the hazard 5.6% per increments of 5 mg/dL (HR: 1.056, 95% CI: 1.019-1.094, P-value=0.003) in the total population study.
In the HFrEF subgroup long-term mortality risk increased 10.5 % per increments of 5 mg/dL of admission urea (HR: 1.105, 95% CI: 1.037-1.177, P value=0.002) and 13.2% per increments of 5 mg/dL of baseline urea (HR: 1.132, 95% CI: 1.004-1.276, P value=0.042).
With regard to long-term mortality admission creatinine worsened the outcome 10.4% per increments of 0.1 mg/dL (HR: 1.104, 95% CI: 1.054-1.156, P- value<0.001) in the general population study, whereas in the subgroup of HFpEF the risk for this end-point was inferior, as per increments of 0.1 mg/dL of admission creatinine the risk raised only 8% (HR: 1.080, 95% CI: 1.007-1.159, P-value=0.032).
Interestingly, in the HFrEF subgroup long-term mortality risk was greatest, since it increased 14.8% per increments of 0.1 mg/dL of admission creatinine (HR: 1.148, 95% CI: 1.051-1.253, P-value=0.002).
Higher admission GFR decreased long-term mortality hazard around 20% per increments of 10 mL/min (HR: 0.788, 95% CI: 0.649-0.957, P-value=0.016) in the global population study. As for the HFrEF subgroup long-term mortality risk diminished 41% per increments of 10 mL/min of admission GFR (HR: 0.590, 95% CI: 0.365-0.953, P-value=0.031).
Mário Barbosa Página | 33 Admission GFR <30 ml/min increased the hazard 3.9 times (HR: 3.906, 95% CI: 1.7208.871, P- value=0.001), while for admission GFR <15 ml/min the risk ascended to 6.1 times (HR: 6.087, 95% CI: 1.403-26.402, P-value=0.016) in the overall population study.
Minding the subgroup of HFpEF, long-term mortality correlated with admission GFR <30 ml/min (HR: 3.640, 95% CI: 1.073-12.351, P-value=0.038) and in the HFrEF subgroup for admission GFR <30 mL/min this outcome risk augmented 13 times (HR: 13.387, 95% CI: 2.356-76.075, P value=0.003).
Cardiorenal syndrome was present in 63.6% of the early readmitted patients, compared to 48.8% in the
group not rehospitalized, notwithstanding statistical significance was not observed.
Descriptive analysis showed a prevalence of cardiorenal syndrome twice as superior in the short-term
mortality group compared to those who survived (91.7% versus 45.3%, respectively, P-value=0.004).
The Kaplan Meier short-term mortality curve for cardiorenal syndrome is illustrated ahead (Figure 8).
Figure 8 - Short-term mortality - Kaplan Meier: Cardiorenal syndrome
Descriptive analysis comparison revealed a 73.1% prevalence of cardiorenal syndrome in the long-term mortality group versus 41% in the survivors (P-value=0.011).
Mário Barbosa Página | 34 The presence of cardiorenal syndrome increased long-term mortality risk around 2.6 times in the global population study (HR: 2.582, CI: 1.120-5.950, P-value=0.026), achieving a 73.1% prevalence in the decedents and 41% in the survivors.
As anticipated, long-term mortality hazard was superior in the HFrEF subgroup (HR: 8.567, 95% CI: 1.034-70.981, P-value=0.046).
8.2.9.3. Atrial Fibrillation
In our study no connection was acknowledged between atrial fibrillation (AF) and the proposed outcomes.
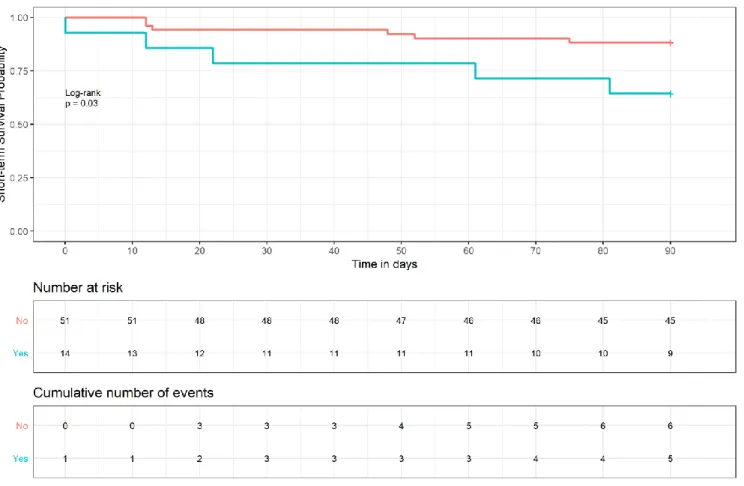
8.2.9.4. Bundle Branch Block
Left bundle branch block (LBBB) determined a short-term mortality risk 3.4 times superior (HR:
3.444, 95% CI: 1.051-11.293, P-value=0.041). It was present in 41.7% of the patients that died early, while it was present in only 17% of those that survived.
The Kaplan Meier short-term mortality curve for LBBB is represented in Figure 9.