Universidade de Lisboa
Faculdade de Motricidade Humana
The emergence of team synchronization during the
soccer match: understanding the influence of the
level of opposition, game phase and field zone
Dissertação elaborada com vista à obtenção do grau de Mestre em Treino de Alto Rendimento
Orientador: Professor Doutor Ricardo Filipe Lima Duarte
Coorientador: Doutor Hugo Miguel Cardinho Alexandre Folgado
Júri:
Presidente
Professor Doutor António Paulo Pereira Ferreira
Vogais
Professora Doutora Anna Georgievna Volossovitch
Professor Doutor Ricardo Filipe Lima Duarte
Carlos Eduardo do Carmo Costa Pinto
2014
iii Todo o esforço empregue nesta jornada é dedicado aos meus pais. Sem vocês nada seria possível.
iv
Table of Contents
Page Abstract ... 1 Resumo ... 2 I. Introduction ... 3 II. Methods ... 6 Sample ... 6 Data Collection ... 6 Independent Variables ... 7 Dependent Variable ... 8 Reliability ... 10 Data Analysis ... 10 III. Results ... 10 IV. Discussion ... 13 V. Conclusions ... 15 VI. References ... 15Tables
Page Table 1. Number of plays coded and analyzed per each category ... 6Table 2. Criteria for the beginning of ball possession according to Reis et al. (2013) ... 7
Figures
Page Figure 1. Field zones used in the present study and adapted from Fradua et al. (2013) ... 8 Figure 2. Mean and standard deviation values of teamsynchronization according to the level of opposition and game phase. The left and right panels display data for longitudinal and lateral displacement axes, respectively. Each pair of equal
v
symbols represents pairwise differences between the two corresponding levels of opposition. * represents pairwise
differences between the corresponding game phases ... 11 Figure 3. Mean and standard deviation values of team
synchronization according to the level of opposition and field zone. The left and right panels display data for longitudinal and lateral displacement axes, respectively. * represents pairwise
1
Abstract
The aim of this study was to examine whether the level of opposition, game phase and field zone influence whole team synchronization. Positional data from six friendly soccer matches against opponents of different level were collected using GPS units. Game phase and dominant field zone were further noted using observational video analysis. The whole team synchronization was assessed in each game using the cluster phase method. Results revealed that the opponent team level had a major impact on the degree of teams synchronization, while the influence of game phase and dominant field zone is very limited. The analyses of movement synchronization both in longitudinal and lateral displacement axes consistently revealed that competing against amateur opponents tend to decrease the degree of team synchrony. Differences between game-phase occurred only in games against 1st league teams. In overall, higher values of team synchronization were found in matches against opponents of similar higher level and in the defensive phases. These findings suggested that the selection of the opponent teams during pre-season friendly matches is a critical factor, even more since demarcated differences in team synchronization between game phases appeared only when competing against opponents of similar higher level.
Keywords: cluster phase method, team synchronization, collective systems, association
football, situational variables, game-phase, field zone, level of opposition, team behavioral dynamics, pre-season.
2
Resumo
Com este estudo pretendeu avaliar-se se o nível de oposição, a fase de jogo e o sector do campo influenciam os níveis de sincronização da equipa. Os dados posicionais de seis jogos amigáveis contra adversários de diferentes níveis foram capturados com a utilização de unidades de GPS. A fase de jogo e a zona dominante do campo foram registadas posteriormente através da análise observacional de vídeo. O grau de sincronização da equipa enquanto um todo foi calculado para cada jogo com recurso ao método cluster phase. Os resultados revelaram que o nível de oposição exerce uma influência clara no grau de sincronização das equipas enquanto que a influência do sector do campo e da fase de jogo é limitada. Diferenças entre a fase de jogo ocorreram apenas em jogos contra equipas da primeira liga. No geral, foram encontrados valores mais altos de sincronização colectiva em jogos frente a opositores de nível igualmente mais elevado e na fase de jogo defensiva. Estas descobertas sugeriram que a selecção das equipas adversárias para os jogos amigáveis durante a pré-época é um factor crítico, enaltecido pelo facto de os resultados terem demonstrado diferenças na sincronização colectiva entre fases de jogo somente frente a adversários de nível igualmente superior.
Palavras-Chave: método cluster phase, sincronização coletiva, sistemas coletivos,
futebol, variáveis contextuais, fase de jogo, sector do campo, nível de oposição, comportamentos dinâmicos da equipa, pré-época.
3
I.
Introduction
The ongoing notion that success in elite football depends mostly on teams tactical organization (Bartlett, Button, Robins, Dutt-Mazunder and Kennedy, 2012) and that game performance is dependent on multiple player interactions (Duarte, Araújo, Correia, Davids, Marques & Richardson, 2012a; Frencken, Poel, Visscher & Lemmink, 2012) rather than on individual performances per se has drove scientists’ attention to teams behavioral dynamics and collective performance indicators (e.g., Duarte, Araújo, Folgado, Esteves, Marques & Davids, 2013; Vilar, Araújo, Davids & Bar-Yam, 2013). This notion lies beneath the understanding of soccer as a complex system, which implies looking at the match as a single unit comprised by self-organizing players, whose interactions determine their game behaviors (McGarry, 2009). In this sense one cannot construe one team behavior based on the aggregate of the individual performances of the players that comprise the game, but instead on the type and quality of interactions developed between them (Duarte, Araújo, Correia & Davids, 2012). Studying how players interact and coordinate their actions in order to collectively accomplish their common and, perhaps, sometimes non-consensual goals, may not only shed light onto collective dynamics in soccer, but also trigger our awareness for linking it with one of the most fascinating phenomena – the collective synchronization (Sumpter, 2006).
One trend in the investigation of teams coordination dynamics has been the use of compound positional variables such as the surface area (e.g. Castellano, Álvarez, Figueira, Coutinho and Sampaio, 2013; Frencken et al., 2011), geometrical centre (e.g. Duarte et al., 2013b; Lames, Erdmann & Walter, 2010), stretch index (e.g. Duarte et al., 2013b; Yue, Broich, Seifriz & Mester, 2008) or team ranges (e.g. Castellano et al., 2013; Duarte et al., 2013; Frencken et al., 2011) since they allow for the measurement of team positioning and distribution on the field. These aspects are considered key-performance issues to measure teams tactical behaviors (Kannekens, Elferink-Gemser and Visscher, 2011). For example, Duarte et al. (2013b) analyzed the magnitude (%CV) and the structure (ApEn) of variability of the collective behaviors of the teams in a game from the English Premier League using the surface area, stretch index, team length, team width and the geometrical centre. Results revealed that the collective patterns of the teams increase in the magnitude of variability, but become more regular and predictable as the game unfolds. These findings showed that these variables have the ability to capture the idiosyncratic performance values of each team and that they can complement one another in the assessment of the behaviors of sports teams viewed as complex social systems. Despite the useful contribution that the above unveiled coordination dynamics per se might give to the understanding of game behavior, it would be of great benefit that they could be associated to the specific game context in which such behaviors occur (e.g., “where in the pitch?”; “with or without the ball?”; “against which opponent level?”, Mcgarry, 2009). In that sense Castellano et al. (2013) analyzed the collective behaviors of a high-level soccer team
4
against weaker and stronger level opponents, both in defensive and offensive phases of play. Results showed higher offensive length, width and surface area frequencies against weak teams which could be related to dominance in ball possession. In the defensive phase higher frequencies of the studied variables were found against strong teams which the authors assumed to be related to the adoption of a counter-attack strategy of play and the need to occupy the width of the pitch to restrict space against strong team players. These findings suggested that both quality of opposition and ball possession influenced the team’s collective patterns. Although, some collective behaviors in sports can be interpreted as being more important than others depending on whether they represent a perturbation to the opposite team, meaning it will force the opposite team to transit from a stability state to an instability state (McGarry, 2009). Vilar and colleagues (2013) established a general framework to characterize stability and instability of teams interactions in both attack and defense phases of play and hypothesized that instability is likely to occur when the offensive team establishes local offensive numerical superiority near the ball’s location. To test this hypothesis the authors calculated the surface area of the twenty outfield players at each time frame and divided it into seven sub-areas of play. The findings supported the initial hypothesis, showing a trend of numerical advantage by the winning team both in attack and defense sub-areas of play. Data also suggested that midfielders play a major role in maintaining the stability of the team and/or creating instability on the opponent team, by deriving their positioning from middle-center sub-areas to create numerical superiority both in attack and defense in adjacent sub-areas of play.
Another research approach towards a better understanding of team behavior is the study of coordination tendencies between dyads (intra and inter-team). In this specific regard, relative phase has been a very useful technique. For example, Duarte et al. (2012b) found that the attacker is more successful if its movements are more synchronized with its direct opponent, whereas the defense is more successful when he leads the dyadic space-time interaction with the attacker. This suggests that successful defense might be dependent on the defender moving previously to the attacker for constraining its movements. Bourbousson, Sève and McGarry (2010) and Travassos, Araújo, Vilar and McGarry (2011) also calculated all possible dyadic intra an inter-team phase relationships. A higher synchronization between dyads was found in the longitudinal dimension when compared to the lateral dimension in formal game situation (Bourbousson et al., 2010). However, in a 5 vs 4 + Gk situation, higher synchronization was found in the lateral dimension of the pitch, especially between players of the defending team (intra-team dyads) (Travassos et al., 2011). These findings revealed different tendencies of interpersonal coordination depending on the numerical relationship between teams and the corresponding goals of the players.
Despite the valuable insights that these findings may reveal, this approach fail to provide information on how movements at the individual scale can be integrated to
5
shape the collective patterns of a team. This need is urged by evidence that players’ movements are mutually influenced by the relative positioning and motion direction of their team-mates and opponents, creating a purposeful aggregation towards the specific goals of the group (Passos, Milho, Fonseca, Borges, Araújo & Davids, 2011; Duarte et al., 2012a). Therefore, research should comprise both scales of analysis in order to provide information about how individuals synchronize their movements within the whole team.
Potentially, studying the emergence of synchronization in sports teams makes even more sense knowing that this phenomenon is the most natural mean of organization between interdependent agents or coupled oscillating components (Strogatz, 1993), which is the reason why it has been studied all over biology (Strogatz, 2003). For example, fireflies communities tend to synchronize their blink (Buck & Buck, 1976), Leptothorax ants synchronize their activity and rest periods (Franks, Bryant, Griffiths & Hemerik, 1990), womens’ menstrual cycle tend to synchronize when they live or work together (Stern & McClintock, 1998), and even spontaneous crowd applause in spectacles may synchronize in certain conditions (Neda et al., 2000). Duarte et al. (2012a) suggests that this phenomenon, which emerges from little adjustment in the movement frequency of individuals in relation to their surrounding pairs, occurs also in the time-space relationships between soccer players. Therefore, studying the synchronization processes of teams might be of strong relevance since they represent a fundamental property that may actually reveal the quality of teams collective performances (Duarte et al., 2013a, 2013c).
A quantitative approach that allows for the capture of the synchronization of a group as a whole, and involves both scales of analysis, is the cluster phase method developed by Frank and Richardson (2010). The authors adapted the Kuramoto order parameter (Kuramoto, 1984) which was initially meant to investigate phase synchronization in systems with large number of oscillatory units. This method allows the capture of the synchronization of the team as a whole. Using this method, Duarte et al. (2013a) captured the synchronization of the inter- and intra-team players’ movements in a match from the English Premier League and analyzed it as a function of ball possession, game halves and field direction. Results showed a tendency for the teams to better synchronize their movements in the longitudinal direction of the playing field, compared to the lateral direction. Interestingly, ball possession did not influence team synchronization values. Moreover, variations of team synchronization of each team were intimately related with the other. These results suggested that team cohesiveness mutually influence each other, and that the level of collective synchronization is quite independently of game phase. In another study, Duarte, Travassos, Araújo and Richardson (2013c) analyzed the influence of the defensive method (zone defense vs. individual defense) adopted by teams on their collective synchronization values. When teams used zone defense showed higher levels of team
6
synchronization, which suggest that this phenomenon is related to higher level teams, once zone defense is considered a more evolved team strategy than individual defense (Castelo, 2004; Garganta, 1996). As seen, this innovative method has the ability to capture the whole team synchronization levels at each instant of the match. However, few studies in soccer have been made using this approach and much relevant performance analysis issues remain unanswered.
In that sense, the present study aimed to analyze whether the quality of opposition, game phase and field sector influences team synchronization values during soccer matches.
II.
Methods
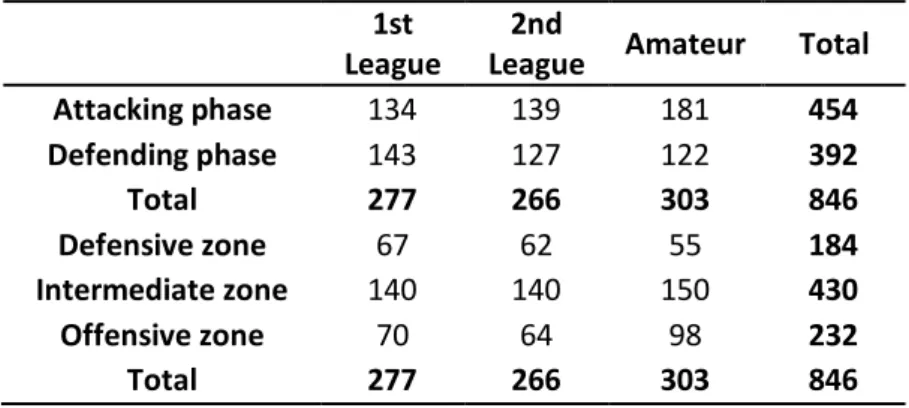
SampleThe first-halves of six matches of a team from the First Portuguese Soccer League were analyzed. Each match had a different opponent and its levels varied in the following way: two opponents of amateur level, two opponents from the Portuguese second league and two opponents from the Portuguese first league. All games consisted of friendly matches played during the pre-season of the 2011/2012 First Portuguese League. To ensure a similar team formation across all the matches, we constrained our analyses to the first-halves of the matches. A total of eight hundred and forty-six (846) plays gathered from these six games composed the sample of this study. The categorization of plays is shown in Table 1.
Table 1. Number of plays coded and analyzed per each category.
1st League
2nd
League Amateur Total
Attacking phase 134 139 181 454 Defending phase 143 127 122 392 Total 277 266 303 846 Defensive zone 67 62 55 184 Intermediate zone 140 140 150 430 Offensive zone 70 64 98 232 Total 277 266 303 846 Data collection
The positional coordinates (x,y) of the ten outfield players were collected using 15Hz GPS units (SPI PRO, GPSports, Canberra, Australia) and processed in Matlab 2011b® (The MathWorks Inc., Natick, MA, USA). Latitude and longitude data corresponding to each player were synchronized and, in order to ensure the same time
7
series length, missing data gaps were re-sampled using an interpolation technique. A Matlab routine was used to convert latitude and longitude data to meters in universal transverse Mercator (UTM) coordinate system. Afterwards, the length and the width of the field were aligned with the x-axis and y-axis respectively, by using a rotational matrix that was calculated for each match, from the field vertices positions. These rotational matrix were also applied to the players’ positional data to align it with the field referential.
Independent variables
The six matches were video recorded guaranteeing the full coverage of the pitch for subsequent game analysis. An exception was made during 5 minutes of a game against a 1st league opponent due to technical issues of the camera. Through video analysis, all plays from the first-halves of each of the six games were categorized as a function of opponent team level (amateur; 2nd league; 1st league), game phase (attack; defense) and dominant field zone (defensive; intermediate; offensive). The time-series of each play was noted according to the ball possession criteria defined in Reis, Duarte, Araújo, Folgado and Frias (2013) (see Table 2). Whenever a ball went out of play (i.e. a foul, a goalkick, a throw-in), the possession was immediately attributed to the team who performed the next action (Moura, Martins, Anido, Barros & Cunha, 2012).
Table 2. Criteria for the beginning of ball possession according to Reis et al. (2013).
Criteria Description
Number of Passes
One pass if it was followed by dribbling with more than 3 touches; Two passes if followed by dribbling with more than 2 touches; More than 2 passes;
Dribbling If performed after a pass; check previous criteria;
More than 4 touches;
Time This criterion was used if none of the above mentioned were verified,
8
Figure 1. Field zones used in the present study and adapted from Fradua et al. (2013). Field zone criteria were taken from Fradua et al., (2013) and established in the following way: the zones were clustered two on two dividing the field in three zones: defensive, intermediate, and offensive (respectively, from left to right, if we suppose that the studied team attacks in that direction (see Figure 1). Whenever a change of ball possession or zone occurred, a new play was counted. The definition of in which zone the game was taking place was based on the effective play-space concept defined by Gréhaigne, Godbout and Zerai (2011), as the area formed by the imaginary line that links all the players located at the periphery of a play at a given moment. In the present study, the effective play-space was determined by visual inspection of the four players of the studied team closer to the ball. If the area of the effective play-space was in the offensive zone, that play was attributed to that field zone. For further understanding on the effective play-space concept the reader is directed to Gréhaigne et al. (2011). In order to avoid a biased assessment of synchrony all interruptions in game longer than 25 seconds were excluded (Duarte et al., 2013a). Also, set plays that did not originate open plays (free-kicks with a shot on goal; corner kicks that originate other corner kicks) were excluded from analysis (Frutuoso, 2013). A set play was considered to originate an open play when immediately after a set play the beginning of ball possession criteria was confirmed.
Dependent variable
In order to assess whole team synchronization in each play, we used the cluster phase method. This method was adapted from the Kuramoto order parameter (Kuramoto & Nishikawa, 1987) by Frank and Richardson (2010) for systems with small
9
number of oscillatory units, whereas it was originally developed for the assessment of phase synchronization in systems with large number of oscillatory components (Kuramoto, 1984). The equations are as follows:
This cluster or group phase model gives a single value at each instant ti ranging from 0°
to 180° that describes the phase relation, Ѳk, between n oscillatory components (e.g.
players).
The adaptation made by Frank and Richardson (2010) allows for the assessment of a more comprehensive measure for the synchronization of the team as a whole, as it comprises each player's tendency of synchronization with the group phase and its behavioral changes throughout the course of the play. Once having calculated the cluster phase, the relative phase and the mean relative phase of each player with the group can be obtained, respectively, using the following equations:
The resulting values of both relative and mean relative phase of each player are then used to calculate the continuous degree of synchronization of the team as a whole at each instant ti and the mean degree, respectively, using the final computations shown
below:
The continuous degree of synchronization gives a time-series of values ranging from 0 to 1, meaning total asynchrony or full synchrony of the team, respectively.
10
The applicability of this method in soccer was shown by Duarte et al. (2013a), who analyzed intra- and inter-team synchronization during an entire match. The study led the authors to conclude the existence of many advantages in the use of this method, such as the possibility to obtain a single measure for the whole team from the multiple and idiosyncratic coordination tendencies of players. For further understanding of the cluster phase method and its mathematical formulation, the reader is directed to Frank and Richardson (2010), Richardson et al. (2012) and Duarte et al. (2013a). In practical terms, Duarte et al. (2013a) showed that this method captures the overall correlation of both movement direction and speed of all the team players.
Reliability
To test intra-observer reliability, we used the model proposed by James, Taylor and Stanley (2007) for categorical data. Five minutes of each game (11,3% of the sample) were randomly selected (Microsoft Excel RAND function) for a second analysis and categorization. Reliability was tested by analyzing time-series rather than plays itself for better precision sake due to the fact that each play has certain duration in seconds, in a specific time-series interval that was not specified in play categorization. This means that in the final analysis we could have the same number of plays for each category although they would not correspond in terms of time-series interval, which would result in a false notion of high reliability. Results showed good level of reliability since in 1800 time-steps tested, 1753 were positive matches meaning 97,4% of agreement between the two analysis and a Yule’s Q odds ratio value of 100%.
Data analysis
Due to the nested nature of our independent variables (opposition level game phase field sector), we used nested ANOVAs to analyze the nested and main effects of opposition X (game phase) and opposition X (field sector) on team synchronization mean values. These analyses were performed for both movement displacement axes (longitudinal and lateral) and respective post-hoc analyses were performed using LSD tests. All the statistical analyses were calculated using STATISTICA 10 software (StatSoft, Inc., Tulsa, OK). Alpha levels were maintained at p < 0.05.
III.
Results
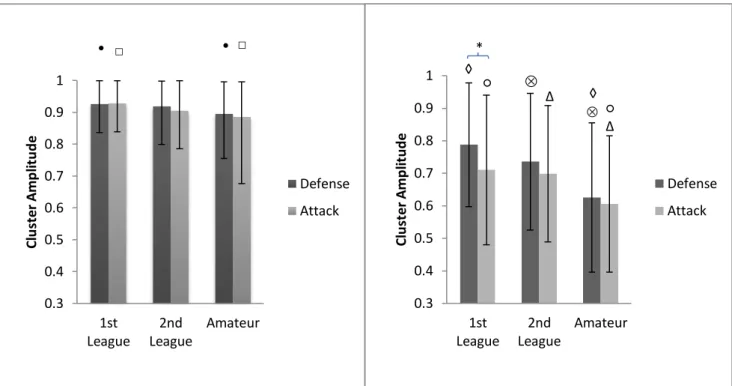
Figure 2 presents mean and standard deviation data from opposition X (game phase) analyses.
11 * ∆ ○ ◊ ◊ 0.3 0.4 0.5 0.6 0.7 0.8 0.9 1 1st League 2nd League Amateur C lu st er A m p lit u d e ○ ∆ Defense Attack • □ • □ 0.3 0.4 0.5 0.6 0.7 0.8 0.9 1 1st League 2nd League Amateur C lu st er A m p lit u d e Defense Attack
Figure 2. Mean and standard deviation values of team synchronization according to the level of opposition and game phase. The left and right panels display data for longitudinal and lateral displacement axes, respectively. Each pair of equal symbols (□,•,◊,○,,∆) represents pairwise differences between the two corresponding levels of opposition. The symbol “*” represents pairwise differences between the corresponding game phases.
Nested ANOVA analyses revealed significant interaction effects between the level of opposition and game phase (F(1.5, 281) = 3.50, p < 0.01, η2 = 0.02) and also a significant
main effect of the level of opposition (F(2, 281) = 7.21, p < 0.01, η2 = 0.02), for movement
in the longitudinal direction of the playing field. The LSD post-hoc analyses showed that these differences in team synchronization were found specifically between matches against 1st league opponents (0.93±0.11; 0.93±0.09) and matches against Amateur (0.9±0.14; 0.89±0.15) opponents, both in defensive (p ≤ 0.04) and offensive game phases (p < 0.01), respectively. For movements in the lateral direction, the nested ANOVA analyses also showed significant interaction effects between the level of opposition and game phase (F(1.5, 281) = 15.59, p < 0.01, η2 = 0.07) and a significant
main effect of game phase (F(1, 281) = 9.22, p < 0.01, η2 = 0.01). The LSD post-hoc
analyses clarified that differences in game phases appeared only in matches against 1st league teams, between the defensive phase (0.79±0.19) and the offensive phase (0.71±0.23; p < 0.01). LSD tests also showed pairwise differences in the level of team synchronization of the defensive phase between matches against amateur teams (0.63±0.23) and matches against 1st (0.79±0.19, p < 0.01) and 2nd league (0.74±0.21, p < 0.01) opponents. In the offensive phase, results showed differences between matches
12 * * * 0.4 0.5 0.6 0.7 0.8 0.9 1
Defensive Intermediate Offensive
C lu st er A m p lit u d e 1st League 2nd League Amateur * * * * * * 0.4 0.5 0.6 0.7 0.8 0.9 1
Defensive Intermediate Offensive
C lu st er A m p lit u d e 1st League 2nd League Amateur
against amateur teams (0.61±0.21) and matches against 1st (0.71±0.23, p < 0.01) and 2nd league (0.7±0.21, p < 0.01) opponents.
Figure 3 displays mean and standard deviation data clarifying the opposition X (field zone) effects on team synchronization values.
Figure 3. Mean and standard deviation values of team synchronization according to the level of opposition and field zone. The left and right panels display data for longitudinal and lateral displacement axes, respectively. The symbol “*” represents pairwise differences between the corresponding level of opposition.
Nested ANOVAs revealed significant interaction effects between opposition and field zone both in longitudinal (F(2, 281)=3.39, p < 0.01, η2= 0.03) and in lateral (F(2, 281) =
10.45, p < 0.01, η2 = 0.07) directions of the playing field. No main effects were found for field zone neither in the longitudinal (F(2, 281) = 0.12, p ≥ 0.89, η2 = 0.01) nor in the
lateral direction of the field (F(2, 281) = 1.16, p ≥ 0.31, η2 = 0.01). In the longitudinal
plane, the LSD post-hoc analyses revealed significant higher synchronization levels in matches against 1st league teams (0.93±0.11), compared to matches against amateur teams (0.88±0.14, p ≤ 0.03), in the defensive zone. In the offensive zone, data showed significant decreases in team synchronization values from matches against amateur teams (0.88±0.15) to matches against 1st (0.92±0.10, p ≤ 0.03) and 2nd (0.94±0.09, p < 0.01) league opponents. In the lateral plane, the LSD post-hoc analyses revealed significant differences in team synchronization values displayed: 1) in the defensive zone, with matches against amateur teams (0.61±0.21) eliciting lower values than matches against 1st league (0.74±0.23, p < 0.01) and 2nd league teams (0.71±0.22, p < 0.02); 2) in the intermediate zone, with matches against amateur teams (0.62±0.21) eliciting low values than matches against 1st league (0.77±0.19; p < 0.01) and 2nd league teams (0.73±0.21, p < 0.01), and; 3) in the offensive zone, with matches against
13
amateur teams (0.61±0.25) revealing low values than matches against both 1st league (0.73±0.24; p < 0.01) and 2nd league teams (0.70±0.21; p < 0.01).
IV.
Discussion
The purpose of this study was to examine whether the level of opposition, game phase and dominant field zone influence the emergence of whole team synchronization during soccer matches. For that, we captured team synchronization values in six matches against opponents of different level as a function of game phases and dominant field zone. Data showed that the opponent team level had a major impact on the degree of teams synchronization, while evidence of the influence of game phase and dominant field zone is very limited.
The analyses of movement synchronization both in longitudinal and lateral displacement axes consistently revealed that competing against amateur opponents tend to decrease the degree of team synchrony. In line with other studies, these findings suggest that the level of opposition is a contextual variable affecting actual on-field performance. For example, Castellano et al. (2013) demonstrated how the level of opposition influenced some team-related dispersion variables such as the length and width of the teams. In overall they found higher offensive length and width frequencies against weak teams and higher defensive frequencies against strong teams. In the present study, all the differences reported for the opponent team level involved matches against amateur opponents. Interestingly, no differences in team synchronization were found between matches against 1st league teams and matches against 2nd league teams. Furthermore, in all these cases higher values of synchronization were reached against teams of superior level. This might be explained by the mutual influence that competing collectives exert on each other intrinsic synchronization processes, as previous shown in literature (Duarte et al., 2013a). Since higher synchronization ability is deemed to be a characteristic of higher level teams (Duarte et al., 2013c), two high level competing teams will have a mutual positive influence on each other synchronization processes. On the other hand, when competing against teams that exhibit lower levels of synchronization, such as amateur teams, teams of superior level might be negatively influenced and decrease its levels of intrinsic synchronization. From another perspective, one can speculate that players have a higher sense of responsibility when they face higher level teams that may result in higher mental concentration of players and collective engagement towards the team goals. Conversely, when competing against lower level teams, players may be more relaxed and less committed in the team work, performing more individually and consequently displaying low levels of synchronization with their team-mates. Future research should investigate this issue, for instance measuring the degree of alertness of team players in such opposition contexts.
14
Concerning the influence of game phases, our analyses showed very limited evidence that possessing or losing the ball have an impact on whole team synchronization, agreeing with the findings of Duarte and colleagues (2013a). The single exception was, when competing against 1st league opponents, team synchronization had a tendency to be higher in defense than in attack. Such finding can be associated with the higher demands imposed by teams of superior level to enhance team responsiveness to lateral ball movements and reduce these ball-defensive team delays as the data of Yue, Broich, Seifriz and Mester (2008b) suggested. These higher synchronized behaviors in defense may allow restricting space and time (McGarry, 2009) and prevent from opponent in-depth attacks. Apparently, our findings contradict some prior studies that demonstrated as ball possession influenced team dispersion variables such as the width, length, surface area (Castellano et al., 2013), stretch index (Yue et al., 2008a) and Frobenius norm (Moura et al., 2012). However, it is possible that the superior level of dispersion during the attacking phase (with ball possession) and the consequent increase of the interpersonal distances between team members do not affect their informational coupling necessary to intentionally maintain the space-time movement synchronization.
Previous studies in team sports performance analysis argued that players and ball location in the playing field constitute key constraints influencing the observed behaviors (e.g., Gréhaigne et al., 2011). For example, Fradua et al. (2013) demonstrated that teams tend to decrease their length and surface area and increase their width values in the intermediate zone of the field. However, the present study did not reveal main effects for dominant field zone, in any of the displacement axes. Once again, these findings suggest that independently of changes in team dispersions and the corresponding interpersonal distances of players, they tend to maintain the same degree of ability to synchronize their on-field movement trajectories. This may be intimately related to the high level of the studied team. The fact that higher-level players have better positioning and decision abilities (Kannekens et al., 2011) may allow the team to keep the high levels of synchronization, even in zones of the pitch where the spatial-temporal constraints impose quick responses due to reduced space to play (Fradua et al., 2013). Nevertheless, our analyses showed significant interaction effects between the level of opposition and field zone, in both longitudinal and lateral field directions. As previous mentioned the tendency was to obtain lower levels of synchronization when competing against teams of diminished level, such as non-professional teams. Our data revealed yet that the pairwise differences in team synchronization were found between levels of opposition in all field zones, with exception of the intermediate zone for the longitudinal movement trajectories. Since the collective patterns emerging in team sports result from both intra and inter-team interaction tendencies (McGarry et al., 2002), our findings suggest that the playing patterns emerging in the intermediate sector may be less influenced by inter-team coordination than in the offensive and defensive zones. Further investigation is needed
15
to clarify this issue since, if true, this notion might be particularly useful to capture the specific traits of a team during the process of opponent game analysis.
V.
Conclusions
In sum, the elicited team synchronization processes are higher when facing professional soccer teams (1st and 2nd leagues) than when competing against amateur players. The phase of the game only imposed differences in team synchronization when competing against opponents from the 1st league. In this regard, team synchronization was higher in the defense phase, probably due to the superior demands of the match perceived by team players. The dominant field zone did not influence the emergence of this collective phenomenon. These findings suggest that the selection of the opponent teams during pre-season friendly matches is a critical factor that should be accurately determined, since competing against opponents of poor performance level (amateur players) seems to decrease the collaborative team work. This issue is even more remarkable since demarcated differences in team synchronization between game phases only appeared when competing against opponents of similar higher level.
VI.
References
Bartlett, R., Button, C., Robins, M., Dutt-Mazumder, A., & Kennedy, G. (2012). Analysing Team Coordination Patterns from Player Movement Trajectories in Soccer: Methodological Considerations. International Journal of Performance Analysis in Sport, 12, 398-424.
Bourbousson, J., Sève, C., & McGarry, T. (2010). Space-time coordination dynamics in basketball: Part 1. Intra- and inter-couplings among player dyads. Journal of Sports
Sciences, 28, 339-347.
Buck, J., & Buck, E. (1976). Synchronous fireflies. Scientific American, 234, 74-85.
Castellano, J., Álvarez, D., Figueira, B., Coutinho, D. & Sampaio, J. (2013). Identifying the effects from the quality of opposition in a Football team positioning strategy.
International Journal of Performance Analysis in Sport, 13 (3), 822-832.
Castelo, J. (2004). Futebol. Organização dinâmica do jogo. Universidade Técnica de Lisboa, Edições FMH.
Duarte, R., Araújo, D., Correia, V., & Davids, K. (2012a). Sport teams as superorganisms: implications of sociobiological models of behaviour for research and practice in team sports performance analysis. Sports Medicine, 42 (8), 633-642.
16
Duarte, R., Araújo, D., Correia, V., Davids, K., Marques, P., & Richardson, M. (2013a). Competing together: Assessing the dynamics of team-team and player-team synchrony in professional football. Human Movement Science, 32 (4), 555-566.
Duarte, R., Araújo, D., Folgado, H., Esteves, P., Marques, P., & Davids, K. (2013b). Capturing complex, non-linear team behaviours during competitive football performance. Journal of Systems Science and Complexity, 26 (1), 62-72.
Duarte, R., Araújo, D., Travassos, B., Davids, K., Gazimba, V., & Sampaio, J. (2012b). Interpersonal coordination tendencies shape 1-vs-1 sub-phase performance outcomes in youth soccer. Journal of Sports Sciences, 30 (9), 871-877.
Duarte, R., Travassos, B., Araújo, D. & Richardson, M. J. (2013c). The influence of manipulating the defensive playing method on collective synchrony of football teams. In D. M. Peters & P. O’Donoghue, Proceedings of the IX World Congress on
Performance Analysis of Sport (pp.65-70). New York, USA: Routledge.
Fradua, L., Zubillaga, A., Caro, O., Fernandéz-García, A. I., Ruiz-Ruiz, C., & Tenga, A. (2013). Designing small-sided games for training tactical aspects in soccer: Extrapolating pitch sizes from full-size professional matches. Journal of Sports Sciences, 31(6), 573-581.
Frank, T. D., & Richardson, M. J. (2010). On a test statistic for the Kuramoto order parameter of synchronization: An illustration for group synchronization during rocking chairs. Physica D, 239, 2084-2092.
Franks, N. R., Bryant, S., Griffiths, T. & Hemerik, L. (1990). Synchronization of the behavior within nests of the ant Lepothorax acervorum (Fabricius): I. Discovering the phenomenon and its relation to the starvation. Bulletin of Mathematical Biology, 52, 597-612.
Frencken, W., Poel, H., Visscher, C., & Lemmink, K. (2012). Variability of inter-team distances associated with match events in elite-standard soccer. Journal of Sports
Sciences, 30 (12), 1207-1213.
Frutuoso, J. (2013). Teams’ coordination dynamics reveals performance outcomes of
open play attacks in professional soccer. Dissertação de Mestrado em Treino de Alto
Rendimento. Lisboa: Faculdade de Motricidade Humana – Universidade Técnica de Lisboa.
Garganta, J. (1996). Modelação táctica do jogo de futebol. Estudo da organização da fase ofensiva em equipas de alto rendimento. Tese de doutoramento, FCDEF-UP, Porto.
17
Gréhaigne, JF., Godbout, P. & Zerai, Z. (2011). How the “rapport de forces” evolves in a soccer match: the dynamics of collective decisions in a complex system. Revista de
Psicología del Deporte, 20(2), 747-765.
James, N., Taylor, J., & Stanley, S. (2007). Reliability Procedures for Categorical Data in Performance Analysis. International Journal of Performance Analysis in Sport, 7(1), 1-11.
Kannekens, R., Elferink-Gemser, M. T., & Visscher, C. (2011). Positioning and deciding: key factors for talent development in soccer. Scandinavian Journal of Medicine and
Science in Sports, 21 (6), 846-852.
Kuramoto, Y. (1984). Chemical oscillations, waves, and turbulence. Berlin: Springer. Kuramoto, Y., & Nishikawa, I. (1987). Statistical Macrodynamics of Large Dynamical Systems. Case of a Phase Transition in Oscillator Communities. Journal of Statistical
Physics, 49, 569-605.
McGarry, T. (2009). Applied and theoretical perspectives of performance analysis in sport: issues and challenges. International Journal of Performance Analysis in Sport, 9, 128-140.
Moura, F., Martins, R., Anido, L., Barros, R., & Cunha, S. (2012). Quantitative analysis of Brazilian football players’ organization on the pitch. Sports Biomechanics, 11, 85-96. Neda, Z., Ravasz, E., Brechet, Y., Vicsek, T. & Barabasi, A. L. (2000). The sound of many hands clapping. Nature, 403, 849.
Passos, P., Milho, J., Fonseca, S., Borges, J., Araújo, D., & Davids, K. (2011). Interpersonal Distance Regulates Functional Grouping Tendencies of Agents in Team Sports. Journal of Motor Behavior, 43, 155-163.
Reis, M., Duarte, R., Araújo, D., Folgado, H., & Frias, T. (2013). Spatial interaction tendencies of football players captured by Voronoi diagrams. Proceedings of the
Mathematical Methods in Engineering International Conference. (pp. 279-287). Porto:
Instituto Superior de Engenharia do Porto.
Richardson, M. J., Garcia, R. L., Frank, T. D., Gregor, M. & Kerry, L. M. (2012). Measuring group synchrony: A Cluster-Phase Method for Analyzing Multivariate Movement Time-Series. Frontiers in Fractal Physiology, 3, 405.
Stern, K. & McClintock, M. K. (1998). Regulation of ovulation by human pheromones.
18
Strogatz, S. (2003). Sync. The emerging science of spontaneous order. London: Penguin books.
Strogatz, S., & Stewart, I. (1993). Coupled oscillators and biological synchronization.
Scientific American, 269 (6), 102-109.
Travassos, B., Araújo, D., Vilar, L., & McGarry, T. (2011). Interpersonal coordination and ball dynamics in futsal (indoor football). Human Movement Science, 30, 1245-1259. Vilar, L., Araújo, D., Davids, K., & Bar-Yam, Y. (2013). Science of winning soccer: Emergent pattern-forming dynamics in association football. Journal of Systems Science
and Complexity, 26 (1), 73-84.
Yue, Z., Broich, H., Seifriz, F. & Mester, J. (2008). Mathematical analysis of a soccer game. Part I: Individual and collective behaviors. Studies in Applied Mathematics, 121, 223-243.
Yue, Z., Broich, H., Seifriz, F. & Mester, J. (2008b). Mathematical analysis of a soccer game. Part II: Energy, Spectral and Correlation Analyses. Studies in Applied