CERN-PH-EP/2012-224 2013/03/04
CMS-TOP-11-005
Measurement of the tt production cross section in the
dilepton channel in pp collisions at
√
s
=
7 TeV
The CMS Collaboration
∗Abstract
The tt production cross section (σtt) is measured in proton-proton collisions at√s = 7 TeV in data collected by the CMS experiment, corresponding to an integrated lu-minosity of 2.3 fb−1. The measurement is performed in events with two leptons (electrons or muons) in the final state, at least two jets identified as jets originating from b quarks, and the presence of an imbalance in transverse momentum. The mea-sured value of σttfor a top-quark mass of 172.5 GeV is 161.9±2.5 (stat.)+−5.15.0(syst.)± 3.6 (lumi.) pb, consistent with the prediction of the standard model.
Submitted to the Journal of High Energy Physics
c
2013 CERN for the benefit of the CMS Collaboration. CC-BY-3.0 license ∗See Appendix A for the list of collaboration members
1
Introduction
A precise measurement of the tt production cross section (σtt) in pp collisions at the Large Hadron Collider (LHC) is important for several reasons. At LHC energies, tt production is dominated by gluon-gluon fusion, representing a benchmark for other processes of the stan-dard model (SM) initiated through the same mechanism, such as the production of Higgs bosons. In addition, a precise value of σttcan provide constraints on parton distribution func-tions (PDF) and be used to check the validity of perturbative calculafunc-tions in quantum chromo-dynamics (QCD). It can also benefit searches for physics beyond the SM, as tt production is often a major source of background.
The precision of initial measurements of σtt in 2010 at √s = 7 TeV [1, 2] has been improved in Refs. [3–8], and measurements of electroweak single-top-quark production are available in Refs. [9, 10]. By now, many top-quark events have been collected at the LHC, with studies proceeding on a variety of top-quark production and decay channels [5, 11–13], as well as on searches for deviations relative to predictions of the SM.
This work presents a measurement of σtt in dilepton final states that improves upon a pre-vious measurement [5] of the Compact Muon Solenoid (CMS) experiment [14]. It is based on more refined event selections and analysis techniques, an improved estimation of system-atic uncertainties, and with a data sample approximately sixty times larger. Starting from the nearly 100% decay of both top quarks through the electroweak transition t→Wb, we focus on events in the dilepton final states e+e−, µ+µ−, and e±µ∓, where both W bosons decay
lep-tonically (W → `ν`), but with contributions from W →τντ arising only when the τ leptons decay into`ν`ντ (` =e or µ) states. A cross-section measurement based on τ leptons that de-cay into hadrons and a neutrino can be found in Ref. [15]. The final states contain two leptons of opposite electric charge, their accompanying neutrinos from the W-boson decays, and two jets of particles resulting from the hadronization of the b quarks. These modes correspond to (6.45±0.11)% [16] of all tt decay channels, including the partial contributions from τ leptons. This measurement is based on a data sample corresponding to an integrated luminosity of 2.3± 0.1 fb−1recorded by the CMS experiment. A profile likelihood-ratio (PLR) method [17, 18], as well as a counting analysis based on direct selections, are used to extract the tt cross section. A brief description of the components of the CMS detector specific to this analysis is provided in Section 2, followed by details of event Monte Carlo (MC) simulation in Section 3, and event selection in Section 4. Estimations of backgrounds yields are presented in Section 5. Following a discussion of systematic uncertainties in Section 6, the event yields in data are compared with simulations in Section 7. The results of the measurement of the tt cross section are presented in Section 8, followed by a summary in Section 9.
2
The CMS detector
The central feature of the CMS apparatus is a superconducting solenoid, 13 m in length and 6 m in diameter, which provides an axial magnetic field of 3.8 T. The bore of the solenoid is out-fitted with a variety of particle-detection systems. Charged-particle trajectories are measured with the silicon pixel and strip trackers that cover 0 < φ < 2π in azimuth and |η| < 2.5 in
pseudorapidity, where η is defined as η = −ln[tan(θ/2)], with θ being the polar angle of the
trajectory of the particle with respect to the anticlockwise beam direction. A crystal electro-magnetic calorimeter (ECAL) and a brass/scintillator hadronic calorimeter surround the inner tracking volume and provide high-resolution measurements of energy (E) used to reconstruct
2 4 Event selection
electrons, photons and particle jets. Muons are measured in gas detectors embedded in the flux-return yoke of the solenoid. The detector is nearly hermetic, thereby providing reliable measurements of momentum imbalance in the plane transverse to the beams. A two-tier trig-ger system selects the most interesting pp collisions for analysis. A more detailed description of the CMS detector is given in Ref. [14].
3
Simulation of signal and backgrounds
The tt cross section, calculated with theMCFMprogram [19, 20] at next-to-leading order (NLO) in perturbative QCD, assuming a top-quark mass of mt = 172.5 GeV, is 158+−2324pb. Several approximate next-to-next-to-leading-order (NNLO) calculations are also available in the litera-ture, in particular those of Kidonakis (163+−1110pb [21]), Ahrens et al. (149±11 pb [22]) and the HATHOR program (164+−1310pb [23]), with the latter used to normalize the distributions and yields of simulated tt events to the measured luminosity. However, this cross section is used just to present expected rates in figures and tables and has no effect on the final measurement. Signal and background events are simulated using the MC event generators MADGRAPH (v. 5.1.1.0) [24],POWHEG(r1380) [25] orPYTHIA(v. 6.424) [26], depending on the process in ques-tion. MADGRAPH is used to model tt events, with matrix elements corresponding to up to three additional partons that are matched toPYTHIA, which is used for the subsequent hadron-ization. Decays of τ leptons are handled withTAUOLA(v. 2.75) [27].
MADGRAPHis also used to simulate the W+jets and Drell-Yan (DY: qq→Z/γ?+jets, where γ? represents the contribution from virtual photons) background samples, with up to 4 partons in the final state. For W+jets, the MADGRAPHsample provides only event with leptonic decays of W bosons. The total inclusive NNLO cross section of 31.3±1.6 nb is calculated with the FEWZ program [28]. Simulations of DY events with two oppositely charged leptons of same flavor in the final state are generated for dilepton invariant masses between 10 and 50 GeV, as well as for>50 GeV. The corresponding NNLO cross sections, also calculated with FEWZare 11.91±0.64 nb and 3.04±0.13 nb, respectively. Single-top-quark events (pp→tW−and pp→ ¯tW+) are simulated inPOWHEG, for a cross section of 15.7±0.4 pb (calculated at approximate
NNLO [29]). Inclusive production of the WW, WZ, and ZZ diboson final states is simulated withPYTHIA, and the respective cross sections are 47.0±1.5 pb, 18.2±0.7 pb, and 7.7±0.2 pb. Among all of the simulated backgrounds, only the contributions from WW, WZ, and ZZ (re-ferred as diboson in the text and labeled as VV in figures) and single-top-quark production are used to estimate the absolute number of background events. Recent measurements of single-top-quark and diboson cross sections show good agreement with SM predictions [8, 9, 30–33]. All other backgrounds are estimated from control samples in data.
Effects from additional pp interactions (pileup) are modeled by adding simulated minimum-bias events (generated with PYTHIA) to the simulated processes, using a pileup multiplicity distribution that reflects the luminosity profile of the observed pp collisions. The CMS detector response is simulated using GEANT4 (v. 9.4) [34].
4
Event selection
Events are collected using dilepton triggers (excluding “hadronic” τ triggers) that require the presence of two large transverse momentum (pT) leptons. The definitions and ranges of thresh-olds, isolation and identification requirements for dilepton triggers were changed periodically during data taking so as to adapt to changes in instantaneous luminosity delivered by the LHC.
In particular, electrons selected at the trigger stage must pass a threshold on electron transverse energy ET, that ranges from 8 to 17 GeV, as measured online by combining information from ECAL with that from the inner tracker, and muons identified in muon detectors are similarly required to exceed a threshold on pT, that ranges between 7 and 17 GeV as measured online by combining information from the outer muon detector with that from the inner tracker.
The efficiency for tt dilepton triggers is measured in data through other triggers that are only weakly correlated with the dilepton-trigger requirements. Because of the presence of a sig-nificant imbalance in transverse momentum in tt events, E/T-based triggers with different E/T thresholds are used for this purpose. At the trigger level, the E/Tis defined by the magnitude of the vectorE/~T = −∑~ET, using the transverse energies of calorimeter towers. Studies based on simulated events indicate that the E/Ttriggers are uncorrelated with the dilepton triggers. Using the measured dilepton-trigger efficiency in data, the corresponding efficiencies in sim-ulations are corrected by multiplicative data-to-simulation scale factors (SF) of 0.962±0.015, 0.977±0.016, and 1.008±0.009 for the e+e−, µ+µ−and e±µ∓final states, respectively, to
pro-vide agreement between data and simulation.
The first step in the offline selections requires the presence of a proton-proton interaction ver-tex [35] within 24 cm of the detector center along the beam line direction, and within 2 cm of the beam line in the transverse plan. These selections have an efficiency>99.5% for events with two leptons that pass selection criteria. The main primary vertex of an event corresponds to the vertex with the largest value for the scalar sum of the transverse momenta of the associated tracks.
At least two leptons in the event (either electrons or muons) are required to pass identifica-tion and isolaidentifica-tion requirements. The selecidentifica-tion criteria are similar to those of Refs. [1, 5], and can be described briefly as follows. Electron candidates [36] are based on a cluster of energy depositions in the ECAL. Clusters are matched to hits in the silicon tracker using a track recon-struction algorithm that takes into account possible energy loss due to bremsstrahlung. Muon candidates are reconstructed by combining information from the inner tracker with informa-tion from the outer muon detectors [37].
Both leptons must have pT > 20 GeV, with electrons and muons being restricted to|η| < 2.5
and|η| <2.1, respectively. The lepton-candidate tracks are required to be consistent with
origi-nating from the primary vertex, and must satisfy additional quality requirements, as described in Ref. [1, 5]. Lepton candidates are required to be isolated from other energy depositions in the event. A cone of ∆R = p(∆η)2+ (∆φ)2 < 0.3, where ∆η and ∆φ are the differences in pseudorapidity and azimuthal angle between any element of energy and the axis of the lepton, is constructed around the initial direction of the candidate. The particle energies within this cone, obtained using the particle-flow (PF) reconstruction algorithm [38], which provides a list of particles and their kinematic properties, are projected onto the plane transverse to the beam, and summed as scalar quantities, excluding the contribution from the lepton candidate. In this procedure, all charged PF particles not associated with the main primary vertex are assumed to arise from pileup events, and are excluded from the sum. Then, the relative isolation dis-criminant, Irel, is defined as the ratio of this sum to the transverse momentum of the lepton candidate. A lepton candidate is not considered as isolated and is rejected if the value of Irelis >0.20 for a muon and>0.17 for an electron. These selections are optimized using simulated tt events.
The efficiency of lepton selection is measured using a “tag-and-probe” method in dilepton events enriched in Z-boson candidates, and indicates that electron and muon reconstruction
4 4 Event selection
efficiencies are >99% [39]. The efficiencies for the above lepton-identification requirements, calculated as function of the pT and η of the leptons, are in the range of 98–99% for muons and 85–94% for electrons. The average efficiency of the lepton-isolation criterion measured in such Z events is in the range of 90–99% for both muons and electrons. The efficiencies measured in data are found to be very close to the estimates from the DY simulation. Based on an overall comparison of lepton-selection efficiencies in data and simulations, the event yield in simulation is corrected by multiplicative scale factors of 0.995±0.003, 0.997±0.005 and 0.994±0.005 for the e+e−, µ+µ− and e±µ∓ final states, respectively, to provide consistency
with data.
Accepted events are required to have at least one pair of oppositely charged leptons. While muon-charge misidentification is negligibly small, the electron-charge misidentification rate is 0.8%, as measured from Z → e+e− decays. Dilepton tt-candidate events with invariant mass M`` <20 GeV are removed from all three channels, with a consequent reduction of about 2% in
tt signal. However, this requirement significantly suppresses backgrounds from heavy-flavor resonances, as well as contributions from low-mass DY processes. In events containing several possible `+`− pairs that pass all acceptance requirements, only the pair of leptons with the highest sum of scalar transverse momenta is retained. To suppress contributions from Z boson production, the invariant mass of the dilepton system is required to be outside the range of 76 to 106 GeV for both the e+e− and µ+µ− modes. According to simulation, this invariant
mass requirement rejects about 91% of the DY events, at the cost of rejecting≈24% of both the e+e−and µ+µ−tt signal events.
The anti-kT clustering algorithm [40] with a distance parameter R = 0.5 is used for jet clus-tering. Jets are reconstructed based on information from the calorimeter, tracker, and muon systems [41] using PF reconstruction. Jet energy corrections rely on simulations and on studies performed with exclusive two-jet and photon+jet events in data. To minimize the impact of pileup, charged PF particles not associated with the primary event vertex [38] are ignored in reconstructing jets. After eliminating the charged component of pileup events, the neutral com-ponent is removed by applying a residual energy correction, following the “area-based” proce-dure described in Refs. [42, 43]. Jets are also required to satisfy pT >30 GeV and|η| <2.5. For
dilepton tt candidates with at least two jets and before applying any b-tagging requirement, both b-quark jets from tt decays pass the jet selection criteria in about 65% of the events, as predicted by the tt simulation.
For the offline analysis, the missing transverse energy (E/T) is redefined by the magnitude of the vectorial sum of the particle transverse momenta/E~T = −∑~pT, calculated using the particles reconstructed with the PF algorithm [44]. As implied above, E/Tcorresponds to a distinguishing feature of tt events in the dilepton channel because of escaping energetic neutrinos. Neither the dominant DY background (Z/γ? → e+e−and µ+µ−), nor the smaller background from false
isolated leptons in multijet events, provide a source of large E/T. We require E/T >40 GeV in the e+e−and µ+µ− modes in tt events with at least two jets. This cut causes a loss of≈25% of tt
signal in these channels, but reduces the contribution from DY production by about a factor of 30. No E/Trequirement is imposed for the e±µ∓mode, as there is very little contamination from
DY events in this channel.
To account for any mismodeling of the E/T distribution, the efficiency of the E/Tselection in the tt simulation is corrected using data. The corresponding data-to-simulation SF are estimated by applying the E/Tselection to e±µ∓data, after correcting for the presence of background. The
systematic uncertainties on these factors arise from two sources: (i) the background contami-nation in the e±µ∓channel, which is changed in the study by±30%, and (ii) the difference in
lepton energy resolution between electrons and muons, which affects differently the E/Tin e+e− and µ+µ− channels relative to the e±µ∓channel. The data-to-simulation SF are 1.008±0.012
and 1.008±0.016 for the e+e− and µ+µ− final states, respectively, with the uncertainties
ac-counting for both statistical and systematic effects summed in quadrature.
As dilepton tt events contain jets from the hadronization of b quarks, requiring b tagging can re-duce background from events that do not contains b jets. Jets are identified as b jets originating from b quarks through a “combined secondary vertex” (CSV) algorithm [45], which provides a b-tagging discriminant by combining information from secondary vertices and track-based lifetime measurements. The chosen b-tagging selection has an efficiency of 80–85% for each b jet in dilepton tt events, and a 10% mistagging rate for light-flavor or gluon jets misidentified as b jets, both estimated from inclusive simulated tt events. The b-tagging efficiency can be esti-mated from tt events in data, as described in Ref. [46]. To avoid statistical correlations between the extraction of the b-tagging efficiency and the tt cross section, the b-tagging performance is measured from multijet events in data [45], and used to correct the b-tagging performance of the simulation. This analysis uses the b-tagging information either as input to a likelihood fit (in the PLR method presented in Section 8.1) or directly to select events that are required to contain at least one b-tagged jet (in a counting analysis used as a cross-check, and presented in Section 8.2).
5
Background estimates
The main backgrounds in this analysis arise from DY, diboson, and single-top-quark events (tW), where at least two prompt leptons are produced from Z or W decays. Other background sources, such as tt events with decays to lepton+jets or no leptons at all (all jets), or generic multijet (MJ) events, are related to the presence of at least one jet reconstructed incorrectly as a lepton, which mainly happens for electrons, or a lepton from the decay of bottom or charm hadrons, which mainly happens for muons.
The yields from background processes with smallest contributions to tt candidates, correspond-ing to scorrespond-ingle-top-quark and diboson production, are estimated directly from simulations. This section focuses on other backgrounds, which are not adequately described through simulation, such as the DY contribution, and events with leptons that do not arise from W or Z decays. In these cases, the background estimates are based on data.
5.1 Backgrounds from Drell-Yan contribution
To estimate the background from DY events contributing into e+e−and µ+µ−tt final states, we
use the method described in Refs. [1, 5]. The number of DY events in data that pass the Z-boson veto on M``can be estimated from the number of events in data with a dilepton invariant mass
within 76 < M`` < 106 GeV, scaled by the ratio (Rout/in) of events that fail and that pass this selection, which is estimated through DY simulation.
To achieve a better estimate of this background, the value of Rout/in is corrected using data. In particular, Rout/inis sensitive to detector effects, such as the modeling of lepton resolution and the dependence of the fraction of vetoed DY events for different requirements on jet multiplic-ities. The value of Rout/inis corrected for these effects by using control regions enriched in DY events in data.
A 15% systematic uncertainty is assigned to account for remaining discrepancies in the de-pendence of Rout/in on E/T. Using the data-corrected Rout/in values leads to the final data-to-simulation scale factors of 1.86±0.50 and 1.76±0.36 for the e+e−and µ+µ−channels,
respec-6 5 Background estimates
tively. After requiring at least one b-tagged jet, there are too few events in data to perform a precise estimation, which leads to larger uncertainties on the corresponding scale factors, yielding 2.04±0.52 and 1.67±0.42 for the e+e−and µ+µ−channels, respectively.
Finally, most of the background contribution in the e±µ∓ channel is from Z/γ∗ → ττ →
eνeντµνµντevents. As the yield from this final state corresponds to a fraction of about 3% of the total DY cross section, its impact is expected to be small. In addition, because of the presence of additional neutrinos from τ decays, the dilepton invariant mass is often well below the value of the Z-boson mass. The DY contamination of the e±µ∓channel is therefore estimated
through a fit of two components to the dilepton invariant-mass distribution, one component reflecting the dilepton mass distribution for Z/γ?events, and the other corresponding mainly to tt, single-top-quark and diboson events. The templates for these components are extracted from simulations. The systematic effects that arise from the small contamination of single-top-quark and diboson events are negligible relative to the large statistical uncertainty of the fit. The data-to-simulation scale factor for the e±µ∓channel, following the jet selection, is found to
be 1.34±0.29.
The estimates of the DY contributions to the tt data sample are given in Section 7, before and after requiring at least one b-tagged jet.
5.2 Backgrounds with leptons not from W/Z decays
A data-based method is also used to estimate the background from misidentified leptons, and from well-identified leptons that pass the isolation requirement but which come from semi-leptonic decays of bottom or charm hadrons contained within jets. These leptons are referred to as non-prompt leptons in the following. Three categories of backgrounds can be defined: signal-like, W-like, and MJ-like sources, containing two, one, and no true isolated (prompt) leptons, respectively. The signal-like sample contains tt signal events, but also DY, single-top-quark, and diboson events. The W-like sample consists of W+jets events and tt events observed in the lepton+jets channel. The MJ-like sample contains mainly generic multijet events or tt events in all-jets final states.
The number of events in each of the above categories is defined by relaxing the single-lepton isolation from Irel < 0.17 and Irel < 0.20 for electrons and muons, respectively (which corre-sponds to the definition of “tight” leptons), to Irel <0.8 for both flavors of leptons (which de-fines “loose” leptons). Dilepton samples are then constructed to correspond to loose, medium, and tight events, respectively, defined by two loose, at least one tight, and two tight isolated leptons. Only the tight dilepton sample is used to measure σtt.
By introducing probabilities for a loose event to pass medium or tight criteria, and the probabil-ity of a medium event to be accepted as a tight event, a system of equations can be constructed to estimate the number of signal-like, W-like, and MJ-like events. The probabilities can be ex-pressed in terms of individual probabilities for prompt and non-prompt leptons that pass the relaxed isolation selection to also pass the tight isolation requirement. The prompt-lepton effi-ciencies are estimated using Z events in data, in a manner similar to that discussed in Section 4, while the rates for non-prompt leptons are estimated using a data sample enriched in multi-jet events. The corresponding systematic uncertainties are estimated by half of the difference between efficiencies determined from data and from simulation studies.
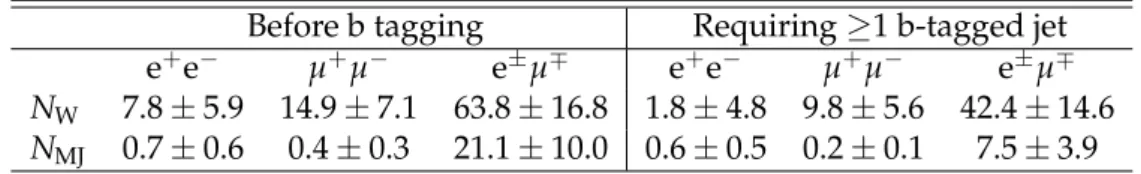
The estimated number of W-like (NW) and MJ-like (NMJ) background events in data before and after requiring at least one b-tagged jet are presented in Table 1. The uncertainties account for both statistical and systematic contributions to the efficiency for single prompt and
non-prompt loose leptons to pass the tight selection. The effect of the b-tagging selection efficiency and mistagging rates are estimated from simulation.
Table 1: Estimated number of W-like (NW) and MJ-like (NMJ) background events in data before and after b tagging.
Before b tagging Requiring≥1 b-tagged jet e+e− µ+µ− e±µ∓ e+e− µ+µ− e±µ∓
NW 7.8±5.9 14.9±7.1 63.8±16.8 1.8±4.8 9.8±5.6 42.4±14.6 NMJ 0.7±0.6 0.4±0.3 21.1±10.0 0.6±0.5 0.2±0.1 7.5±3.9
6
Sources of systematic uncertainty
Systematic uncertainties considered in this measurement include those from biases in detector performance, deviations in tt-signal acceptance due to ambiguities in modeling tt production, precision of background estimates, and the uncertainty on integrated luminosity [47].
A correction is applied to event rates in simulated tt samples, to account for differences in dilepton-trigger and dilepton offline selection efficiencies between data and simulations, as de-scribed in Section 4. The combined data-to-simulation SF, with their uncertainties defined by adding the statistical and systematic sources in quadrature, are SFee = 0.957±0.016, SFµµ = 0.974±0.016, and SFeµ = 1.002±0.010, for the e+e−, µ+µ−, and e±µ∓ tt final states,
respec-tively.
Systematic uncertainties arising from the lepton energy scale are estimated by comparing the position of the dilepton invariant-mass peak in Z/γ?-enriched events in data with simulations, applying only trigger and dilepton selection criteria. The effect corresponds to a 0.3% uncer-tainty on the tt selection efficiency for all three dilepton final states.
The uncertainties on jet energy scale (JES) and jet energy resolution (JER) affect the efficiency of jet selection. The impact of uncertainty on JES is estimated from the change observed in the number of selected MC tt events after changing the jet momenta within the JES uncertain-ties [48]. Similarly, the effect of the JER uncertainty is estimated by changing the resolution on jet momenta by±10%, and then estimating the corresponding change in the number of selected MC tt events. The systematic uncertainty on E/T is discussed in Section 4.
After requiring at least one b-tagged jet, the uncertainties on the data-to-simulation factors for b tagging are propagated to the selection efficiency in the simulated tt samples. The uncertainties on the b-tagging scale factors in tt signal events are≈2% for b jets and≈10% for mistagged jets [45].
The 8% uncertainty in the inelastic proton-proton cross section at√s =7 TeV [49], when prop-agated to the modeling of pileup, leads to an uncertainty of 0.5% on the yield of simulated tt events.
Systematic uncertainties on the MC modeling of tt production are estimated by using MAD -GRAPHwith different parameter settings, such as renormalization/factorization scales µ, which are increased and decreased by a factor of 2 to estimate the effect on the calculated tt cross sec-tion. Other studies change the threshold that controls the matching of partons from the matrix element with those from parton showers. Systematic uncertainties in the tt event selection efficiency from independent changes in the two µ scales and in the matching of partons pro-duce a total uncertainty of 0.6% for each source. Systematic effects from the choice of parton
8 7 Event yields and distributions
distribution functions are also studied and found to be negligible.
The systematic uncertainty arising from the uncertainty on the measured values of leptonic branching fractions of the W boson (0.1080±0.0009 [16]) translates into a 1.7% uncertainty on the number of selected MC tt events. This uncertainty can be reduced through a more precise measurement of the leptonic branching fractions of the W and used to recalculate the measured cross section.
Uncertainties on the selected number of single-top-quark and diboson events are estimated through simulation, and arise from the same kind of sources that affect the tt signal. The above-described detector effects contribute to an 8% uncertainty on the number of selected background events, which is dominated by the uncertainty on the JES. In events with at least one b-tagged jet, the uncertainty from b tagging is≈15% for diboson and 5% for single-top-quark events, arising mainly from misidentification of light-flavor jets. In addition, an un-certainty in the cross section for single-top-quark and diboson backgrounds, estimated to be ≈20% [9, 31–33], is added in quadrature.
Table 2 summarizes the impact of relative systematic uncertainties from selection efficiencies in simulated tt signal events. Uncertainties on background contamination from DY processes and from events with non-prompt leptons are estimated from data, as described in Sections 5.1 and 5.2, and given in Table 3 of Section 7.
Table 2: Summary of the relative (%) systematic uncertainties on the number of signal tt events, after applying the full selection criteria, both, before b tagging and with at least one b-tagged jet in the event. Combined uncertainties are listed for the sum of contributions from the three dilepton channels, except for lepton efficiencies, which are given separately for e+e−, µ+µ−,
and e±µ∓events.
Uncertainty on number of tt events (%)
Source Without b tagging ≥1 b-tagged jet
Luminosity 2.2 2.2
Lepton efficiencies 1.7 (ee) / 1.7 (µµ) / 1.0 (eµ) 1.7 (ee) / 1.7 (µµ) / 1.0 (eµ)
Lepton energy scale 0.3 0.3
Jet energy scale 1.8 1.9
Jet energy resolution 0.5 0.3
E
/T efficiency 1.4 1.3
b tagging - 0.7
Pileup 0.5 0.5
Scale of QCD (µ) 0.6 0.6
Matching partons to showers 0.6 0.6
W branching fraction 1.7 1.7
7
Event yields and distributions
In this section, the predicted distributions from simulation are compared with those from data. When possible, the yields predicted for background are estimated using data, as discussed in Section 5. The remaining backgrounds, as well as the distributions in simulated tt events, are scaled to the measured integrated luminosity, assuming a tt cross section of 164 pb [23]. In the figures below, the hatched regions correspond to uncertainties on the predicted event yields. Transverse momentum distributions of leptons and jets are shown, respectively, for the largest
(leading) pTand next-to-largest (next-to-leading) pTof each set of these objects, after jet multi-plicity selections, separately for the two`+`−and for all combined dilepton channels, in Figs. 1 and 2, respectively. The ratio of the data to the sum of simulations for the signal and back-grounds are shown in the bottom panels of each of the figures. The corresponding M`` and
E
/T distributions and their ratios to expectations are shown, respectively, in Figs. 3 and 4, sep-arately for the combined two `+`− channels and for the e±µ∓ channel. The multiplicity of
selected jets is presented in Fig. 5, after applying the dilepton and E/Tselections. The observed number of events with less than two jets is used to check the reliability of background pre-dictions. The multiplicity of jets that pass the b-tagging selections is given in Fig. 6, again separately for the summed e+e−and µ+µ−channels, and for the e±µ∓channel. The observed
number of events and the expectation from simulations and data-based predictions are pre-sented in Table 3, for a tt cross section of 164 pb. The uncertainties shown account for statistical and systematic sources. The predicted and observed number of events are consistent within their uncertainties. Also shown in Table 3 are the acceptances for simulated tt signal events, including the two-lepton branching fractions, with and without requiring at least one b-tagged jet.
8
Measuring the tt production cross section
The tt production cross section is measured using a profile likelihood-ratio method described in Section 8.1, while Section 8.2 discusses a counting analysis used as a cross-check. The latter is based on counting the number of events in the data that survive an additional selection, which requires at least one b-tagged jet, and is referred to as a counting analysis in what follows. For ease of comparison with previous measurements, the value of mt= 172.5 GeV is used to extract the tt cross section. The dependence of σtton mtis discussed in Section 8.3.
8.1 Cross-section measurement using a profile likelihood ratio
A profile likelihood ratio [17, 18] is used to measure σtt in the individual e+e−, µ+µ−, and
e±µ∓dilepton channels, as well as in their combination. The minimum value of−2 ln[R(σtt)]
is extracted from a scan over a wide range of σtt, whereRis defined as: R(σtt) = L(σtt,{
ˆˆ Ui}) L(ˆσtt,{Uˆi})
, (1)
with L being the likelihood function with one free parameter, σtt, and a set of other parameters {Ui}, called “nuisance parameters”, that describe the estimated systematic uncertainties in the measurement. The set{Uˆˆi}denotes the conditional maximum-likelihood (ML) estimates of the {Ui}that depend on the specific value of σtt. The denominator corresponds to the maximized unconditional likelihood function, with its ML estimators defined as ˆσttand{Uˆi}. The presence of the nuisance parameters broadens the distribution of theRfunction, which reflects the loss of information on σttfrom the presence of systematic uncertainties.
We consider a likelihood defined by a probability density function binned in a 2-dimensional (2D) space of jet multiplicity (Njets) and multiplicity of b-tagged jets (Nb-jets). The predicted 2D distributions (or “templates”) are obtained by applying the event selection criteria to sim-ulated events for each contributing process, without imposing b-tagging requirements. The corresponding number of selected events in simulation, compared with the number selected in data, are shown in Fig. 7 for different combinations of (Njets,Nb-jets).
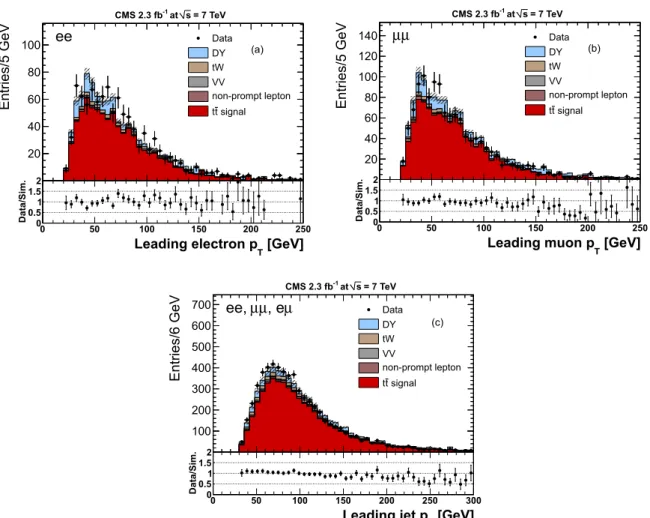
10 8 Measuring the tt production cross section Entries/5 GeV 20 40 60 80 100 = 7 TeV s at -1 CMS 2.3 fb ee Data DY tW VV non-prompt lepton signal tt [GeV] T Leading electron p 0 50 100 150 200 250 Data/Sim. 00.5 1 1.52 (a) Entries/5 GeV 20 40 60 80 100 120 140 = 7 TeV s at -1 CMS 2.3 fb µ µ Data DY tW VV non-prompt lepton signal tt [GeV] T Leading muon p 0 50 100 150 200 250 Data/Sim. 00.5 1 1.52 (b) Entries/6 GeV 100 200 300 400 500 600 700 = 7 TeV s at -1 CMS 2.3 fb µ , e µ µ ee, Data DY tW VV non-prompt lepton signal tt [GeV] T Leading jet p 0 50 100 150 200 250 300 Data/Sim. 00.5 1 1.52 (c)
Figure 1: The pTdistributions for (a) electrons, (b) muons, and (c) jets of the largest-pTafter the jet multiplicity selection. The expected distributions for tt signal and individual backgrounds are shown by the histograms, and include all data-based corrections. A tt cross section of 164 pb is used to normalize the simulated tt signal. In this and all following figures, the hatched regions show the total uncertainties on the sum of the tt and background predictions. The ratios of data to the sum of the tt and background predictions are given at the bottom of each panel and the corresponding error bars include statistic and systematic uncertainties added in quadrature.
Entries/5 GeV 50 100 150 200 250 = 7 TeV s at -1 CMS 2.3 fb ee Data DY tW VV non-prompt lepton signal tt [GeV] T
Second leading electron p
0 50 100 150 200 250 Data/Sim. 00.51 1.52 2.53 (a) Entries/5 GeV 50 100 150 200 250 300 350 400 = 7 TeV s at -1 CMS 2.3 fb µ µ Data DY tW VV non-prompt lepton signal tt [GeV] T
Second leading muon p
0 50 100 150 200 250 Data/Sim. 00.51 1.52 2.53 (b) Entries/6 GeV 200 400 600 800 1000 = 7 TeV s at -1 CMS 2.3 fb µ , e µ µ ee, Data DY tW VV non-prompt lepton signal tt [GeV] T
Second leading jet p
0 50 100 150 200 250 300
Data/Sim. 00.5 1 1.52
(c)
Figure 2: Same as Fig. 1, but for the second-largest pTelectrons, muons and jets in each event.
Entries/7 GeV 200 400 600 800 1000 1200 1400 at s = 7 TeV -1 CMS 2.3 fb µ µ ee, Data DY tW VV non-prompt lepton signal tt [GeV] ll M 0 50 100 150 200 250 300 350 Data/Sim. 00.5 1 1.52 (a) Entries/7 GeV 50 100 150 200 250 300 350 = 7 TeV s at -1 CMS 2.3 fb µ e Data DY tW VV non-prompt lepton signal tt [GeV] ll M 0 50 100 150 200 250 300 350 Data/Sim. 00.5 1 1.52 (b)
Figure 3: Same as Fig. 1, but for the dilepton invariant-mass distribution of (a) the sum of the e+e−and µ+µ−channels, and (b) the e±µ∓channel. The gap in the former distribution reflects
12 8 Measuring the tt production cross section Entries/5 GeV 200 400 600 800 1000 1200 1400 1600 1800 2000 2200 = 7 TeV s at -1 CMS 2.3 fb µ µ ee, Data DY tW VV non-prompt lepton signal tt [GeV] T Missing E 0 20 40 60 80 100 120 140 Data/Sim. 00.5 1 1.52 (a) Entries/5 GeV 50 100 150 200 250 300 350 = 7 TeV s at -1 CMS 2.3 fb µ e Data DY tW VV non-prompt lepton signal tt [GeV] T Missing E 0 20 40 60 80 100 120 140 Data/Sim. 00.5 1 1.52 (b)
Figure 4: The E/Tdistributions after the selection on jet multiplicity. Details on the distributions are same as for Fig. 1.
Entries 1000 2000 3000 4000 5000 6000 7000 8000 9000 = 7 TeV s at -1 CMS 2.3 fb µ µ ee, Data DY tW VV non-prompt lepton signal tt jet multiplicity 0 1 2 3 ≥ 4 Data/Sim. 0.60.8 1 1.2 1.4 (a) Entries 1000 2000 3000 4000 5000 6000 = 7 TeV s at -1 CMS 2.3 fb µ e Data DY tW VV non-prompt lepton signal tt jet multiplicity 0 1 2 3 ≥ 4 Data/Sim. 0.60.8 1 1.2 1.4 (b)
Figure 5: The jet multiplicity for events passing the dilepton and E/T criteria, but before the b-tagging requirement, for (a) the sum of e+e−and µ+µ−channels, and (b) the e±µ∓channel.
Entries 500 1000 1500 2000 2500 3000 = 7 TeV s at -1 CMS 2.3 fb µ µ ee, Data DY tW VV non-prompt lepton signal tt
b-tagged jet multiplicity
0 1 2 ≥ 3 Data/Sim. 0.60.8 1 1.2 1.4 (a) Entries 500 1000 1500 2000 2500 3000 3500 = 7 TeV s at -1 CMS 2.3 fb µ e Data DY tW VV non-prompt lepton signal tt
b-tagged jet multiplicity
0 1 2 ≥ 3 Data/Sim. 0.60.8 1 1.2 1.4 (b)
Figure 6: The multiplicity of b-tagged jets in events passing full event selections for (a) the summed e+e−and µ+
µ−channels, and (b) the e±µ∓channels.
Entries
0 200 400 600 800 1000 1200 1400 1600 1800 2000 2200 = 7 TeV s at -1 CMS 2.3 fbµ
, e
µ
µ
ee,
Data DY tW VV non-prompt lepton signal t t ) b-jets ,N jets (N (2,0) (2,1) (2,2) (3,0) (3,1) (3,2) (3,3) (≥4,0) (≥4,1) (≥4,2) Data/Sim.0.6 0.8 1 1.2 1.4Figure 7: Number of events selected for the three combined dilepton channels, as a function of the number of jets and b-tagged jets (Njets,Nb-jets) in each event. The data are shown by the dots, while the predicted tt and the contributing backgrounds are shown by the histograms. The hatched area corresponds to statistical and systematic uncertainties on the tt and on the background predictions taken in quadrature. The ratios of data to the sum of the tt and back-ground predictions are given at the bottom, with the error bars again giving the statistical and systematic uncertainties taken in quadrature.
14 8 Measuring the tt production cross section
Table 3: Number of dilepton events in the e+e−, µ+µ−, and e±µ∓channels after applying the
event-selection criteria: (a) without requiring a tagged jet, and (b) requiring at least one b-tagged jet. The results are given for the individual sources of background, tt signal for σt¯t = 164 pb, and the data. The uncertainties reflect statistical and systematic uncertainties added in quadrature. Panel (c) gives the tt acceptance multiplied by the selection efficiency and by the branching fractions B (in %) of tt to two-lepton states, estimated using tt simulated events.
(a) Number of events Without b-tagging selection
Source e+e− µ+µ− e±µ∓ Drell-Yan 136±29 217±45 220±46 Nonprompt leptons 9±6 15±7 85±20 Diboson 14±4 16±4 55±13 Single top 42±9 53±11 156±32 Total background 201±31 301±47 516±61 tt signal 801±34 1041±43 3253±126 Total predicted 1002±46 1342±64 3769±140 Data 1021 1259 3734 (b)≥1b-tagged jet Source µ+µ− e+e− e±µ∓ Drell-Yan 62±16 82±21 89±19 Nonprompt leptons 2.4±4.8 10.0±5.5 50±15 Diboson 5.7±1.4 6.1±1.5 22.3±5.3 Single top 37.5±7.8 47.0±9.8 140±29 Total background 108±18 145±24 301±38 tt signal 759±33 991±42 3082±122 Total predicted 867±38 1136±48 3383±128 Data 875 1074 3339 (c) tt acceptance×eff.×B (%) b-tagging selection e+e− µ+µ− e±µ∓ No selection 0.22±0.01 0.28±0.01 0.87±0.04 ≥1b-tagged jet 0.20±0.01 0.27±0.01 0.83±0.04
Without systematic uncertainties, the likelihood function represents the product of Poisson dis-tributions that reflect the statistical content of each bin. To incorporate systematic uncertainties, Gaussian terms are introduced for the nuisance parameters into the likelihood function as con-straints on{Ui}. A systematic uncertainty can affect the 2D distribution by changing its nor-malization and its differential dependence. The effect is estimated by means of an interpolation between the original 2D template and the ones obtained by changing each nuisance parameter Ui by ±1 standard deviation. For uncertainties on data-to-simulation SF in tagging of b jets and light-flavor jets, the change in template for a given process is computed analytically for each bin of the distribution, according to the combinatorial probability of tagging Nb-jetsjets in an event with Njetsjets.
TheRfunction given in Eq. (1) is used to extract the uncertainty on σttfrom a change by±0.5 of the fitted−2 ln[R]value relative to its minimum. This represents the Gaussian equivalent of 68% confidence for the combined statistical and systematic uncertainties. The minimization of ln[R]corresponds to an integration over the parametrized systematic uncertainties (Ui), which also reduces the overall uncertainty on σtt.
The technique described for a given decay channel can be extended to the combined channels. The e+e−, µ+µ−, and e±µ∓channels are statistically independent because they correspond to
independent data samples. The likelihood function for the combined channels is expressed therefore as the product of the individual likelihood functions. Correlations among the chan-nels are introduced through the nuisance parameters, which are taken to be the same for the e+e−, µ+µ−, and e±µ∓channels. The systematic uncertainties included in the PLR analysis are
those described in Section 6 and summarized in Tables 2 and 3.
The results for each dilepton channel and for the combined sample are presented in Table 4. The uncertainties reflect statistical and systematic sources, and the uncertainty on integrated luminosity. The measurements from the three dilepton channels are consistent within their uncertainties. The combined result from the PLR method is 161.9±2.5 (stat.)+−5.15.0(syst.)± 3.6 (lumi.) pb.
Table 4: Measured σttin pb for a top quark mass of 172.5 GeV for each of the dilepton channels, as well as for their combination. The quoted uncertainties are, respectively, from statistical and systematic sources and the contributions from integrated luminosity.
Channel PLR method Counting analysis
ee 168.0±6.6+−7.67.0±3.7 165.9±6.4±7.0±3.6
µµ 156.3±5.6+−7.76.6±3.5 153.8±5.4±6.6±3.4
eµ 161.9±3.1+−5.85.4±3.6 161.6±3.1±5.6±3.6 Combined 161.9±2.5+−5.15.0±3.6 161.0±2.6±5.6±3.6
8.2 Measurement of σtt using a counting analysis
The tt production cross section is also measured by counting events and applying the expres-sion:
σtt= N−NB
AL , (2)
where N is the total number of dilepton events observed in data, NBis the number of estimated background events, A is the mean acceptance multiplied by the selection efficiency and by the branching fraction B(tt → dilepton final state), for all produced tt events, and L is the integrated luminosity. The measurement is performed separately for each dilepton channel and the individual channels are combined using a BLUE procedure [50]. While the PLR method adjusts the jet and the b-tagged jet multiplicities without applying specific b-tagging selections, the counting analysis requires at least one b-tagged jet in an accepted event. This enriches the purity of the tt signal in the data sample, but leads to only 5% loss in the number of tt events. The values of N, NB, andAare given in Table 3.
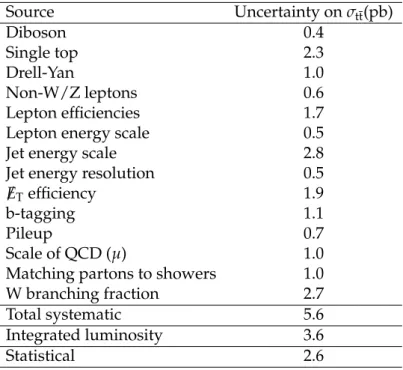
The cross sections measured with this method are given in Table 4. As for the PLR method, the systematic uncertainties are described in Section 6 and summarized in Tables 2 and 3. A break-down of the statistical and systematic uncertainties contributing to the combined measurement is given in Table 5. The measurements agree very well with those based on the PLR method. Compared to the PLR method, the analysis presented in this section follows an alternative approach that leads to a slightly less sensitive measurement. The PLR and the counting anal-ysis measurements are not combined since they are highly correlated: both are extracted from almost the same data sample, and are affected by essentially the same systematic uncertainties.
16 9 Summary
Table 5: Summary of the individual contributions to the systematic uncertainty on the σtt mea-surement for the combined dilepton sample, using the counting analysis. The uncertainties are given in pb. The statistical uncertainty on the result is given for comparison.
Source Uncertainty on σt¯t(pb) Diboson 0.4 Single top 2.3 Drell-Yan 1.0 Non-W/Z leptons 0.6 Lepton efficiencies 1.7
Lepton energy scale 0.5
Jet energy scale 2.8
Jet energy resolution 0.5
E
/Tefficiency 1.9
b-tagging 1.1
Pileup 0.7
Scale of QCD (µ) 1.0
Matching partons to showers 1.0
W branching fraction 2.7
Total systematic 5.6
Integrated luminosity 3.6
Statistical 2.6
8.3 Cross section and mass of the top quark
As the acceptance for tt signal depends on the top-quark mass, the measured tt cross section also depends on the value of the top-quark mass used to simulate tt events. The results pre-sented in Table 4 for both the PLR and the counting analysis use a top-quark mass of 172.5 GeV without any additional uncertainties attributed to this quantity.
The dependence of the cross section on mt in the range 160–185 GeV is studied by measur-ing σtt in tt samples simulated at different mt values. The cross-section dependence can be parametrized as
σtt/σtt(mt =172.5) = 1.00−0.008× (mt−172.5) −0.000137× (mt−172.5)2. (3) For completeness, the combined cross section is also extracted using the PLR method at the currently accepted value mt = 172.9±0.6 (stat.)±0.9 (syst.) GeV [16], which yields a cross sec-tion of σtt=161.3±2.5 (stat.)+−5.35.2(syst.)±3.6 (lumi.) pb, where the systematic uncertainty also accounts for the uncertainty on the value of mt.
9
Summary
A measurement of the tt production cross section at √s = 7 TeV is presented for events con-taining e+e−, µ+µ−, or e±µ∓lepton pairs, at least two jets, and a large imbalance in transverse
momentum. The measurement is performed using two approaches: a profile likelihood-ratio procedure and an event-counting analysis that relies on the presence of at least one b-tagged jet. The results from the individual dilepton channels and from the two analysis methods are consistent with each other, and are also found to be compatible with previous published mea-surements. For the profile likelihood-ratio method, the cross section for the combined dilepton
channels amounts to σtt = 161.9±2.5 (stat.)+−5.15.0(syst.)±3.6 (lumi.) pb, in agreement with the prediction of the standard model. This result corresponds to the most precise measurement of
σttat 7 TeV.
Acknowledgments
We congratulate our colleagues in the CERN accelerator departments for the excellent perfor-mance of the LHC machine, and thank the technical and administrative staffs at CERN and other CMS institutes for their contributions. This work was supported by the Austrian Federal Ministry of Science and Research; the Belgium Fonds de la Recherche Scientifique, and Fonds voor Wetenschappelijk Onderzoek; the Brazilian Funding Agencies (CNPq, CAPES, FAPERJ, and FAPESP); the Bulgarian Ministry of Education and Science; CERN; the Chinese Academy of Sciences, Ministry of Science and Technology, and National Natural Science Foundation of China; the Colombian Funding Agency (COLCIENCIAS); the Croatian Ministry of Science, Education and Sport; the Research Promotion Foundation, Cyprus; the Estonian Academy of Sciences and NICPB; the Academy of Finland, Finnish Ministry of Education and Culture, and Helsinki Institute of Physics; the Institut National de Physique Nucl´eaire et de Physique des Particules / CNRS, and Commissariat `a l’ ´Energie Atomique et aux ´Energies Alternatives / CEA, France; the Bundesministerium f ¨ur Bildung und Forschung, Deutsche Forschungsgemeinschaft, and Helmholtz-Gemeinschaft Deutscher Forschungszentren, Germany; the General Secretariat for Research and Technology, Greece; the National Scientific Research Foundation, and Na-tional Office for Research and Technology, Hungary; the Department of Atomic Energy and the Department of Science and Technology, India; the Institute for Studies in Theoretical Physics and Mathematics, Iran; the Science Foundation, Ireland; the Istituto Nazionale di Fisica Nu-cleare, Italy; the Korean Ministry of Education, Science and Technology and the World Class University program of NRF, Korea; the Lithuanian Academy of Sciences; the Mexican Fund-ing Agencies (CINVESTAV, CONACYT, SEP, and UASLP-FAI); the Ministry of Science and Innovation, New Zealand; the Pakistan Atomic Energy Commission; the State Commission for Scientific Research, Poland; the Fundac¸˜ao para a Ciˆencia e a Tecnologia, Portugal; JINR (Ar-menia, Belarus, Georgia, Ukraine, Uzbekistan); the Ministry of Science and Technologies of the Russian Federation, and Russian Ministry of Atomic Energy; the Ministry of Science and Technological Development of Serbia; the Ministerio de Ciencia e Innovaci ´on, and Programa Consolider-Ingenio 2010, Spain; the Swiss Funding Agencies (ETH Board, ETH Zurich, PSI, SNF, UniZH, Canton Zurich, and SER); the National Science Council, Taipei; the Scientific and Technical Research Council of Turkey, and Turkish Atomic Energy Authority; the Science and Technology Facilities Council, UK; the US Department of Energy, and the US National Science Foundation.
Individuals have received support from the Marie-Curie programme and the European Re-search Council (European Union); the Leventis Foundation; the A. P. Sloan Foundation; the Alexander von Humboldt Foundation; the Associazione per lo Sviluppo Scientifico e Tecno-logico del Piemonte (Italy); the Belgian Federal Science Policy Office; the Fonds pour la For-mation `a la Recherche dans l’Industrie et dans l’Agriculture (FRIA-Belgium); the Agentschap voor Innovatie door Wetenschap en Technologie (IWT-Belgium); and the Council of Science and Industrial Research, India.
References
18 References
Production in Proton-Proton Collisions at√s = 7 TeV”, Phys. Lett. B 695 (2011) 424, doi:10.1016/j.physletb.2010.11.058, arXiv:1010.5994.
[2] ATLAS Collaboration, “Measurement of the top quark-pair production cross section with ATLAS in pp collisions at√s = 7 TeV”, Eur. Phys. J. C 71 (2011) 1577,
doi:10.1140/epjc/s10052-011-1577-6, arXiv:1012.1792.
[3] ATLAS Collaboration, “Measurement of the cross section for top-quark pair production in pp collisions at√s = 7 TeV with the ATLAS detector using final states with two high-pt leptons”, JHEP 1205 (2012) 059, doi:10.1007/JHEP05(2012)059, arXiv:1202.4892.
[4] ATLAS Collaboration, “Measurement of the top quark pair production cross-section with ATLAS in the single lepton channel”, Phys. Lett. B. 711 (2012) 244,
doi:10.1016/j.physletb.2012.03.083, arXiv:1201.1889.
[5] CMS Collaboration, “Measurement of the t¯t production cross section and the top quark mass in the dilepton channel in pp collisions at√s = 7 TeV”, JHEP 07 (2011) 049, doi:10.1007/JHEP07(2011)049, arXiv:1105.5661.
[6] CMS Collaboration, “Measurement of the t¯t Production cross section in pp Collisions at√ s = 7 TeV using the Kinematic Properties of Events with Leptons and Jets”, Eur. Phys. J. C 71 (2011) 1721, doi:10.1140/epjc/s10052-011-1721-3, arXiv:1106.0902. [7] CMS Collaboration, “Measurement of the t¯t Production cross section in pp Collisions at 7
TeV in Lepton + Jets Events using b-quark Jet Identification”, Phys. Rev. D 84 (2011) 092004, doi:10.1103/PhysRevD.84.092004, arXiv:1108.3773.
[8] ATLAS Collaboration, “Evidence for the associated production of a W boson and a top quark in ATLAS at√s = 7 TeV”, (2012). arXiv:1205.5764. Submitted to Phys. Lett. B. [9] CMS Collaboration, “Measurement of the t-channel single top quark production cross
section in pp collisions at√s = 7 TeV”, Phys. Rev. Lett. 107 (2011) 091802, doi:10.1103/PhysRevLett.107.091802, arXiv:1106.3052.
[10] ATLAS Collaboration, “Measurement of the t-channel single top-quark production cross section in pp collisions atp(s=7 TeV with the ATLAS detector”, (2012).
arXiv:1205.3130. Submitted Phys. Lett. B.
[11] CMS Collaboration, “Measurement of the charge asymmetry in top-quark pair production in proton-proton collisions at√s = 7 TeV”, Phys. Lett. B 709 (2012) 28, doi:10.1016/j.physletb.2012.01.078, arXiv:1112.5100.
[12] ATLAS Collaboration, “Search for anomalous production of prompt like-sign muon pairs and constraints on physics beyond the Standard Model”, Phys. Rev. D 88 (2012) 032004, doi:10.1103/PhysRevD.85.032004, arXiv:1201.1091.
[13] ATLAS Collaboration, “Search for new phenomena in t¯t events with large missing transverse momentum”, Phys. Rev. Lett. 108 (2012) 041805,
doi:10.1103/PhysRevLett.108.041805, arXiv:1109.4725.
[14] CMS Collaboration, “The CMS experiment at the CERN LHC”, JINST 3 (2008) S08004, doi:10.1088/1748-0221/3/08/S08004.
[15] CMS Collaboration, “First measurement of the top quark pair production cross section in the dilepton channel with tau leptons in the final state in pp collisions at√s = 7 TeV”, Phys.Rev.D 85 (2012) 112007, doi:10.1103/PhysRevD.85.112007,
arXiv:1203.6810.
[16] Particle Data Group Collaboration, “The Review of Particle Physics”, Phys. Rev. D 86 (2012) 010001, doi:10.1103/PhysRevD.86.010001.
[17] A. Stuart, K. Ord, and S. Arnold, “Kendall’s advanced theory of statistics. Volume 2A: classical inference and the linear model”. Hodder Arnold, 1999.
[18] G. Cowan et al., “Asymptotic formulae for likelihood-based tests of new physics”, Eur. Phys. J. C 71 (2011) 1554, doi:10.1140/epjc/s10052-011-1554-0,
arXiv:1007.1727.
[19] J. M. Campbell and R. K. Ellis, “MCFM for the Tevatron and the LHC”, Nucl. Phys. Proc. Suppl. 205-206 (2010) 10, doi:10.1016/j.nuclphysbps.2010.08.011,
arXiv:1007.3492.
[20] R. Kleiss and W. J. Stirling, “Top quark production at hadron colliders: Some useful formulae”, Z. Phys. C 40 (1988) 419, doi:10.1007/BF01548856.
[21] N. Kidonakis, “Next-to-next-to-leading soft-gluon corrections for the top quark cross section and transverse momentum distribution”, Phys. Rev. D 82 (2010) 114030, doi:10.1103/PhysRevD.82.114030, arXiv:1009.4935.
[22] V. Ahrens et al., “Renormalization-Group Improved Predictions for Top-Quark Pair Production at Hadron Colliders”, JHEP 09 (2010) 097,
doi:10.1007/JHEP09(2010)097, arXiv:1003.5827.
[23] M. Aliev et al., “HATHOR: HAdronic Top and Heavy quarks cross section calculatoR.”, Comput. Phys. Commun. 182 (2011) 1034, doi:10.1016/j.cpc.2010.12.040, arXiv:1007.1327.
[24] J. Alwall et al., “MadGraph 5: going beyond”, JHEP 06 (2011) 128, doi:10.1007/JHEP06(2011)128, arXiv:1106.0522.
[25] S. Frixione, P. Nason, and C. Oleari, “Matching NLO QCD computations with parton shower simulations: the POWHEG method”, JHEP 11 (2007) 070,
doi:10.1088/1126-6708/2007/11/070, arXiv:0709.2092.
[26] T. Sj ¨ostrand, S. Mrenna, and P. Skands, “PYTHIA 6.4 physics and manual”, JHEP 05 (2006) 026, doi:10.1088/1126-6708/2006/05/026, arXiv:hep-ph/0603175. [27] N. Davidson et al., “Universal Interface of TAUOLA Technical and Physics
Documentation”, Computer Physics Communications 183, Issue 3 (2010) 821, doi:10.1016/j.cpc.2011.12.009, arXiv:1002.0543.
[28] K. Melnikov and F. Petriello, “Electroweak gauge boson production at hadron colliders through O(α2s)”, Phys. Rev. D 74 (2006) 114017, doi:10.1103/PhysRevD.74.114017,
arXiv:hep-ph/0609070.
[29] N. Kidonakis, “Two-loop soft anomalous dimensions for single top quark associated production with a W−or H−”, Phys. Rev. D 82 (2010) 054018,
20 References
[30] CMS Collaboration, “Measurement of WW Production and Search for the Higgs Boson in pp Collisions at√s = 7 TeV”, Phys. Lett. B 699 (2011) 25,
doi:10.1016/j.physletb.2011.03.056, arXiv:1102.5429.
[31] ATLAS Collaboration, “Measurement of the WW cross section in√s = 7 TeV pp collisions with the ATLAS detector and limits on anomalous gauge couplings”, Phys. Lett. B 712 (2012) 289, doi:10.1016/j.physletb.2012.05.003, arXiv:1203.6232.
[32] ATLAS Collaboration, “Measurement of the W±Z production cross section and limits on anomalous triple gauge couplings in proton-proton collisions at√s = 7 TeV with the ATLAS detector”, Phys. Lett. B 709 (2012) 341,
doi:10.1016/j.physletb.2012.02.053, arXiv:1111.5570.
[33] ATLAS Collaboration, “Measurement of the ZZ Production Cross Section and Limits on Anomalous Neutral Triple Gauge Couplings in Proton-Proton Collisions at√s = 7 TeV with the ATLAS Detector”, Phys. Rev. Lett. 108 (2012) 041804,
doi:10.1103/PhysRevLett.108.041804, arXiv:1110.5016.
[34] J. Allison et al., “Geant4 developments and applications”, IEEE Trans. Nucl. Sci. 53 (2006) 270, doi:10.1109/TNS.2006.869826.
[35] CMS Collaboration, “CMS Tracking Performance Results from Early LHC Operation”, Eur. Phys. J. C 70 (2010) 1165, doi:10.1140/epjc/s10052-010-1491-3,
arXiv:1007.1988.
[36] CMS Collaboration, “Electron Reconstruction and Identification at√s=7 TeV”, CMS Physics Analysis Summary CMS-PAS-EGM-10-004, (2010).
[37] CMS Collaboration, “Performance of CMS muon reconstruction in pp collisions at√s = 7 TeV”, (2012). arXiv:1206.4071. Submitted to J. Instrum.
[38] CMS Collaboration, “Commissioning of the Particle-Flow Reconstruction in Minimum-Bias and Jet Events from pp Collisions at 7 TeV”, CMS Physics Analysis Summary CMS-PAS-PFT-10-002, (2010).
[39] CMS Collaboration, “Measurement of the inclusive W and Z production cross sections in pp collisions at√s = 7 TeV with the CMS experiment”, JHEP 10 (2011) 007,
doi:10.1007/JHEP10(2011)007, arXiv:1108.0566.
[40] M. Cacciari, G. P. Salam, and G. Soyez, “The anti-ktjet clustering algorithm”, JHEP 04 (2008) 063, doi:10.1088/1126-6708/2008/04/063, arXiv:0802.1189. [41] CMS Collaboration, “Jet Performance in pp Collisions at√s=7 TeV”, CMS Physics
Analysis Summary CMS-PAS-JME-10-003, (2010).
[42] M. Cacciari, G. P. Salam, and G. Soyez, “The Catchment Area of Jets”, JHEP 04 (2008) 005, doi:10.1088/1126-6708/2008/04/05, arXiv:0802.1188.
[43] M. Cacciari and G. P. Salam, “Pileup subtraction using jet areas”, Phys. Lett. B 659 (2008) 119, doi:10.1016/j.physletb.2007.09.077, arXiv:0707.1378.
[44] CMS Collaboration, “CMS MET Performance in Events Containing Electroweak Bosons from pp Collisions at√s=7 TeV”, CMS Physics Analysis Summary
[45] CMS Collaboration, “b-Jet Identification in the CMS Experiment”, CMS Physics Analysis Summary CMS-PAS-BTV-11-004, (2011).
[46] CMS Collaboration, “Measurement of the b-tagging efficiency using tt events”, CMS Physics Analysis Summary CMS-PAS-BTV-11-003, (2011).
[47] CMS Collaboration, “Absolute Calibration of the CMS Luminosity Measurement: Summer 2011 Update”, CMS Physics Analysis Summary CMS-PAS-EWK-11-001, (2011). [48] CMS Collaboration, “Determination of the Jet Energy Scale in CMS with pp Collisions at√
s =7 TeV”, CMS Physics Analysis Summary CMS-PAS-JME-10-010, (2010).
[49] TOTEM Collaboration, “First measurement of the total proton-proton cross section at the LHC energy of√s=7 TeV”, Europhys. Lett. 96 (2011) 21002,
doi:10.1209/0295-5075/96/21002, arXiv:1110.1395.
[50] L. Lyons, D. Gibaut, and P. Clifford, “How to combine correlated estimates of a single physical quantity”, Nucl. Instrum. Meth. A 270 (1988) 110,
A
The CMS Collaboration
Yerevan Physics Institute, Yerevan, Armenia
S. Chatrchyan, V. Khachatryan, A.M. Sirunyan, A. Tumasyan Institut f ¨ur Hochenergiephysik der OeAW, Wien, Austria
W. Adam, E. Aguilo, T. Bergauer, M. Dragicevic, J. Er ¨o, C. Fabjan1, M. Friedl, R. Fr ¨uhwirth1, V.M. Ghete, J. Hammer, N. H ¨ormann, J. Hrubec, M. Jeitler1, W. Kiesenhofer, V. Kn ¨unz, M. Krammer1, I. Kr¨atschmer, D. Liko, I. Mikulec, M. Pernicka†, B. Rahbaran, C. Rohringer, H. Rohringer, R. Sch ¨ofbeck, J. Strauss, A. Taurok, W. Waltenberger, G. Walzel, E. Widl, C.-E. Wulz1
National Centre for Particle and High Energy Physics, Minsk, Belarus V. Mossolov, N. Shumeiko, J. Suarez Gonzalez
Universiteit Antwerpen, Antwerpen, Belgium
S. Bansal, T. Cornelis, E.A. De Wolf, X. Janssen, S. Luyckx, L. Mucibello, S. Ochesanu, B. Roland, R. Rougny, M. Selvaggi, Z. Staykova, H. Van Haevermaet, P. Van Mechelen, N. Van Remortel, A. Van Spilbeeck
Vrije Universiteit Brussel, Brussel, Belgium
F. Blekman, S. Blyweert, J. D’Hondt, R. Gonzalez Suarez, A. Kalogeropoulos, M. Maes, A. Olbrechts, W. Van Doninck, P. Van Mulders, G.P. Van Onsem, I. Villella
Universit´e Libre de Bruxelles, Bruxelles, Belgium
B. Clerbaux, G. De Lentdecker, V. Dero, A.P.R. Gay, T. Hreus, A. L´eonard, P.E. Marage, T. Reis, L. Thomas, C. Vander Velde, P. Vanlaer, J. Wang
Ghent University, Ghent, Belgium
V. Adler, K. Beernaert, A. Cimmino, S. Costantini, G. Garcia, M. Grunewald, B. Klein, J. Lellouch, A. Marinov, J. Mccartin, A.A. Ocampo Rios, D. Ryckbosch, N. Strobbe, F. Thyssen, M. Tytgat, P. Verwilligen, S. Walsh, E. Yazgan, N. Zaganidis
Universit´e Catholique de Louvain, Louvain-la-Neuve, Belgium
S. Basegmez, G. Bruno, R. Castello, L. Ceard, C. Delaere, T. du Pree, D. Favart, L. Forthomme, A. Giammanco2, J. Hollar, V. Lemaitre, J. Liao, O. Militaru, C. Nuttens, D. Pagano, A. Pin, K. Piotrzkowski, N. Schul, J.M. Vizan Garcia
Universit´e de Mons, Mons, Belgium
N. Beliy, T. Caebergs, E. Daubie, G.H. Hammad
Centro Brasileiro de Pesquisas Fisicas, Rio de Janeiro, Brazil
G.A. Alves, M. Correa Martins Junior, D. De Jesus Damiao, T. Martins, M.E. Pol, M.H.G. Souza Universidade do Estado do Rio de Janeiro, Rio de Janeiro, Brazil
W.L. Ald´a J ´unior, W. Carvalho, A. Cust ´odio, E.M. Da Costa, C. De Oliveira Martins, S. Fonseca De Souza, D. Matos Figueiredo, L. Mundim, H. Nogima, V. Oguri, W.L. Prado Da Silva, A. Santoro, L. Soares Jorge, A. Sznajder
Instituto de Fisica Teorica, Universidade Estadual Paulista, Sao Paulo, Brazil
T.S. Anjos3, C.A. Bernardes3, F.A. Dias4, T.R. Fernandez Perez Tomei, E. M. Gregores3, C. Lagana, F. Marinho, P.G. Mercadante3, S.F. Novaes, Sandra S. Padula
Institute for Nuclear Research and Nuclear Energy, Sofia, Bulgaria
V. Genchev5, P. Iaydjiev5, S. Piperov, M. Rodozov, S. Stoykova, G. Sultanov, V. Tcholakov, R. Trayanov, M. Vutova
24 A The CMS Collaboration
University of Sofia, Sofia, Bulgaria
A. Dimitrov, R. Hadjiiska, V. Kozhuharov, L. Litov, B. Pavlov, P. Petkov Institute of High Energy Physics, Beijing, China
J.G. Bian, G.M. Chen, H.S. Chen, C.H. Jiang, D. Liang, S. Liang, X. Meng, J. Tao, J. Wang, X. Wang, Z. Wang, H. Xiao, M. Xu, J. Zang, Z. Zhang
State Key Lab. of Nucl. Phys. and Tech., Peking University, Beijing, China
C. Asawatangtrakuldee, Y. Ban, S. Guo, Y. Guo, W. Li, S. Liu, Y. Mao, S.J. Qian, H. Teng, D. Wang, L. Zhang, B. Zhu, W. Zou
Universidad de Los Andes, Bogota, Colombia
C. Avila, J.P. Gomez, B. Gomez Moreno, A.F. Osorio Oliveros, J.C. Sanabria Technical University of Split, Split, Croatia
N. Godinovic, D. Lelas, R. Plestina6, D. Polic, I. Puljak5 University of Split, Split, Croatia
Z. Antunovic, M. Kovac
Institute Rudjer Boskovic, Zagreb, Croatia
V. Brigljevic, S. Duric, K. Kadija, J. Luetic, S. Morovic University of Cyprus, Nicosia, Cyprus
A. Attikis, M. Galanti, G. Mavromanolakis, J. Mousa, C. Nicolaou, F. Ptochos, P.A. Razis Charles University, Prague, Czech Republic
M. Finger, M. Finger Jr.
Academy of Scientific Research and Technology of the Arab Republic of Egypt, Egyptian Network of High Energy Physics, Cairo, Egypt
Y. Assran7, S. Elgammal8, A. Ellithi Kamel9, S. Khalil8, M.A. Mahmoud10, A. Radi11,12 National Institute of Chemical Physics and Biophysics, Tallinn, Estonia
M. Kadastik, M. M ¨untel, M. Raidal, L. Rebane, A. Tiko
Department of Physics, University of Helsinki, Helsinki, Finland P. Eerola, G. Fedi, M. Voutilainen
Helsinki Institute of Physics, Helsinki, Finland
J. H¨ark ¨onen, A. Heikkinen, V. Karim¨aki, R. Kinnunen, M.J. Kortelainen, T. Lamp´en, K. Lassila-Perini, S. Lehti, T. Lind´en, P. Luukka, T. M¨aenp¨a¨a, T. Peltola, E. Tuominen, J. Tuominiemi, E. Tuovinen, D. Ungaro, L. Wendland
Lappeenranta University of Technology, Lappeenranta, Finland K. Banzuzi, A. Karjalainen, A. Korpela, T. Tuuva
DSM/IRFU, CEA/Saclay, Gif-sur-Yvette, France
M. Besancon, S. Choudhury, M. Dejardin, D. Denegri, B. Fabbro, J.L. Faure, F. Ferri, S. Ganjour, A. Givernaud, P. Gras, G. Hamel de Monchenault, P. Jarry, E. Locci, J. Malcles, L. Millischer, A. Nayak, J. Rander, A. Rosowsky, I. Shreyber, M. Titov
Laboratoire Leprince-Ringuet, Ecole Polytechnique, IN2P3-CNRS, Palaiseau, France
S. Baffioni, F. Beaudette, L. Benhabib, L. Bianchini, M. Bluj13, C. Broutin, P. Busson, C. Charlot, N. Daci, T. Dahms, L. Dobrzynski, R. Granier de Cassagnac, M. Haguenauer, P. Min´e, C. Mironov, I.N. Naranjo, M. Nguyen, C. Ochando, P. Paganini, D. Sabes, R. Salerno, Y. Sirois, C. Veelken, A. Zabi