Development of a reporting model
for a new fashion e-tailing service provider
Tiago Francisco Carvalhinho dos Santos
Dissertação de Mestrado
Orientador na FEUP: Prof. Pedro Sanches Amorim
Mestrado Integrado em Engenharia Industrial e Gestão
“É preciso viver, viver como um homem comum entre homens comuns. Só um homem comum pode fazer grandes coisas.”
Abstract
Omnichannel and digital commerce are among the hottest topics for luxury brands. Farfetch Black & White (B&W) is a fully-fledged agency and white-label solution for brands that build websites and set up whatever services or infrastructures the brands want to use, leveraging the established e-commerce platform of Farfetch - an e-commerce luxury goods company.
When the e-tailing world becomes a reality, the amount of ever increasing data and unknown processes, together with the brands’ lack of experience in the area, add clutter to the clients’ e-commerce managers. The main objective of this project is to feed those brand clients with a performance reporting model, and delineate all the operational reporting strategy to help them in whatever they need.
Farfetch’s processes and reporting methods are analysed first, and then two different workstreams are established using both a methodology based on Action Research. Regarding the operational reporting strategy setting, reports are discussed with the brands and its content decided. Concerning the development of the performance reporting model, some Farfetch’s KPIs are adapted and new ones are constructed. After all the useful data being acquired and filtered via SQL, the report is constructed and published on Tableau. The report allows flexible periods analysis, is divided into six main areas (Sales, Sales Details, Digital Marketing, Operations, Fraud and Payments, and Customer Service) and is developed with a focus on interactive features and on simple and effective data visualizations.
With the project under this dissertation it was possible to ease the day-to-day order and return processing at the stores and improve the operational results; to endow the clients’ managers with an interactive performance report capable of assess performance, establish comparisons and discover trends in a flexible way; and, through this innovative reporting approach, distinguish B&W as a practitioner of some of the most pioneer client-focused reporting practises within the industry.
Desenvolvimento de um modelo de relatórios para um novo
prestador de serviços de comércio eletrónico na área da moda de
luxo
Resumo
O comércio digital e o omnicanal são alguns dos temas mais em voga entre as marcas de luxo. O projeto Farfetch Black & White (B&W) criou uma agência totalmente desenvolvida e uma solução de marca branca que desenvolve websites e inicia quaisquer serviços ou infraestruturas que as marcas necessitem, alavancando-se numa plataforma de e-commerce já estabelecida pela Farfetch – uma empresa de venda online de artigos de luxo.
Quando o retalho eletrónico se torna uma realidade, o constante aumento da quantidade de dados e de processos desconhecidos, em conjunto com a falta de experiência na área por parte das marcas, cria desordem e confusão junto dos gestores. O principal objetivo deste projeto é disponibilizar às marcas clientes um modelo de um relatório de performance, assim como delinear toda a estratégia de relatórios operacionais de forma a ajudá-los naquilo que for necessário.
Os processos da Farfetch e os modelos de relatórios já existentes são analisados em primeiro lugar e depois são estabelecidas duas diferentes linhas de trabalho, ambas utilizando uma metodologia baseada em investigação-ação. No que diz respeito à definição dos relatórios operacionais, estes são discutidos com a marca, procedendo-se à decisão do seu conteúdo. Já no que concerne ao desenvolvimento do modelo do relatório de performance, alguns indicadores-chave da Farfetch são adaptados enquanto outros novos são construídos. Depois de adquirir e filtrar todos os dados via SQL, o relatório é desenvolvido e publicado recorrendo ao Tableau. O relatório permite análises com periodicidades flexíveis, está dividido em seis áreas principais (Vendas, Detalhes de Vendas, Marketing Digital, Operações, Fraude e Pagamentos, e Serviço ao Cliente) e é desenvolvido com um foco em funcionalidades interativas e em processos simples e eficazes de visualização de dados.
Com o projeto desta dissertação foi possível facilitar os processos diários de encomendas e devoluções junto das lojas e melhorar os resultados operacionais; dotar os gestores das marcas com um relatório de performance interativo capaz de avaliar o desempenho, estabelecer comparações e ajudar na descoberta de tendências de forma flexível; e , através deste relatório com uma abordagem inovadora, distinguir o B&W como detentor de uma das mais pioneiras práticas de relatórios no ramo.
Acknowledgements
I would like to express my deep gratitude to Farfetch, for giving me the opportunity to develop this project in such an amazing company, and to everyone that inspired me along these last months. A big thank you to my supervisor at Farfetch, Beatriz Conejo, for her guidance from day one, and for all the support and intelligent insights. My gratitude to Márcio Dias for the great technical inputs and all the help with the reports. And to each of the new friends I got while embracing this journey, in particular to the ones who are with me since the first day at Farfetch, thank you for all the moments we had working, learning and having fun.
I would also like to thank all my professors at FEUP during the last years, for enriching my knowledge and for making me become a better student and person. To my supervisor at FEUP, Prof. Pedro Amorim, I express my sincere gratitude for all the time, patience and valuable comments throughout this dissertation.
To all the friends who are with me since I remember, a word of thanks for their continuous motivation. To Ângela and Beatriz, I need to particularly thank for all the help and support, not only during this project, but always.
To Maria, I have to express my gratitude for all the love and unconditional support. You have the gift of brightening each one of my days.
And last, but not least, I would like to thank my parents, for everything. For them, words will never be enough.
Contents
1 Introduction ... 1
1.1 Farfetch Black & White integration ... 1
1.1.1 Farfetch ... 1
1.1.2 Farfetch Black & White ... 3
1.1.3 Farfetch Black & White Operations ... 4
1.2 Project motivation and goals ... 5
1.3 Methodology ... 6
1.4 Report structure ... 7
2 Literature review ... 8
2.1 Luxury e-tailing and the need of outsourcing ... 8
2.2 Performance measurement ... 9
2.3 Reporting methods ... 10
2.4 Data visualization ... 12
2.5 Action research in operations management ... 14
3 External reporting paradigm ... 17
3.1 Order fulfilment ... 17
3.1.1 Order processing ... 17
3.1.2 Returns processing ... 18
3.2 Farfecth reports ... 18
3.2.1 Boutiques’ performance report ... 18
3.2.2 Brands’ performance report ... 24
3.2.3 Operational reports ... 27
4 The new reporting model ... 29
4.1 Operational reporting strategy setting ... 29
4.2 Performance reporting model ... 33
4.2.1 Conception ... 33
4.2.2 Metrics and considerations ... 34
4.2.3 Data acquisition and processing... 41
4.2.4 Data visualization, interaction and features ... 42
5 Conclusions and future work ... 49
References ... 51
List of Acronyms
AM Account Management
BI Business Intelligence B&W Farfetch Black & White GTV Gross Transaction Value ID Identification
IS Information Systems
KPI Key Performance Indicator MoM Month over Month
MPO Monthly Performance Overview MTD Month to Date
NPS Net Promoter Score
OM Operations Management
PMSP Previous Month, Same Period PS Partner Services
PWSP Previous Week, Same Period SKU Stock Keeping Unit
SoS Speed of Sending WoW Week over Week WTD Week to Date YoY Year over Year YTD Year to Date
List of Figures
Figure 1- Farfetch Black & White departmental structure ... 3
Figure 2 - Farfetch Operations department structure... 4
Figure 3 - B&W Operations work stream ... 5
Figure 4 - Methodology based on AR ... 6
Figure 5 - Connecting visual cues to data and to the real world. Source: Yau (2013) ... 13
Figure 6 - The cyclic process of action research. Source: Susman and Evered (1978)... 15
Figure 7 - Order processing flow ... 17
Figure 8 - Returns information present on the boutiques' MPO ... 19
Figure 9 - Contested returns information present on the boutiques' MPO ... 20
Figure 10 - SoS information present on the boutiques' MPO ... 21
Figure 11 - No Stock information present on the boutiques' MPO ... 22
Figure 12 - Net Promoter Score form ... 22
Figure 13 - NPS information present on the boutiques' MPO ... 23
Figure 14- Returns information present on the brands' MPO ... 25
Figure 15 - Graph and comparisons present on the SoS analysis of the brands' MPO ... 25
Figure 16 - GTV by gender, season and category combination ... 26
Figure 17 – Bestselling items information present on the brands' MPO ... 26
Figure 18 - Date selector ... 43
Figure 19 – Example of summary table with the main KPIs... 43
Figure 20 - Sliding bar to choose time period and graph example ... 44
Figure 21 - Sales control panel ... 45
Figure 22 - Sales comparison between two different variables ... 46
Figure 23 - Two different possible selections on the metrics' segmentation graph ... 46
List of Tables
Table 1 - Daily snapshot of the order processing steps ... 27
Table 2 - Detail of the more delayed orders ... 28
Table 3 - Detailed SoS information ... 28
Table 4 - Delayed orders detail with stock points information ... 30
Table 5 - Detailed performance metrics by stock point... 31
1 Introduction
Online commerce is one of the hottest themes for luxury brands. With 75% of all luxury sales influenced by digital and with an online market evaluation that could grow up from €14 billion by 2015 to €70 billion by 2025, luxury brands are highly pressed to grasp digital commerce and become omnichannel (Catena and Remy 2015). Nevertheless, it is necessary a great expertise to successfully consolidate the two business channels.
Farfetch is an e-commerce marketplace for luxury fashion, launched in 2008. Considering the gathered know-how of both luxury and technology, it has recently launched Farfetch Black & White: a full-service agency, based on Farfetch’s core systems and services, selling multichannel e-commerce solutions to luxury fashion brands.
However, when the digital world becomes a reality, one of the main concerns that e-commerce managers are facing is related to the ever increasing available amount of data. These worries are augmented, when several metrics are new and managers are subjected to a steep learning curve. The present dissertation, developed at the B&W Operations Team, focuses on developing a new reporting model for the forthcoming brand clients. To guarantee they have access to the crucial information to run their internal operations and to provide them with a set of dashboards containing the most important business and operational metrics along with simple data visualizations.
1.1 Farfetch Black & White integration
The launch of a new business unit like B&W represents a novel era for Farfetch. Notwithstanding all the similarities between the two business units, adaptations were required and even the company structure needed to evolve, in order to incorporate the new agency. Bearing in mind this new paradigm, it is important beforehand to understand what Farfetch is and how it is organised, what are the B&W proposals and its placement within the organisation, as well as how the two sides will interact, mainly when it comes to operations.
1.1.1 Farfetch
Farfetch is an online high-end fashion platform that connects the world’s most famous luxury boutiques with their customers around the globe. Founded in 2008, Farfetch is a London based company that through its distinctive business model and continuous growth have snagged a $1 billion valuation. Currently, Farfetch platform provides access to an assortment of more than 150,000 products from up 400 boutiques, connecting over 1,000 top designer brands and other emerging designers with customers in 190 countries. All in 1 single address, around the clock and 7 days a week.
Such diversity, surpassing all its competitors’ offer, is mostly explained by Farfetch business model. The service Farfetch provides stands out from the other competitors because it is commission based and constructed around a win-win partnership with boutiques. The company does not keep the products it sells in stock. Instead, when the end customer is buying a product
at Farfetch portal, he is purchasing the item from a partner boutique and has it shipped directly to him.
This drop shipping fulfilment strategy, well described by Youderian and Hayes (2013), helps to explain Farfetch fast growth. It was easier to get started, and also less capital was required, owing to the chance of launch an e-commerce platform without investing huge amounts of money in inventory up front. At the same time, overhead expenses are quite low compared to those of brick-and-mortar businesses and, by leveraging the boutiques, the company is able to expand with short incremental work and less growing pains, since most of the work to process an additional order will be carried by the boutiques. The no need to purchase inventory and the broad boutiques’ network allows the company to offer a wider selection of products, because whenever a boutique stock some new item, Farfetch is able to offer it on its own platform at almost no additional cost.
Despite all the listed advantages, Farfetch’s business model also addresses some complexities. When a company is supplying from multiple boutiques, which are also selling through other channels, inventory changes in a constant basis and even with synchronisation technologies, there are always problems to ensure the accurate amount of stock each time an order is placed online. It is also necessary to establish great and solid partnerships with the boutiques, in order to guarantee the boutique is always willing to offer its best items at the portal. In regards to shipping, when the stock is held in multiple stock points, an order can be split and shipped from different points, which makes the operation more complex. In addition, Farfetch is always responsible for potential packing errors or other boutiques mistakes, capable of harming Farfetch’s own reputation.
To succeed with this model, Farfetch had to grow and to become capable of providing the best support and services for both the boutiques and the final customers. The company is currently operating in 10 offices around the world: London, Porto, New York, Guimarães, Los Angeles, São Paulo, Japan, Hong Kong, Shanghai and Moscow. Each office presents differences regarding the structure and departments. Considering Farfetch Portugal – Guimarães, hosting the European Production team and Porto, where this project was conducted - the company is currently divided into eight main departments:
Operations; Merchandising; Account Management; Partner Services; Technology; Finance; Office Operations; Human Resources; Production.
The Operations department, where this project was carried, will be analysed in-depth on Section 1.1.3. Merchandising is responsible for forecasting boutique sales and helps defining the best product assortment for boutiques and brands. Account Management and Partner Service are responsible for all the communication with the boutiques, advising on strategic and planning concerns or on operational issues, respectively. The Technology department deals with all tasks related to back office applications, the website, IT support and other technological improvements. Finance, controlling company’s money, Office Operations, managing all the office needs and Human Resources, dealing with recruitment, are more common departments. Farfetch’s business model does not include production itself, but the Production department is responsible for all the processes an item needs to go through to be available online: product and materials identification, quality control, photography and so on.
1.1.2 Farfetch Black & White
B&W is a fully-fledged full-service agency, selling multichannel e-commerce white-label solutions to luxury fashion brands, based on Farfetch’s core systems and services. It has risen to exploit Farfetch’s know-how and experience, near a growing market of interested brands keen to start their online business. The objective is to make use of Farfetch’s own platform to build another website and deploy it in a modular way whatever infrastructures or services the brands want to use.
As a matter of fact, Farfetch holds some significant advantages when comparing to other luxury fashion e-commerce retailers. The number of customers, boutiques and brands involved is large and continuously growing, which places Farfetch in an increasingly prominent position on the online luxury fashion world. Then, over the past years, Farfetch has accumulated experience and gathered know-how about every important theme regarding e-commerce operations. With this magnitude, Farfetch also benefits from economies of scale and it is very unlikely that a single boutique or brand is able to offer a similar service with the same conditions. And at last, B&W can leverage the Farfetch platform to link inventory from brands’ physical stores to their website and offer services like click-and-collect (which offers the chance for the customers to collect the order from the physical stores) and same-day delivery (taking advantage of brands’ flagship stores in the main cities, to deliver the order on the same day it is placed) to provide a truly omnichannel experience.
However, with B&W business unit, Farfetch has some potential benefits and objectives aside from B&W financial and operational stability. First and foremost, B&W aims to establish connections with either brands from big fashion groups or with emerging and promising designers. This connections will lead to closer ties with important groups and desired brands, which will possibly help to achieve the second objective: bring supply to Farfetch. As a growing company, and not disregarding the enormous stock Farfetch has available nowadays, the main problem the company faces is supply. Therefore, with this B&W approach and developing websites for brands, Farfetch aims to reach agreements to have the stock available on the two sides: both the brands’ and Farfetch’s website. With this purpose, Farfetch will secure not only more stock and variety, but also agreements with brands who are not yet on the platform but are object of customers’ desire, giving in return global exposure and huge amounts of traffic. Regardless of its still short lifetime, B&W has become one of Farfetch’s strategic pillars. The business unit has launched one e-commerce brand site in January, another in March and two in June. Another one is coming in August and there are more brands on the pipeline for the upcoming months.
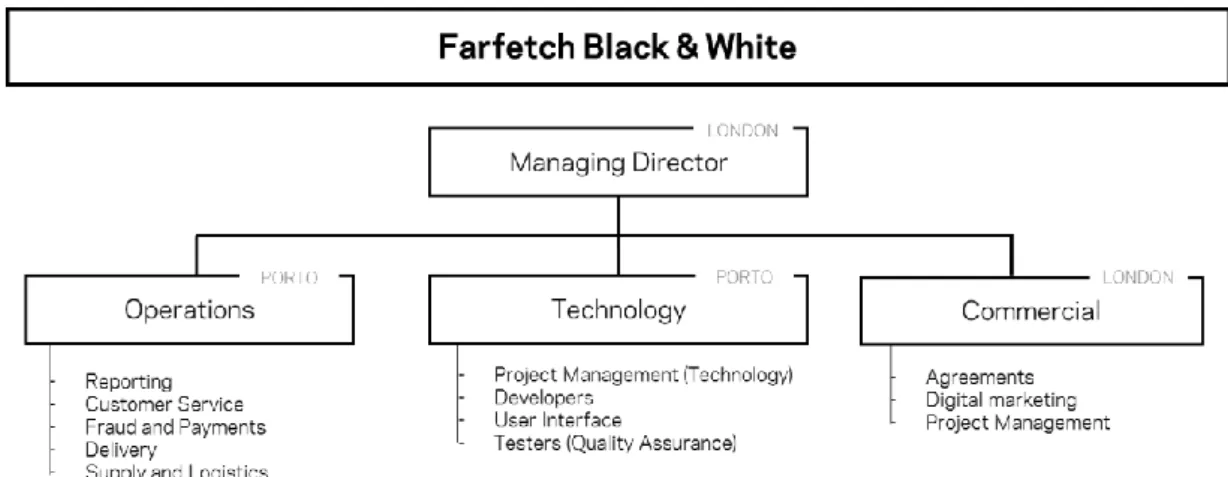
Regarding the business unit organisation, the B&W departmental structure and main roles are represented on Figure 1.
As a recent business unit, the roles are not yet fully defined. However, as B&W takes advantage of Farfetch resources, the departments conceived represent the dedicated teams created to support the project. All the other resources not displayed on Figure 1, and even some of the operational tasks shown, are now shared between B&W and Farfetch.
Regarding the B&W Operations department, where this project was held, a detailed explanation and its interaction with Farfetch Operations department is available on Chapter 1.1.3. The B&W Technology department is responsible for the websites development and user interface, as well as the development of tools like the Content Management System and other client-oriented tools. On the other hand, more general technology such as, per example, the order processing software, is the same used for Farfetch’s boutiques and, therefore, Farfetch’s resources are used to implement any required improvements. The B&W Commercial team is based in London and does all the commercial work with the brands. Digital marketing is also under their responsibility and the Project Manager works alongside the team as well. All the departments are supervised by the Managing Director, who is also based in London, close to Farfetch’s executive team.
1.1.3 Farfetch Black & White Operations
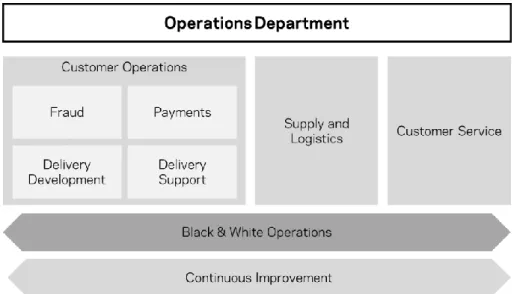
B&W Operations is an integral team of Farfetch Operations department, in Porto. Operations covers a range of important tasks in a day-to-day e-commerce activity. This department is subdivided in many different teams and its organization is expressed on Figure 2.
Figure 2 - Farfetch Operations department structure
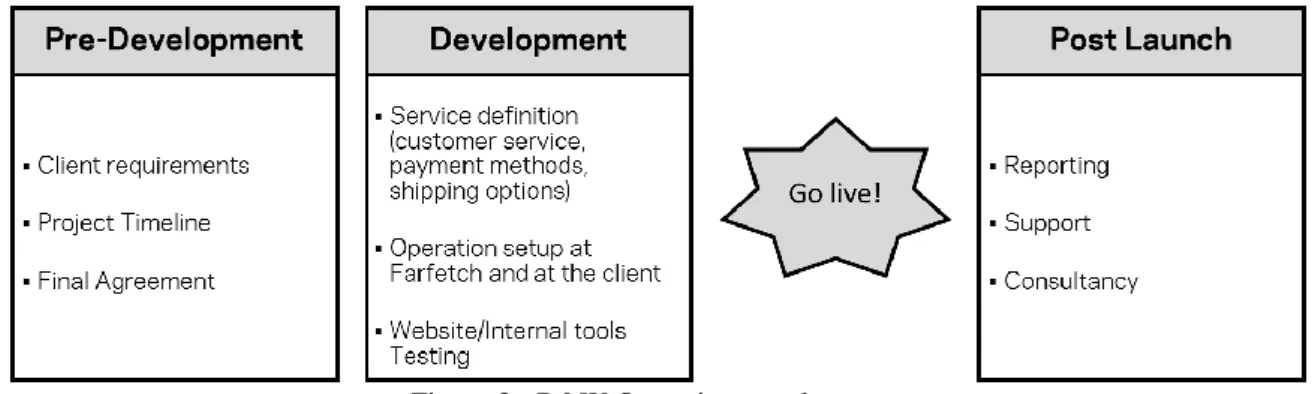
Customer Operations, as the name suggests, deals with activities that directly impact the customer, such as fraud check, payments control and methods, delivery support in operational queries and delivery development to find cheaper and better shipping solutions. However, Customer Service, which is also directly related to the customer, represents an independent team. This is justified by the significant size of the team and by the importance given to customer support in an online business. Hence, Supply and Logistics controls the boutiques’ performance to ensure service levels and helps with the set-up of the boutiques dedicated e-commerce rooms. Continuous Improvement is, as B&W Operations, a transversal team. It is accountable to improve the organization’s services and processes using a Kaizen approach. B&W Operations is also a transversal team that exploits the other teams in favour of the B&W project. The team’s usual work stream can be divided into three main phases, as shown on Figure 3.
Figure 3 - B&W Operations work stream
This work stream is a simplified representation of B&W Operations’ independent activities. While the agreement with the brand is being discussed, it is necessary to understand the client requirements to estimate if some developments are needed on the platform and the necessary time to implement and prepare those client demands. While the B&W Technology team is developing the site, the B&W Operations team need to, together with the brands, precisely define the service that the brand aims to provide. Among others, it is required to define customer service hours and languages, which payment methods will be available, what are the shipping destinations and prices, which delivery methods will be offered, define the packaging, and so on. It is also essential to test the website and the internal tools, as well as to help the brand with all the operation set-up. After the launch of the e-commerce, full support is given and best practices are shared with the brand in order to improve performance. At the same time, and remembering the main purpose of this project, reports are defined, discussed and prepared during development, to be shared with the client after launch.
The customer support is done by an independent B&W team inserted on the global Customer Service team. The remaining activities, triggered by an order placement, are assured by Farfetch global teams. The fraud check is done by the Fraud team, payments and refunds are controlled by the Payments team, and so forth.
The Operations department is a good example, though complex, of the shared synergies between Farfetch and B&W. The objective is to share the maximum resources, in order to take advantage of what is already being properly done and start, improve or adapt everything else. In fact, improving one business will also push the other further.
1.2 Project motivation and goals
From the outset, one of the main stakeholders of any project are the clients. They get even more relevant when considering that B&W is a service provider, in this case, to luxury fashion brands. At the same time, information and data are becoming more important, or even crucial, to any e-commerce operations. So, a full reporting strategy needs to be defined and put in place, in order to endow the clients with both operational information and analysis about their own performance.
As mentioned before, the project is inserted on a new business unit. Taking that into account, it is easy to understand that all the reports must be created from scratch. However, given the similarities between Farfetch and B&W, the reports sent from the parent-company to its partners (both boutiques and brands) could be used as a preview of some of the clients’ requirements. Because many clients are having their first contact with e-commerce, this expertise accumulated by Farfetch and its more mature processes, can be used to counteract any possible lack of experience from both B&W and the brands.
Given this setting, two main goals were defined: 1. Structure all the operational reporting strategy; 2. Develop a full-fledged performance reporting model.
The first goal is important to fill the gaps not covered by the information systems provided to the clients. In a similar way to Farfetch’s procedure with the boutiques, B&W provides the brand tailored software (or integrations within brands’ own software) to cover order processing and other operational issues. However, to maintain the stores’ performance, it is necessary to highlight some evidence on a daily basis and to provide the brands with some additional information not available on the referred software. It is important to understand the brands’ main operational pain points, to define what reports need to be constructed as well as the periodicity of each one.
The second objective is to construct a complete performance report. It is very important to a brand with its own e-commerce to have access to data, even more when it is being helped by another company to run its business. Given that, it is required to listen to the brands main demands, to be able to identify the metrics that are important to measure in this business and accordingly to the brands strategy. It is also very important to evaluate what is the best presentation method for each chosen KPI. The final result must be a report with all the metrics identified as important, ready to be utilized by the brands, in order to update and inform them with how the business is running.
Assembling all the pieces, this project aims to reach not only a reporting system entirely customised to each brand, but also a full reporting strategy, prepared to address the most common and expected requirements from the clients.
1.3 Methodology
Considering the nature of B&W business model and the main goals of the project, it is fundamental to involve the clients on the research. Either to define a reporting strategy, or deciding the most important performance metrics to measure.
Bearing that in mind, it was decided to use an Action Research (AR) approach As the name suggests, AR is an approach to research that aims at both taking action and creating knowledge about that action. However, it must not be confounded with consultancy, since it is more rigorous in the inquiry and documentation, it requires theoretical justifications and unlike consultation, that is frequently linear (engage, analyse, act and disengage), AR is cyclical (Coughlan and Coghlan 2002).
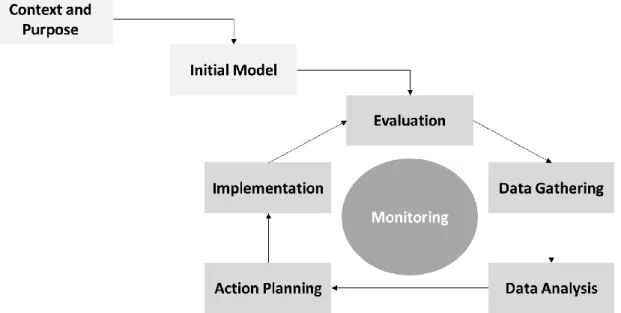
The methodology steps are shown on Figure 4. It is an adaption of both the implementations of AR that Coughlan and Coghlan (2002) suggest and the AR cycle proposed by Susman and Evered (1978).
There are two initial pre-steps. Context and Purpose consist on defining both the rationale for action and for research. After that, Farfetch reporting examples are consulted, Farfetch managers’ feedback is gathered and other established processes are analysed in order to construct an initial reporting model.
After those initial steps, the clients are involved and take part of all the process until a satisfactory result be attained. All the feedback is obtained thanks to the e-commerce managers of the first three B&W clients, which are the ones who experience the reports directly. The researcher must deal with each manager independently, but always aims to reach a unique and stronger model.
Evaluation involves reflecting on the outcomes of the action (of the initial model, in the first iteration) and is a key to success. Data is obtained through observations, discussions and interviewing. Every opinion or suggestion given on meetings, on a simple conversation or by e-mail must be considered. After all the data (of each of the three clients) being gathered, the full data and opinions are anonymously shared to each of the brands’ agent and are analysed. Following the analysis, further action is planned and the main implementation points are identified. After the implementation of all the identified improvements, a new iteration starts and all the process is repeated until the model reaches a stable and complete version.
Monitoring occurs through all the cycles. The researcher must monitor all the project in order to satisfy the clients’ requirements but, at the same time, he should never forget the research stream and the finding of a theoretical reason for each of the required actions.
1.4 Report structure
The remainder content of this dissertation is structured in four different chapters.
Chapter 2 presents a literature review on the main themes addressed along the project. The first review is about luxury fashion, its relation to e-commerce and e-tailing, and why the luxury fashion brands feel the need to outsource e-tailing. Performance measurement, reporting methods and data visualization are also covered areas. Finally, the action research methodology and its adoption in OM is explained.
In Chapter 3 an overview on the reports that Farfetch is currently sending to its brands and boutiques is performed. Both the more operational and the monthly performance reports are analysed and scrutinized.
After reviewing Farfetch’s practises and inputs, the interested parts are continuously consulted to help defining the operational reporting strategy and to opine about what are the indicated measures and aspects to consider on the performance report. All this framework of thought is explained in Chapter 4, as well as all the models and definitions that have been reached are presented.
Chapter 5 concludes this dissertation, reviewing the proposed reporting strategy and model, and presenting ideas for future development.
2 Literature review
This chapter aims to provide a literature review of the key topics that are relevant to this project. Firstly, the e-tailing business in the luxury fashion world is addressed, as well as the reasons why many companies are selecting to outsource to enter online retail. After, performance measurement is reviewed. Some reporting methods are then analysed and the best practises within data visualization are scrutinized. Finally, a review of the action research methodology in OM is presented.
2.1 Luxury e-tailing and the need of outsourcing
Luxury is not a product, but an identity, a philosophy and a culture (Okonkwo 2007). Luxury products are an expression of the indirect social stratification (Okonkwo 2009) and are consumed for their psychological values instead of their practical utility (Doss and Robinson 2013). Luxury is a term usually connected with wealth, power, premium quality and exclusivity (Brun et al. 2008). Factors such as craftsmanship, sustainability, brand reputation and emotional connection are powering the experience of luxury over simple ownership as a growing trend (Abtan et al. 2014).
Technology has changed the landscape of consumer behaviour and the way business is conducted, including luxury fashion management (Okonkwo 2007). For sellers, e-commerce creates new paths to reach global customers. Customers, on the other hand, gain a wider product range and more control over information (Johnston, Clark, and Shulver 2012; Goad et al. 2015). Nevertheless, e-commerce and luxury fashion retail are not full complementary. The fear of diluting the brand image through more product accessibility, the challenges in reproducing online the high-impact experience of luxury retail and the inability to reproduce the sensory attributes of luxury goods, are some of the reasons why luxury brands remained reticent in join e-tail (Okonkwo 2009). However, the existence of an online luxury consumer population is no longer in question and it is growing rapidly and steadily. It happens because convenience and accessibility, aside from being prominent benefits of e-tail, are now ranked high among the luxury customers’ expectations (Okonkwo 2007). Today’s luxury customers are also more knowledgeable about brands, more sophisticated and more demanding (Abtan et al. 2014). For the last reasons and after the economic downturn on the late 00’s, luxury brands were forced to expand online because while physical stores were decreasing sales, e-commerce was rising at double digits (Okonkwo 2009).
Developing a stable multichannel fulfilment operation requires large capital investments at the beginning and over time, even more when the life cycles of information technology systems are still being compressed with rapid technological changes (Pentina and Hasty 2009). Through e-commerce outsourcing, the fashion companies gain access to superior expertise, business risk mitigation, strategic flexibility and asset transfer while are able to leverage costs and increase the project success rate probability (Pentina and Hasty 2009; Sun, Li, and Zhao 2015).
When addressing e-commerce through outsourcing, the company is able to follow many strategies, including the outsourcing of all the e-commerce related activities or just part of them
(Okonkwo 2007; Sun, Li, and Zhao 2015). Using different providers for different activities is not recommended by Pentina and Hasty (2009), because it will increase costs and complicate the process of multichannel coordination and integration. Given the highly dynamic and turbulent environment of e-tailing, strategic outsourcing is pointed as the more beneficial approach, at least for the initial stages of multichannel retailing (Pentina and Hasty 2009). Despite the small number of companies, the luxury industry is quite relevant in sales and influence (Ko and Megehee 2012),which also makes this sector compelling for e-tailing service providers.
2.2 Performance measurement
Performance measurement is a fundamental principle of management, which is important to identify gaps between the current and the desired performance (Weber and Thomas 2005). Although it is a topic which is often discussed but rarely defined, it is described as the process of quantifying action (Neely, Gregory, and Platts 1995). Measurement helps to identify areas of strengthen and weaknesses and provides the basis for an organisation to assess how well it is progressing towards its objectives. (Amaratunga and Baldry 2002).
Traditionally, performance measurement was based on accounting information and financial measures and ratios. When the world market changed in the late 1980s, companies shifted their strategic priorities and implemented new technologies and philosophies. These changes revealed the many limitations of the traditional performance metrics and the urge in developing new measures (Ghalayini and Noble 1996). With this shift, financial figures, which were treated before as the foundation for performance measurement, became just one among a broader set of measures (Eccles 1991). The main turning point, however, was when Kaplan and Norton (1992), through the concept of the Balanced Scorecard, suggested the use of both financial and non-financial measures (learning and growth, processes and customers). Nowadays, performance measurement practices are commonplace in all sectors of industry and commerce (Bititci et al. 2012).
Key Performance Indicators (KPIs) are quantifiable metrics which reflect the performance of an organisation in achieving its goals and objectives. They measure the business health of the enterprise and ensure that all individuals are “marching in step” to the same goals and strategies (Bauer 2004). The building of the most appropriate set of KPIs should focus on the end result, bearing in mind what the company wants as outcomes of the work processes (McNeeney 2005). The success of any performance management program is related to the selection of the correct KPIs. Although all KPIs are metrics, not all metrics are KPIs, and selecting the wrong KPIs could result in sub optimised results (Bauer 2004).
Selecting the right measures is vital for effectiveness (McNeeney 2005). The new era performance measurement metrics should be simple, easy to use, and actionable, with a proactive approach enabling fast feedback and continuous improvement (Gunasekaran and Kobu 2007). In addition, they should capture the essence of the organizational culture, being based on the company strategy and goals, and relate to strategic tactical and operations level of decision making (Gunasekaran, Patel, and McGaughey 2004). The metrics must be built into a performance measurement system that allows individuals and groups to understand how their behaviours and activities are fulfilling the corporate goals (McNeeney 2005). They should also allow for reviewing, revising and refining, contributing for organizational learning (Wouters 2009).
When implementing new metrics, the systems and procedures must be put in place to collect and process the data that enable measurements to be made regularly. This may involve computer programming to trap data already being used and present it in a more meaningful form. If needed, some new procedures must be initialised to capture the information not being recorded (Bourne et al. 2000). It is also critical to ensure that the metrics are evaluated and
updated constantly, in order to guarantee that organizations are ready to respond faster to new opportunities or threats of the market (Cai et al. 2009).
The implementation of a performance measurement system can be subdivided in three main phases. The design of performance measures, where the key objectives are identified and the measures designed; the implementation of measures, which includes an initial collection, collation, sorting, analyse and distribution; the use of performance measures to both access the implementation strategy (measure, review, act) and challenge strategic assumptions (reflect) (Bourne et al. 2000).
A key principle of performance management is to measure what you can manage, or in other words, each function on the organisation must focus on the amount of indicators that they influence in order to maintain and improve performance (Weber and Thomas 2005). However, many organisations that have information systems have data overload, because most of them generate redundant performance reports (Neely 1999). There is a certain level of information that results in the most accurate decisions. More or less information decreases the decision accuracy and could lead to less consistent decisions (Chewning and Harrell 1990). Another problem regarding the performance measures in many organisations is that they are usually unaligned with the business process and are rarely integrated with one another (Neely 1999). Automation of KPIs provides reliability and abate the time elapsed collecting data, offering more time for applying the metrics and achieving benefits from them. However, it is a challenge to understand how to collect the data needed with a systematic and routine based approach (McNeeney 2005). Most of all, when designed and implemented warily, KPIs allow to know precisely where to take action to improve performance (Weber and Thomas 2005).
2.3 Reporting methods
Communicating is imperative across every company (Ying, Lijun, and Wei 2009). KPIs provide a mean of aligning the entire organisation with the company’s key strategies, but they also require careful communication and education (OSIsoft Inc 2007). The effectiveness of the KPIs is not only represented by the way they are defined, but also by the way they are presented to all stakeholders involved (Ying, Lijun, and Wei 2009). Effective reporting processes should ensure that all stakeholders receive appropriate reports in a timely fashion (Parmenter 2010; International Federation of Accountants (IFAC) 2013). That is because high-quality information promote better internal decision making and is one of the major drivers of sustainable organizational success (International Federation of Accountants (IFAC) 2013). Depending on the audience, on the type of information to be presented and on the regularity needed, several methods of reporting can be adopted. It has emerged the need for a tool able to integrate the diverse systems of a company into a coherent picture of where the organisation is heading and what needs to be done to improve its progress (Pauwels et al. 2009). There are many reporting tools, however three of them have earned greater emphasis on the literature: scorecards, reports and dashboards.
A performance scorecard is a tabular visualization of measures and their respective targets with visual indicators to see how each measure is performing against their targets at a glance. It is an essential component of the Kaplan and Norton (1992) balanced scorecard methodology. However, they are also used independently, to monitor the progress of any organizational goal and identify at a glance what is more important (Chang and Morgan 2000).
Reports are usually described as text and table based documents, which periodically include visual components. Normally static and arranged via pagination, reports continue to be a standard reporting method when it comes to displaying raw level data or pixel perfect data views designed for printing or for exporting to digital document format (Zenko 2016; Chiang
2011). For these reasons, reports are scheduled for automatic distribution and tend to be used on a more regular basis (Zenko 2016).
Dashboards became a reporting method increasingly used by companies to communicate and display important measures. They are expected to improve decision making, through the amplification of cognition and the capitalisation of human perceptual capabilities (Yigitbasioglu and Velcu 2012). According to Few (2006), “a dashboard is a mean of presenting information to decision-makers, with a focus on visual communication, so that important information is consolidated and arranged on a screen in order to be easily monitored”. Eckerson (2011), in turn, describes a performance dashboard as a performance management system that translates the organisation’s strategy into metrics and objectives, providing timely information and insights that enable the business users to improve decisions, optimise processes and plans, and work proactively. It is expected to collect, summarize and present information from multiple sources in order to elucidate the user about how the various KPIs are performing (Yigitbasioglu and Velcu 2012).
The information presented on a dashboard must agree with its purposes. The number of perspectives in a performance measurement system should depend on strategies, competitive threats and economic conditions facing the organisation (DeBusk, Brown, and Killough 2003). However, by reducing complexity, decisions can be made quickly (Ying, Lijun, and Wei 2009). So, unnecessary information should be eliminated, in order to avoid cognition impairment, disregard of information and poorest decision accuracy (Yigitbasioglu and Velcu 2012; Velcu-Laitinen and Yigitbasioglu 2012).
When designing a dashboard, both functional and visual features are utterly important and must be considered and planned. The visual features are related to data visualization and to how effectively information is presented (and will be addressed separately in Chapter 2.4), while the functional features are linked to dashboard functionalities like drill down capabilities or automated alerts (Yigitbasioglu and Velcu 2012).
Traditionally, business intelligence tools have been focused on reports with little interactivity and visuals. However, with the modern data discovery applications, new tools have risen and allowed exceptional interactive visualizations (Zenko 2016). The increasing scale and availability of digital data provides an extraordinary resource for business operations, and to get the most out of such data, users must be able to make sense of it: to pursue questions, uncover patterns of interest and identify errors. To do so, it is necessary to introduce some interactive dynamics to allow users to filter out data to focus on relevant items, to sort items to expose patterns or to select items to highlight or manipulate them, among many other features (Heer and Shneiderman 2012).
Nevertheless, when this interactivity level is attained many authors consider that the tool at issue is no more a dashboard because it loses the “at-a-glance decision making” and the short and concise characteristics defined by Few (2006). Since it is not primarily text and table based, it does not fit into the report definition either. This hybrid approach is not much described in the literature yet, but it is usually identified as a visual analysis tool (Heer and Shneiderman 2012; Chiang 2011). The definition of each method is always generalized, since every dashboard does not need to be concise and with interactive limitations, and every report does not need to be static and fully detailed (Zenko 2016).
Most of all, the reporting methods utilized should be simple and effective in order to allow managers to assess performance and to enhance decision making based on the metrics displayed (Wind 2005). Selecting the right quantity of information - always aligned with the company purposes - and finding an optimal point is necessary to make accurate decisions. It might be difficult to achieve the right fit, however a good strategy is to implement more flexible solutions that allow for easy upgrades (Yigitbasioglu and Velcu 2012). A properly created reporting
method will provide means to drive effective management and resource allocation decisions (Wind 2005).
2.4 Data visualization
Visualization, as the name suggests, is based on exploiting the human visual system as a means of communication (Munzner 2014). People visualize data either to consume or produce information relevant to a domain-specific problem or interest. Visualization design involves a mapping between domain problems or interests and appropriate visual encoding and interaction design choices (Brehmer 2016). It allows people to analyse data even when they do not know exactly what questions they need to ask in advance (Munzner 2014).
When constructing new visualizations, all the processes from obtaining the data until the final product are essential. Given a set of data, it is difficult to know how to extract meaningful information from it, and to most, this process is opaque. However, Fry (2004) proposes a seven step process prepared to deal with these problems, from the simple to the most complicated ones:
1. Acquire: obtaining the data;
2. Parse: providing structure, ordering into categories; 3. Filter: removing all but the data of interest;
4. Mine: applying statistics and data mining; 5. Represent: determining a simple representation; 6. Refine: improving the basic representation;
7. Interact: adding methods for manipulate the data and control other features.
The described seven stages of visualizing data are related along the path. Therefore, despite the steps may be headed by different people, it is important to guarantee a mutual alignment to run all the process effectively (Fry 2008). It is important to remember that information visualization is an iterative process (Börner and Polley 2014).
Data visualization is only recently becoming properly appreciated for the benefits it brings to business. First providing the means to make sense of data, to then communicate the discovered information to others (Few 2007). In line with the improvements of technology, the volume of data and its availability has increased, which in turn gave people something new to visualize (Yau 2013). Since the appearance of the computer first, and visual analysis software later, that the user is able to not only represent data graphically, but also to interact with those visual representations according to his/her own pretentions, generating analytical insights not approachable by traditional manners (Few 2007).
There are five major visualization types (Börner and Polley 2014):
Chart: a visualization that have no inherent reference system (e.g., pie charts);
Tables: a simple but effective way to convey data, can contain graphic symbols or color coded cells to help in the interpretation;
Graphs: the most common visualization, can display qualitative or quantitative data (e.g., timelines, bar graphs, scatter plots);
Geospatial maps: use a latitude and longitude reference system (e.g., world maps); Network graphs: trees or network graphs (e.g, hierarchies, migration flows).
There are many types of visual displays and many different graphs. Nevertheless, after years of experience and analysing the most used displays, Knaflic (2015) highlights a dozen different types of visualization. Simple text is utilized when there are just one number or two to share, making it as prominent as possible combined with a few supporting words in order to make the point. Tables are great to read across rows or down columns, or to compare values. An interesting approach to mix the detailed information of a table with visual cues is via a heat map
(in addition to the numbers, coloured cells convey the relative magnitude of the numbers). The more used graphs usually fall into four areas: points, lines, bars and area. While tables interact with the verbal system, graphs interact with the visual system, which is faster processing information. Scatterplots are useful for showing the relationship between two things. Line graphs are most commonly used to plot continuous data of single or multiple series. Bar charts, in turn, are usually easy for the eyes to read when designed correctly. Sometimes they are avoided for being common, but instead, they should be leveraged because they are common and that means less learning curve. The bar chart must always have a zero baseline to avoid false visual comparisons (correct length) and generally the bars must be wider than the white space between them. There are also many types of bar charts. The vertical bar chart, or column bar chart, like the line graphs, can represent single or multiple series. The stacked vertical bar charts allow to compare totals across categories. The waterfall chart can be used to show a starting point, increases and decreases, and the resulting end point. The horizontal bar chart and stacked horizontal bar chart are similar to the vertical relatives but better for categorical data. Finalizing, the area graphs. Are indicated to visualize numbers of vastly different magnitudes, and the second dimension (using a square) allows to do it in a more compact way than possible with a single dimension. The use of 3-D graphs and the use of pie charts, are also discouraged because they are hard for people to read when segments are close in size and, as a result, decision making is biased (Yigitbasioglu and Velcu 2012; Knaflic 2015).
Visualization is composed by four main ingredients, with data as a driving force behind them: context, scale, coordinate system and visual cues. Context main objective is explain how people should read a visualization. When the audience is unfamiliar with the data, the values must be clear and somehow explained. Scale is also important and the increments utilized should make sense and increase readability. Yau (2013) identified six main types of scales: Linear (where values are even spaced), Logarithmic (with focus on percent change), Categorical (a discrete placement of bins), Ordinal (when categories’ order matters), Percent (representing parts of a whole) and Time (units of years, month, days, or hours). Still, when encoding data, the objects need to be placed somewhere and are the coordinate systems who dictate that. There are three main coordinate systems used in data visualization: Cartesian (the x- and y-coordinate system generally known), Polar (when coordinates are placed based on radius and angle, e.g. pie charts) and Geographic (latitude and longitude locations in the world) (Yau 2013). To finish, visual cues. It is important to understand that visualization, in its most basic form, is simply mapping data to geometry and colour.
Figure 5 - Connecting visual cues to data and to the real world. Source: Yau (2013)
The connection between visual cues and data is key, because data is what connects a graphic to the real world (Figure 5). If readers are not able to decode visual cues, they are not able to interpret anything. On the other hand, the visualization process is about encoding values to shapes, sizes and colours (Yau 2013). Depending on the purpose, there are nine main elements to be adapted: Position (where the data is in the space), Length (how long the shapes are), Angle (rotation between vectors), Direction (slope of a vector in space), Shapes (symbols as categories), Area (how much 2-D space), Volume (how much 3-D space), Colour saturation (intensity of a colour hue) and colour hue (the usual colour definition) (Yau 2013).
When identifying which elements are the information we want to communicate (signal) and which might be noise, the Gestalt Principles of Visual Perception must be considered (Yigitbasioglu and Velcu 2012; Knaflic 2015). The Gestalt principles aim to identify how individuals perceive order around them, and many are used to create order out of visual stimuli (Knaflic 2015). Among all the principles, when thinking about visual information and dashboards, some deserve to be considered: proximity, similarity, continuity, enclosure, closure symmetry and connection.
Every single element added to a page or screen takes up cognitive load, or in other words, takes brain power to be processed. There are visual elements that take up space but do not increase understanding - Knaflic (2015) refers to this as clutter. In the same way clutter is an enemy, pre attentive attributes like size, colour and position can be used to highlight important elements and to strategically help direct the audience’s attention. Size matters. Relative size shows relative importance and bigger sizes should be used to emphasize something important. Position on page should also be considered and the most important things should be placed on top, since the majority of people will start on the top left of the page (Knaflic 2015). Considering colour, it can improve the process of visualization and is a powerful tool to discriminate particular objects. Colour must be used sparingly and consistently, and must be chosen having the colour-blind in mind (Knaflic 2015).
Programs are designed to be fast and work outside the context of data. Although, it is up to the analyst to make the right decisions along the way and to make the computer’s output something for humans, knowing beforehand that most of this knowledge will come from practice and experience (Yau 2013; Munzner 2014).
There is always a story in data (Knaflic 2015), and when allowing comparisons, considering its context and what it represents, structuring shapes and colours for clarity, and highlighting the proper elements, readability is more easily achieved (Yau 2013). This data visualization area offers potential for more research, since a lot of articles and books have arised in the recent years. Nevertheless, when applying these basic tools and insights, one must be able to create visualizations that are thoughtfully designed, driving to better decision making and inciting the audience to act (Knaflic 2015).
2.5 Action research in operations management
There are many empirical research methods and considerable experiences on the social sciences using them. Operations Management (OM) has some of the characteristics of a social science, involving people and groups in organizations, what helps to validate this approach (Westbrook 1995). Flynn et al. (1990) provided a systematic approach to encourage operations management researchers to use empirical research, because the development of the field of OM would be enhanced by this type of research. They used the term “empirical” to describe field-based research which uses data gathered from naturally occurring situations based on real word observations and experiments. Their systematic approach consists of six main steps:
Establish the theoretical foundation; Select a research design;
Select a data collection method; Implementation;
Data analysis; Publication
They described a number of empirical collection methods (such as archive analysis, interviews, questionnaires, content analysis, participant observation, outside observation) which could be used, alone or in combination, with the chosen research design. Many empirical research design
methods has already been identified, such as case studies, panel studies, focus group, surveys and action research (Flynn et al. 1990; Westbrook 1995).
Action Research (AR) represents a juxtaposition of action and research, of practice and theory, because it is committed to shape new knowledge through the seeking of solutions or improvements of real world problems (Mckay and Marshall 2001). While the aim of positivist science is the creation of universal knowledge, AR focuses on knowledge in action (Coughlan and Coghlan 2002). Susman and Evered (1978) demonstrated how AR can be used as a method for correct the deficiencies of positivist science, generating knowledge while solving problems that organisations members’ face.
It is an established research method in use in the social and medical sciences since the mid-twentieth century. However, since the 1990s that many papers address the use of this research method in OM (Westbrook 1995; Coughlan and Coghlan 2002) and in the Information Systems (IS) research arena (Baskerville 1999). Westbrook (1995) concludes that are surely roles for all research paradigms in OM, however, if it is needed to include practitioners, then the stream of empirical research, and of action research in particular, must be recognized as the main possibility. Baskerville (1999), in turn, consummates that the method produces highly relevant research results, because of its aim at solve an immediate problem situation while carefully informing theory, responding directly to the pronounced needs for relevance in IS research. AR is even recognized by many as the ideal post-positivist social scientific research method for IS research (Baskerville and Wood-Harper 1996).
Coughlan and Coghlan (2002) gathered several broad characteristics that define AR. First, AR focuses on research in action, rather than research about action. Second, AR is participative and members of the system which is being studied must engage actively in the process. Third, AR is research concurrent with action. Finally, AR is a sequence of events and an approach to problem solving. A sequence of events because it works through a cyclical process of planning, taking action and evaluating the action, leading to further planning and so on. A problem solving approach, because through the solutions to the immediate problems, it is expected to learn from the outcomes and improve scientific knowledge.
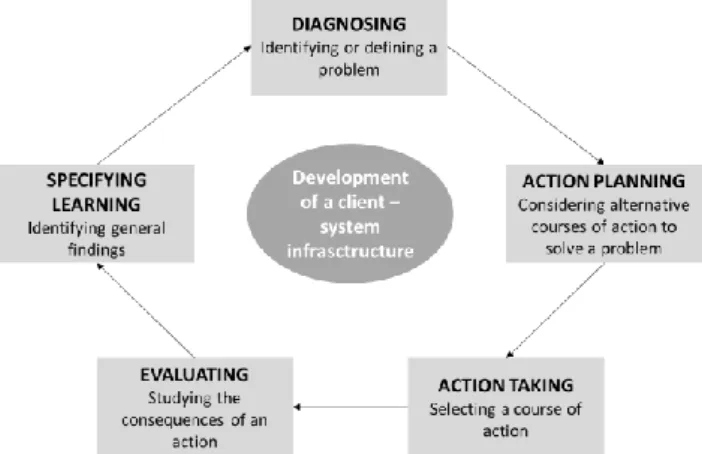
The usual representation of the AR process is using a single cycle, with possible iterations. The most simple and typical representation is the one developed by Kemmis and McTaggart (2005), where each iteration of the cycle is composed by four steps: plan, action, observe and reflect, that leads to a further revised plan, action and so on. Susman and Evered (1978), in turn, idealise AR as a cyclical process with five steps, all of them necessary for a comprehensive definition of AR (Figure 6). Both the infrastructure and the action researcher, maintain and regulate all of the five steps jointly.
Notwithstanding most authors describe AR as a single cycle, Mckay and Marshall (2001) point that the process must be viewed as a dual parallel cycle, one representing the research interest and another representing the problem solving interest.
An even more interesting approach is the one develop by Coughlan and Coghlan (2002) related to the implementation of action research. The main innovation regarding their approach is related to the presence of a pre-step, before the cycle, and a monitoring meta-step. The pre-step is driven by the need to understand the context and the purpose of the project. Monitoring, in turn, is a meta-step that occurs through all the cycles. The researcher must not only be concerned with how the project is working, but also monitoring the learning process.
AR involves core skills at engaging with others in process of inquiry and action. There are three different typologies of inquiring. Pure inquiry is where the action researcher listens carefully and neutrally while prompts the elicitation of what is taking place. Exploratory diagnostic inquiry is where the action researcher begins to manage the process of how the content is analysed by the other. Confrontive inquiry is where the action researcher challenges others to think from a new perspective, by sharing his/her own ideas (Coughlan and Coghlan 2002). There are no prescriptions when conducting AR. However, Westbrook (1995) outlines some practical rules of thumb obtained through experience. The researcher must prefer data to opinion, despite he must remember that opinions are also data. The problematic areas or issues must be agreed with the collaborating companies, but any solution would be pre specified. The researcher must always seek for multiple viewpoints and record everything in simple semi-standard formats in order to compare different situations without compromising lines of investigation not previously foreseen. The researcher must always construct some write-ups with all the gathered data and have the other participants to check them.
Although the potential relevance of action research, and general empirical research, is motivating, it is necessary to guarantee its methodological fit, which refers to the consistency among the elements of a research project – research question, prior work, research design and theoretical contribution. Creating fit is an iterative process that involves feedback and modification at many stages, what makes field research (and so, empirical research) an iterative and cyclic learning journey (Edmondson and McManus 2007).
All the areas approached are important to the proposition of this project. The luxury e-tailing is the business area where this project is being held and outsourcing is directly related to how B&W approaches the brands. Get to know the foundations of both areas is vital to develop an adapted and accurate basis for reporting. To strengthen the reporting, however, it is necessary to understand how to measure performance, which are the indicated reporting methods and analyse the key points to develop effective data visualizations. With the review of these themes, it is possible to enrich the reports with some of the best practises. The AR methodology is also important to understand how a research of this kind should be addressed.
A new application of AR in the OM of a fashion business is conducted. However, the main contribution of this dissertation is the performance reporting model developed, particularly when performance needs to be measured in the luxury fashion business. Performance measurement, reporting methods and data visualization areas are a considerable field of knowledge, and with this project it is possible to review that knowledge by applying those concepts to the development of the reporting model, highlighting some areas less studied.
3 External reporting paradigm
Although B&W represents a new service, Farfetch is already using some report models with its partner brands and boutiques. It is an advantage that B&W can use in its favour, because the most common operational concerns are previously identified and even some solutions and alternatives are designed since then. From another perspective, it is important as well to analyse what metrics are being used to show the partners their performance across the various areas, as well as the periodicity in which the reports are sent.
Before analysing the reports used at Farfetch, a brief explanation about the order fulfilment process is given in Chapter 3.1. With this explanation, it becomes easier to understand Farfetch (and B&W) operational flow and the main concerns and lack of information to which the boutiques usually are exposed.
3.1 Order fulfilment
Before having a look at those reports, it is important to understand how relevant the order processing is and what steps are behind it. The returns process will also be analysed, because it also adds a great value to the customer experience.
3.1.1 Order processing
Once the customer places an order, a portal order is generated with the customer’s purchase information. This portal order is then split into many boutique orders, according to the boutiques where the items were purchased. Farfetch has developed an application - STORM - that boutiques use for order processing. Each time a boutique order is generated, it is displayed on the STORM account of the boutique in hand. At STORM it is possible to inspect what orders need to be processed and at what step of the processing they are.
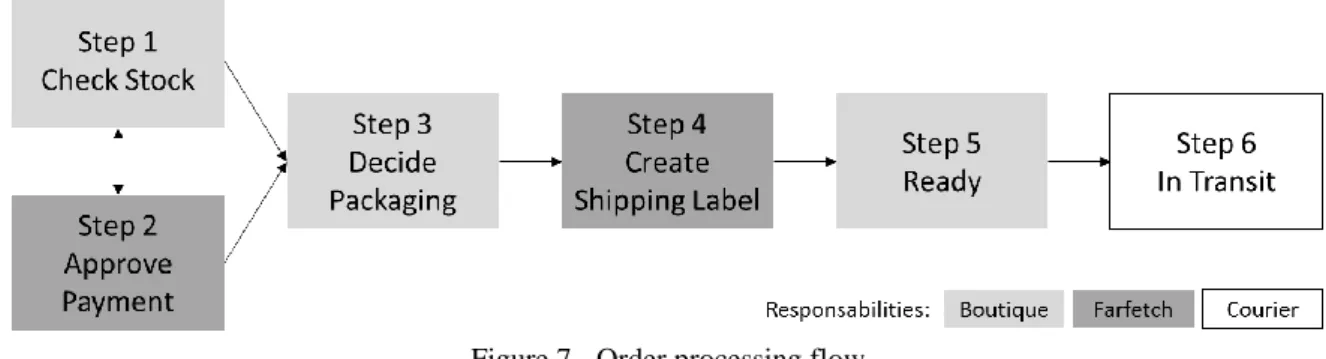
The order processing can be divided into six steps, as demonstrated in Figure 7.
Figure 7 - Order processing flow
Step 1 – Check Stock
From the moment the order is placed until the boutique confirms the stock existence, the order remains in step 1. If the ordered item is not available, the order is cancelled by no stock.
Step 2 – Approve Payment
This second step is parallel with the first one. Instantly after the order is created, either the Farfetch’s Fraud team can approve the payment or the boutique’s staff can confirm the stock existence on STORM. The Fraud team analyses the order details to approve or reject the payment. When there are suspicions that the order is not trustworthy, the order is cancelled and the motive is reported. If there are no fraudulent suspicions, the order proceed to the next steps.
Step 3 – Decide Packaging
After the stock is confirmed and the payment approved, the boutique must decide the best packaging according to the selected items, as well as printing all the documentation that need to go along with the parcel.
Step 4 – Create Shipping Label
The creation of the Air Way Bills (AWB) is usually done automatically. However, in some cases it is required intervention from the Delivery Support team due to country misspellings or wrong zip codes.
Step 5 – Ready (Send Parcel)
Once the AWB is created, the order automatically moves to the fifth step and is flagged as ready to send. Some boutiques have daily pick-ups while others need to book the pick-up with the courier. When the courier scans the package and the AWB, an e-mail is sent to the customer informing that the order has been shipped and the order is moved to the last step.
Step 6 – In Transit
The order remains in the last step until the courier delivers the order to the customer.
3.1.2 Returns processing
Relative to returns, the flow is slightly different. The control of returns on STORM is not so scrutinized and delays on the acceptance of returns are more regular, what ends denigrating customer experience.
The returns process is triggered once the customer requests a return pick-up within the established time limit. After the courier picks the order up and delivers it to the boutique that sponsored the item, the boutique must check the product and decide if the return will be accepted or if, for some reason, it will be contested. If the return is in mint condition and is accepted, the Farfetch’s Payments team processes the refund to the customer.
3.2 Farfecth reports
All the reporting strategy at Farfetch can be divided into two main categories. By one side, we have all the reports with information regarding the KPIs designed to measure the performance of the miscellaneous relevant areas of the business. These reports can still be subdivided between the ones sent to the boutiques and the ones sent to the brands. Although some of the information is similar, there are relevant differences between the data provided for the two partners. On the other hand, all the e-mail and automatized reports, conceived to inform the stores about the course of their operations.
3.2.1 Boutiques’ performance report
All the partner boutiques are very important to Farfetch because all the business revolves around the boutiques, the stock they share and their performance and celerity dispatching orders.