F
ACULDADE DEE
NGENHARIA DAU
NIVERSIDADE DOP
ORTODevelopment of a functional prototype
for EMG in telemedicine
Ana Sofia Simões Correia Rafael
F
ORJ
URYE
VALUATIONIntegrated Master’s Degree in Bioengineering
Supervisor: Daniel Francisco Barros Marinho Esteves Sá Pina, PhD Co-Supervisor: Renato Manuel Natal Jorge, PhD
Development of a functional prototype for EMG in
telemedicine
Ana Sofia Simões Correia Rafael
Integrated Master’s Degree in Bioengineering
Resumo
A eletromiografia de superfície permite a visualização dos eventos que ocorrem ao nível dos mús-culos através da deteção de um sinal elétrico na superfície da pele, sendo por isso não invasiva. A incorporação de um sistema que permita a aquisição destes sinais biológicos num dispositivo móvel de pequenas dimensões tem visto amplas aplicações para prevenção, diagnóstico e trata-mento ou reabilitação de variadas condições médicas. O acoplatrata-mento da tecnologia anteriormente mencionada com sistemas de monitorização em casa (mais geralmente denominado telemedicina) permite o acompanhamento dos pacientes, conforto adicional e utilização ilimitada pelo usuário. No entanto, os dispositivos móveis atualmente disponíveis no mercado apresentam uma ou mais das seguintes desvantagens: reduzido número de canais de aquisição, utilização de software pro-prietário, não-customizável e elevado preço.
O presente estudo teve como principal objetivo o desenho e validação de uma placa de circuitos impressa para aquisição de 8 sinais eletromiográficos de superfície, que seja compacta, robusta, de baixa potência, segura e de baixo custo. Assim, foram analisadas duas soluções de baixo custo para o circuito de aquisição multicanal dos biopotenciais, sendo a primeira baseada em componentes eletrónicos individuais, e a segunda baseada em circuitos integrados. Desta análise resultou a escolha do ADS1298, um circuito integrado, uma vez que este cumpre todos os pré-requisitos permitindo uma fácil e compacta integração em sistemas de instrumentação médica.
A arquitetura do sistema é constituída por uma placa de circuitos impressa e um computador de placa única para processamento do sinal e comunicação sem fios. Um protocolo SPI permite a configuração do circuito integrado e a troca de informação entre as duas partes do sistema. A placa de circuitos impressos apresenta um bloco de processamento de sinal analógico, englobando um nível de proteção de descargas elétricas e de filtragem. Após o pre-processamento do sinal, este é convertido para digital a uma frequência de amostragem de 2 kHz nos conversores do ADS1298 e enviado pela interface de comunicação para o computador de placa única.
O presente trabalho implementou a arquitetura acima mencionada, servindo como sistema base para aplicações futuras em avaliação de fadiga, prevenção de lesões, melhoramento da per-formance muscular, ergonomia entre outros. Adicionalmente, o protótipo produzido poderá ser usado como ferramenta de aprendizagem em cursos de Engenharia Biomédica.
Abstract
Surface electromyography provides a glimpse into the events occurring at the muscles’ level through the detection of an electrical signal from the skin’s surface in a non-invasive manner. Em-bedding a system which enables the acquisition of this biological signal in a wearable device has been useful in prevention, diagnosis and treatment or rehabilitation of multiple medical conditions. The pairing of the before-mentioned technology with at-home health monitoring capabilities (more generally referred as telemedicine) allows a continuous follow-up on patients, additional comfort and freedom of use for the subject. Despite this, wearable products available in the market fea-ture one or more of the following drawbacks: reduced number of channels, the use of proprietary, non-customizable software and high-price.
The study’s main goal was to draw and validate a compact, robust, powered, safe and low-cost printed circuit board for the acquisition of 8 surface electromyographic channels. Therefore, two low-cost solutions were considered for a multichannel surface electromiography acquisition circuit, the first was based on individual electronic components, and the second in integrated cir-cuits. This analysis resulted in the adoption of the ADS1298, an integrated circuit, for the acquis-ition of surface electromiographic signals since it verifies the prototype pre-requisites enabling easy and compact integration in medical instrumentation systems.
The implemented system architecture is composed of a printed circuit board and a single-board computer for the processing of the signal and wireless communication. A serial peripheral inter-face allows the configuration of the integrated circuit and the exchange of information between the two system’s parts. The printed circuit board features an analog signal processing block, en-compassing a level of protection from electrical discharges and filtering. Then, digitisation of the signals at a sampling rate of 2 kHz takes place in the ADS1298 converters and is sent to the single-board computer.
The present work achieved the implementation of the preceding architecture for the capturing of muscles’ electric potential, serving as a base system for future applications in fatigue evaluation, injury prevention, muscular performance improvement, ergonomics, among others. Besides, the produced prototype can be used as a learning tool in Biomedical Engineering courses.
Acknowledgements
This dissertation was written as part of my Bioengineering Master’s program at the University of Oporto. The completion of this dissertation would not have been possible without the input and assistance of many people; however, there are some people that I want to thank in particular. Firstly, I would like to thank Daniel Sá Pina for the chance and freedom to develop the current pro-totype, for his guidance, constant willingness to help, open-mindedness and the capacity to keep me calm in the most stressful periods. I also thank Eduardo Sousa for teaching and assisting me in decisions related to the PCB conception, for providing me valuable feedback and cost-saving tips and assisting me in the establishement of the communication protocol. Without their support I would not have been able to deliver this dissertation in its current form.
I am also greatful to Dr. Renato Jorge and Prof. Joaquim Gabriel for endorsing the project, allowing me to grow and be a part of it.
Additionally, my thanks go out to Sr. Pedro Alves and Sr. Pedro Galvão for welcoming me at I001 Lab of the Department of Electrical Engineering, for maintaining the workplace light and optimistic. Their assistance throughout the project, handiness and patience, especially in the stages of PCB assembly and platform development were of extreme value.
Finalmente, agradeço aos meus pais e à Totas por sempre me apoiarem e incentivarem. Obri-gada por resistirem à minha teimosia e mau humor, por estarem comigo todos os dias.
Ana Sofia Rafael Porto, June 2019
”Life is 1% inspiration, 98% perspiration and 2% attention to detail.”
Phil Dunphy
Contents
1 Introduction 1
1.1 Social context and economical impact . . . 1
1.2 Motivation and problem description . . . 3
1.3 Contributions . . . 4
1.4 Dissertation structure . . . 5
2 EMG Signal 7 2.1 Biological description of sEMG signals generation . . . 7
2.2 sEMG signal conditioning . . . 10
2.2.1 Electrodes . . . 12
2.2.2 Amplification . . . 15
2.2.3 Filtering . . . 16
2.2.4 Sampling and A/D conversion . . . 19
2.2.5 Safety . . . 20
2.3 Signal relevance and clinical applications . . . 20
2.4 Challenges . . . 26
2.5 Summary and conclusions . . . 28
3 Health Monitoring Systems 29 3.1 Telemedicine and wearables . . . 29
3.2 Technology development . . . 30
3.3 Challenges . . . 31
3.4 Summary and conclusions . . . 32
4 Multichannel sEMG Acquisition Circuits 33 4.1 AFE circuits and interfacing solutions . . . 33
4.1.1 High-performance INA coupled with acquisition systems . . . 34
4.1.2 ASIC solutions . . . 35
4.2 Summary and conclusions . . . 38
5 System Design 39 5.1 Embeded platform . . . 39
5.2 ASIC . . . 41
5.3 Electrodes and cables . . . 44
5.4 Analog signal conditioning . . . 46
5.4.1 ESD protection . . . 46
5.4.2 Filtering . . . 48
5.5 Hardware design . . . 51
5.5.1 PCB considerations . . . 51
5.5.2 PCB design software . . . 52
5.5.3 Schematic and board layout . . . 53
5.6 Software design . . . 54
5.6.1 Data acquisition . . . 55
5.6.2 Preprocessing . . . 57
5.7 Summary and Conclusions . . . 58
6 Prototype validation and Discussion 59 6.1 Method 1 - Square wave signal . . . 59
6.2 Method 2 - Arm muscle signal . . . 61
6.3 Performance metrics . . . 63
6.4 Prototype production cost . . . 64
6.5 Potential future development . . . 64
6.6 Summary and Conclusions . . . 66
7 Conclusions 67 A Antialiasing tolerances consideration 69 A.1 Validation of the bandpass filtering stage . . . 70
B PCB Design Considerations 73
C ESD circuit layout 75
D EAGLE Schematic Sheets 77
List of Figures
1.1 Block diagram of the system modules and communication pathway for the
detec-ted sEMG signals. . . 4
2.1 MU illustration consisting of a α-motoneuron and the muscle fibers it innervates. 8 2.2 Conduction of an action potential in a muscle cell. . . 9
2.3 Intramuscular and sEMG signal monitoring representation. . . 10
2.4 Representation of the three main constituting blocks for EMG recording. . . 11
2.5 Amplitude and frequency spectrum of the EMG signal at different electrode loca-tions. . . 13
2.6 Electrode-Electrolyte-Skin circuit model. . . 14
2.7 Noise contamination and filtering of a sEMG signal during a weak contraction. . 17
2.8 Removal of PLN from sEMG signal using different digital filters. . . 19
2.9 Example of a correct sampling of a 1 V, 1 Hz sinusoid. . . 19
2.10 Correspondence between the resolution and the range of the A/D converter. . . . 20
2.11 sEMG calculation of the root mean squared value. . . 21
2.12 Diagram of the fatigue’s effect in the power spectrum and in the median frequency of the sEMG signal. . . 23
2.13 Measurement of muscle contraction with a bidimensional surface electrode array. 24 2.14 Gait analysis study setup. . . 24
2.15 Tuning curves for ARV calculated from sEMG amplitude. . . 26
2.16 Circuit schematics for differential amplifiers. . . 27
2.17 Double differential and single differential technique comparison for crosstalk sig-nal reduction. . . 28
4.1 RHA2216 fully integrated, multichannel AFE with programmable bandpass fre-quency and fixed voltage gain. . . 36
4.2 ADS1298 fully integrated, multichannel AFE with fixed bandpass frequency and voltage gain. . . 36
5.1 Block diagram of the system modules. . . 39
5.2 Size line-up between the ODROID-C1 and the ODROID-C0. . . 40
5.3 Setting a common-mode without using a right leg drive electrode. . . 42
5.4 Bypassing of a unipolar supply. . . 43
5.5 SPI data output protocol for the ADS1298. . . 44
5.6 Representation of two-electrode sensor cable and 3.5 mm audio jack connector. . 45
5.7 Cable shielding techniques and their effectiveness at attenuating electromagnetic interference. . . 46
5.8 Analog signal conditioning. . . 46
5.9 Diode array device and current-voltage characteristic of the BAV99. . . 47
5.10 Voltage divider circuit schematic. . . 48
5.11 Impedance determination through the vectorial sum of resistance and reactance. . 49
5.12 Second-order bandpass filter frequency spectrum. . . 49
5.13 Overlay of the second-order bandpass filter frequency spectrum and the digital low-pass sinc filter at 1 kHz and 2 kHz. . . 50
5.14 Two layered PCB. . . 51
5.15 Procedure for the design and layout of PCBs in EAGLE. . . 53
5.16 Printed circuit layout of the designed prototype. . . 54
5.17 Software’s activity diagram. . . 55
5.18 Screenshot of the custom program’s visual interface. . . 55
5.19 Illustration of the DRDY and GPIO ODROID pulse-width modulation signal. . . 56
5.20 Results for the lowest and highest numbered channel for the internally generated test signal prior to preprocessing and after correcting corrupted data. . . 57
6.1 Validation design with a function generator and an oscilloscope for verification of the correct signal digitalisation. . . 60
6.2 Verification of the acquisition system with a function generator. . . 60
6.3 Electrodes sites in relation to the muscles’ anatomy. . . 61
6.4 sEMG data from the biceps and triceps during isometric contraction. . . 61
6.5 Power line supply in contrast with battery supply. . . 63
A.1 Sampled values for the bandpass filtering stage. . . 70
B.1 Surface mounted components’ sizes in the metric and imperial code. . . 74
C.1 ESD circuit design recommendations for PCB layout. . . 76
List of Tables
1.1 Price of the wireless EMG wearable sensors and systems for the leading compan-ies in the market. . . 3
3.1 Products for wireless EMG wearable sensors and their main reported features cur-rently being commercialised. . . 30
4.1 INA components on the market which meet the selection criteria. . . 34
4.2 ASIC solutions in the market which meet the selection criteria. . . 37
4.3 Specifications of acquisition devices based on Texas Instruments ASIC solutions. 37
5.1 Summary of the ODROID-C0, ODROID-C1 and Raspberry Pi 3 Model B main
characteristics. . . 40
5.2 Identification of the current ratings needed for the ADS1298 and the maximum current provided by the ODROID-C1. . . 42
5.3 Summary of the set configurations for each of the IC’s programmable features. . 58
6.1 Estimation of the SNR (dB) for the measured muscle’s contractions. . . 62
6.2 System’s performance metrics operating at a sampling frequency of 2000 Hz, 12x gain in high resolution mode. . . 63
6.3 Cost analysis for the assembly of one complete prototype and 1000 prototypes. . 64
A.1 Resistor tolerances example. . . 69
A.2 Calculation of the bandpass filter cutoff frequencies considering the effects of the purchase tolerance. . . 70
A.3 Statistical calculation of the MAE, MSE and RMSE for the obtained data points. 71
D.1 Required components for one complete prototype. . . 81
Abbreviations
A/D Analog-to-Digital
ADC Analog-to-Digital Converter
AFE Analog Front End
ARV Average Rectified Value
ASIC Application-specific Integrated Circuit
CMRR Common-Mode Rejection Ratio
CPU Central Processing Unit
DD Double Differential
DRC Design Rule Check
ECG Electrocardiogram
EEG Electroencephalogram
ENOB Effective Number of Bits
EMG Electromyogram
ER Effective Resolution
ERC Electrical Rule Check
ESD Electrostatic Discharge
GPIO General-Purpose Input/Output
IC Integrated Circuit
INA Instrumentation Amplifier
IRN Input Reffered Noise
MA Motion Artefacts
MAE Mean Absolute Error
MSE Mean Squared Error
MU Motor Unit
NFR Noise Free Resolution
PCB Printed Circuit Board
PLN Power-Line Noise
PSD Power Spectral Density
RC Resistor–capacitor
RMS Root Mean Square
RMSE Root Mean Squared Error
SBC Single-board Computer
SD Single Differential
sEMG Surface Electromyography
SNR Signal-to-Noise Ratio
SPI Serial Peripheral Interface
Chapter 1
Introduction
Bioelectric signals are an outcome of muscle activity and are sensed through needle or surface electrodes depending on the sensing system requirements. Surface electromyography (sEMG) is one of the existing branches for detection of these physiological signals and consists of the measurement of the electric potential at the skin’s surface [1]. The assessment of these signals through the use of wearable devices has been applied mostly for lesion prevention, diagnosis and rehabilitation, allowing for a more personalised, non-invasive and continuous follow-up of the individuals. In turn, wearable devices operate in two possible modes, either in a clinical setting or in a remote location [2]. This last one has seen recent developments due to the growing interest of physicians and patients in an efficient, comfortable and accurate technology that can reduce the hospitals’ waiting list, trigger alert signals, improve healthcare procedures and treatment’s success rates [3].
Advances in the field of wearable devices are a consequence of technological evolutions in the areas of telecommunications, non-invasive sensors running with low-power and the production of low-cost embedded sensing circuits [4]. However, current existing wireless sensing solutions for electromyogram (EMG) present several disadvantages, among which the heavy price clients have to pay [5].
In this chapter, an analysis of the social context and economic impact derived from the de-ployment of such technologies is assessed in section1.1. A description of the motivation for the present dissertation and problem contextualisation is presented in section1.2. Finally, the expec-ted contributions of this dissertation are presenexpec-ted in section1.3and the general structure of the document is described in section1.4.
1.1
Social context and economical impact
EMG signals have been used for medical diagnosis and rehabilitation [6], sports science research, athlete monitoring [7], human-machine interaction [8] and gesture recognition [9,10], while te-lemedicine provides a way for remote patient’s surveillance, injury prevention, diagnosis and re-habilitation. Focusing on the social-economic impact of telehealth for the rehabilitation sector, the
major stakeholders - patients, families, practitioners and the healthcare system - greatly benefit from the employment of biomedical devices for patient supervision at home [11].
Among the list of benefits resulting from the adoption of biomedical wearables for telemedi-cine are:
a) the increase in the efficiency of health services, b) the cost-effectiveness of the treatment,
c) the improved quality of life for the users, and d) the reduction in hospital admissions and visits.
Regarding devices for diagnosis more restrained conclusions can be withdrawn in terms of social and economic impact [12].
For the last two decades, EMG surveillance and telemedicine have been combined for the production of several wearable devices for at-home health monitoring. Developments in this area were and are powered by the increase of healthcare expenses and the growth of people expect-ations. Products for wireless EMG signal capture and corresponding retail price, for all current companies in the sector to the knowledge of the author, are listed in table1.1.
The verified high prices pose a considerable hurdle for the massification of their use since they are in the range of thee295 to e16,115 for off-the-shelf products. This wide rating range is related with the variability in the acceptable number of EMG channels, allowed physiological and mechanical signals input (e.g., electrocardiography, electroencephalography, electrodermal activ-ity, accelerometer, respiration, force, goniometer, among others), and some other extra features. Additionally, the number of captured EMG signals are often limited to one, for the lower bound of prices. Proprietary and non-customisable software restrain the possible usages of the devices. For a more detailed analysis of each product please refer to table3.1. The assessed price range is even more contrasting with the fact that entire EMG acquisition devices could be built for under US$100 resorting to electronic microchips for EMG signals’ acquisition [13,14].
1.2 Motivation and problem description 3
Table 1.1: Price of the wireless EMG wearable sensors and systems for the leading companies in the market. Product Price(e) Shimmer3 [15] from 554 to 3.818 BIOPAC - BioNo-madix Transmitter [16] 1.950/EMG sensor; 6.900 for software. BTS Bioengineering [17] TMJOINT NIPa FREEEMG 9.800 Cometa [18]
Wave Plus wireless EMG
NIP
PicoEMG NIP
Biometrics Ltd [19]
TrignoT MAvanti Sensor NIP
TrignoT M Quattro Sensor NIP TrignoT M Galileo Sensor NIP EMG System (PS850) EMG System (PS1650) 9.300 16.115 Product Price(e) Delsys [20] NIP NORAXON UltiumT M EMG [21] NIP Plux [22] Biosignalsplux Solo 405
Biosignalsplux Explorer 995 + 399 for in-ternal memory Biosignalsplux Re-searcher 3.495 Biosignalsplux Profes-sional 4.900 ergo Explorer 2.195 ergo Researcher 3.495 MuscleBAN 295 BioRadio [23] starting at $3.490 Myontec [24] New MBody 3 939 MBODY AllSport 499 Myo Trac Infiniti [25] NIP
aNo information provided.
1.2
Motivation and problem description
Electromyography regained relevance as a research topic due to the availability of low-cost and low-power consumption sensors, micro-controllers and processing solutions which allow the mini-aturisation of biomedical devices. Moreover, at home health-monitoring practices are more com-fortable solutions for patients needing rehabilitation treatments, ergonomic assessments, fatigue and injury evaluation. Therefore, wearable devices which meet the following criteria are of press-ing interest. These should have the feature of communicatpress-ing with a wide range of platforms, such as smartphones, tablets, or PCs, wirelessly for the elimination of extra costs associated with the acquisition of new devices. Data storage while offline for later interpretation by a special-ised physician, sufficient operation autonomy, reduced size, measurement accuracy, safety and the coupling of several sensors [2].
Current commercial solutions for wireless sEMG measurement are expensive, in the order of the e295 to e16.115 and oversized, making them not suitable for at-home monitoring. Addi-tionally, they commonly rely on gel-based electrodes which may not be the preferred sensors for
frequent use [5]. The development of a solution with high resolution, accurate, flexible configura-tion and low-cost on-board processing with strict requirements on signal quality is meaningful for the implementation of wearable devices.
1.3
Contributions
The main objective of the proposed dissertation is the development and implementation of an af-fordable printed circuit board (PCB) for sEMG acquisition and integration in the existing platform presented inPina et al.[26], illustrated in fig.1.1.
Figure 1.1: Block diagram of the system modules and communication pathway for the detected sEMG signals [26].
Considering that the original system [26] is composed by a signal acquisition board for 8 incoming EMG electrode channels, a sensor and network board, a single-board computer (SBC), in which signal processing, data analysis and transmission are implemented, hosting an SD card and a USB port. To the USB port, a Wi-Fi dongle is attached for the establishment of a Wi-Fi or HotSpot communication. A web server in the SBC allows the visualisation of an HTML5 page containing the processed data in several platforms. The circuit is powered through the battery and power circuit module.
The projected PBC is comprised of an integrated EMG signal acquisition component and ap-propriate modules for signal conditioning of the present biological signal. This removes the sensor and network board modules, thus pushing the direct connection between the signal acquisition
1.4 Dissertation structure 5
board and the SBC. Testing and validation of the prototype are conducted for performance eval-uation with the current platform. The final proposed PCB accounts for size, power consumption, accuracy and safety requirements.
1.4
Dissertation structure
The present document is divided in 7 chapters and appendicesA–D.
Chapter2 focuses on the biological concepts behind the generation of an sEGM signal, the ac-quisition blocks in a circuit for its detection, clinical applications and challenges in this sector.
Chapter3introduces the interface points between the telemedicine and wearables sector, the ex-isting features in the systems currently available are introduced in the form of a table as well as the common elements verified in all of them.
Chapter4revises the state-of-the-art in terms of analog front end (AFE) circuits, their specifica-tions and how these are valid for the specificaspecifica-tions of the biological signal being dealt with.
Chapter5 addresses the circuit schematics and corresponding PCB layout. The final prototype architecture, size and software developed are also presented. In this chapter, appendicesA–Dare generated as supplementary information.
AppendixAanalyses the effects of voltage drift in passive components which especially rel-evant for the filtering stages. AppendixBsummarises the valuable pieces of advice provided by Eduardo Sousa for a correct PCB layout and production cost reduction. AppendixCcontinues with considerations in the layout of the analog signal conditioning components, specifically, revises the placement configuration of the electrostatic discharge (ESD) protection module. AppendixD ac-commodates the eagle schematics and layout for all the modulus of the prototype.
Chapter 6 summarises the obtained results for the validation of the prototype and outlines po-tential future developments and applications.
Chapter 2
EMG Signal
The study of the biological principles involved in the generation of biopotentials allows for a better understanding of the recorded events in the electrodes’ surfaces, providing a glimpse into muscle behaviour. However, sEMG recordings hold different interferences contracted in their path through biological tissues, at the skin-electrode interface, derived from the electronic components, the ambient or other events, such as motion.
Techniques and recommendations for correction and reduction of the previously mentioned undesired events are implemented in the stages of acquisition and processing. Nonetheless, fur-ther investigations on skin-electrode contact, gels, electrodes, and signal processing techniques are needed for complex solutions and correct interpretation of these biopotentials. sEMG read-ings have applications in rehabilitation, biofeedback, sports training and injury prevention, among others.
In the present chapter, a brief description of the underlying biological events involved in the generation of the surface potential is presented in section2.1. Section2.2 lists the interferences and required modules in signal conditioning in order to have the best signal quality possible. Information extraction techniques from the acquired signal and fields of application are addressed in section2.3. Challenges related to the previous sections are summarised in section2.4.
2.1
Biological description of sEMG signals generation
Muscles are constituted by muscle fibres which, in turn, are attached in groups to an α-motoneuron, forming a motor unit (MU), fig.2.1 illustrates the relationship between these elements. An α-motoneuron has numerous dendrites (extensions) which collect descending electrical potentials from the central nervous system and activate the muscle fibres at different rates. A single MU activation produces the MU action potential, while a repeated continuous activation of the MU creates the MU action potential trains, which are responsible for sustained forces in motion regu-lation. Muscle control is achieved with the combination of electric signals and MUs recruitment, producing twitches in the corresponding muscle fibre.
MU properties vary depending on the muscle size and capacity to produce force, these are categorised according to their fatigability (sensitivity to fatigue) and speed of contraction. MUs are progressively mobilised and increase their discharge rate with time as the stimulation is incre-mented for a set of MUs, so the earlier recruited MUs have a more frequent firing activity.
Muscle fibres innervated by a particular motoneuron have similar biological properties among them. Nonetheless, there are muscle fibre populations with different activities resulting in a more specific and uniform localised behaviour.
Muscle
fibers
Neuromuscular
junctions
Motor unit 2 Motor unit 1 Spinal cord NerveMotor neuron
axon
Motor neuron cell body MuscleFigure 2.1: MU illustration consisting of a α-motoneuron and the muscle fibers it innervates. Adapted from [27].
EMG biopotentials result from the overlap of generated electric-potential fields when muscle cells depolarise for muscle fibres’ contraction, that is, it is a consequence of the superposition of MU action potential trains. The depolarisation behaviour was firstly studied by Hodgkin and Hux-ley in 1952, and their findings are commonly used to study muscle cells behaviour. They state that electrical discharge propagation in muscle cells and contraction are explained by the maintenance of a resting potential between the membrane’s exterior and interior wall through the selective per-meability of two ions (sodium, Na+and potassium, K+) and calcium, Ca2+channels’ control. The pre-established membrane’s resting potential is countered when the membrane voltage threshold is exceeded, leading to the membrane’s depolarisation - conductance of Na+ions to the cell interior -producing the action potential. Followed by the inverse movement of the K+ions during the repol-arisation. This way, pulses from external electrical currents or from acetylcholine - released from
2.1 Biological description of sEMG signals generation 9
nerve cells - are conducted through muscle cells1. The events previously described are depicted in fig.2.2with the corresponding produced potential and transmembrane current.
(a)
(b) (c)
Figure 2.2: Conduction of an action potential in a muscle cell.2.2aillustrates the flow of Na+and K+and the resultant membrane polarisation.2.2brepresents the produced transmembrane voltage and2.2cthe produced transmembrane current. Adapted from [1].
The electrical current’s flow in the exterior cell membrane, resultant from the conduction of the signals in each muscle fibre, allows the detection of voltage close to the location of the signal’s ori-gin or at the skin surface. Comprehension of the generated action potentials during depolarisation and repolarisation provides an insight for the interpretation of sEMG signals.
Monitoring the muscle electric potential can reveal information for medical diagnosis and re-habilitation, such as in strength training, prevention of injuries, therapeutic and rehabilitative ap-proaches for the improvement of patients quality of life or the performance of top-level athletes [1]. Intramuscular or surface electrodes provide a way to acquire the generated muscle potentials, both methods are illustrated in fig. 2.3. However, sEMG recording and analysis is the most widely used technique due to its non-invasiveness and no need for a specialised operator, posing minimal risk for the patient [28]. In this configuration, depending on the origin of the potentials and the electrodes’ positioning, the captured signal may have to pass through a thicker layer of tissue, also
1The described process does not comprehend invaginations and layers present in the membrane of muscle cells, and
different electrical parameters. T-tubules correspond to these radial invaginations of the membrane, which are essential for the excitation (action potentials) contraction (Ca2+channels) coupling specifically for muscle cells. Despite this, the model of Hodgkin and Huxley for the nerve cells can be regarded as a valid approximation to muscle cells.
known as volume conductor. In it, spatial lowpass filtering takes place, as represented in fig.2.3b
by the voltage signal with less high-frequency content, up to a distance where the potentials are no longer detected.
(a) (b)
Figure 2.3: Intramuscular and sEMG signal monitoring representation [1]. 2.3a represents the intramuscular EMG, while2.3billustrates the same blocks for the sEMG.
2.2
sEMG signal conditioning
Focusing on sEMG sensing, the recorded voltage arises from the overlap of the muscle fibres’ produced potentials and the addition of various noise components. These interferences are mainly registered below 50 Hz and are summed to the original signal at the time of its acquisition, inducing noise and offset. The main causes of signal interference are:
1. Generated at the skin-electrode interface (electrochemical noise). The electrode-skin con-tact is noisy due to the conversion of ion’s movement, in the conductive gel, to electron’s movement, in the metal surface, producing baseline displacements up to 20 Hz in the fre-quency spectrum;
2. Produced by the electronic system, namely due to the amplifier which contains semicon-ductors thus produces thermal noise, this cannot be eliminated [29];
3. Derived from electromagnetic radiation, which is picked from the power-line or other sources such as radio, television transmission, lights, etc, due to their proximity. The power-line noise (PLN) is registered at 50 Hz or 60 Hz, depending on the local frequency of the power line, and can be one to three orders of magnitude higher than the original signal. This signal interference can result from the establishment of stray capacitances with the power line and with the ground. As to the other sources of electromagnetic radiations, they are found in higher frequencies [29];
2.2 sEMG signal conditioning 11
4. Resultant from muscle’s crosstalk, which stems from the capture of multiple signals from MUs. This event is more relevant in sEMG sensing especially for children (who have smal-ler muscles, so activity picked in the electrode’s surface may be from neighbouring muscles) and is dependent on the electrode spacing, distance to the origin and length of MU. The bandwidth of the crosstalk signal can span across all the sEMG frequencies and reach higher or lower frequencies [30];
5. Other electrical events unrelated to EMG, such as motion artefacts (MA)2, cable motion, etc, originate frequency interferences around the 20 Hz.
The two first sources of noise constitute the baseline noise which exists independently of the muscles’ contraction. These spawn across the entire EMG frequency spectrum and beyond. Ways to suppress or minimise these and the previously exposed sources of interference are presented in the next sections.
sEMG signals depend on a number of factors, as previously stated, causing amplitude vari-ations from the µV up to low values in the mV and frequency content which reaches from 0 Hz to 450 Hz, with predominance in the 80 Hz to 100 Hz [32]. Therefore, precise and accurate represent-ation of the EMG signal, reduction of the noise sources, stability (i.e., invariance to muscles’ firing activity) and high signal-to-noise ratio (SNR, for a sound distinction between the biopotential and the underlying baseline noise) should be guaranteed when designing a circuit for sEMG sensing. The main required conditioning blocks common to all acquisition systems are signal amplifica-tion (due to the low detected voltage), filtering (for noise suppression) and analog-to-digital (A/D) conversion, represented in fig.2.4. To these three base conditioning modules, other levels can be added, such as wireless communication depending on the final application [33].
Figure 2.4: Representation of the three main constituting blocks for EMG recording. These are signal detection (in the electrodes), amplification and conditioning (in the AFE), and analog-to-digital converter (ADC) converter [33].
2MA interferences appear between 10-30Hz. Skin preparation, electrodes selection and placement, fixation of
2.2.1 Electrodes
The first step in sEMG sensing is the screening of the electric potential at the skin surface em-ploying electrodes. Biopotentials are detected recurring to electrodes and appropriate measuring circuitry for the detection and recording of current in the body. These electrodes transduce an ionic current, in the biological tissues, to an electronic one, at the electrode’s surface [34]. Three main factors affect this stage, namely the electrode surface’s physical characteristics (e.g., elec-trode configuration, location, distance, size and type), the skin-elecelec-trode or elecelec-trode-electrolyte interface and the amplifier input impedance.
Referring first to the electrode configuration, this can be monopolar, bipolar or array/line. The monopolar configuration is based on the reading of one electrode making it sensitive to common-mode signals (e.g., PLN) and is mainly applied to electroencephalography and neurophysiology studies. The bipolar configuration is the most frequently used setting, while array/line layout uses electrodes constantly interspaced through all the muscle length, allowing the study of individual MU [35]. The following analysis will focus on the bipolar configuration due to the verified higher number of reported low-cost applications with this setup.
The bipolar configuration eliminates common-mode signals which are detected in both elec-trodes and are not related to the EMG electric potential. In this way, two elecelec-trodes are used and a third one is placed at a reference point where the EMG activity is very limited. They must not be positioned close to innervation zones and tendons, due to amplitude decrease and closeness between muscles which induce crosstalk.
The detection of innervation zones is possible in three ways:
• Direct stimulation, innervations are located at the regions where the minimal electrical stim-ulation induces muscle twitches. This technique is not quite sensitive to the location of the innervation zones since these can be located dipper in the tissues;
• The location where the signal amplitude is the smallest, or the action potential’s phases invert, during a weak contraction corresponds to the innervation zone. This is evaluated with an electrode array [36];
• The place with the highest median frequency at the start of a muscular contraction corres-ponds to the innervation zone [37].
The electrodes should be placed at the centreline of the muscle belly and between the innerv-ation area and the neuromuscular connection. The preferred electrode positioning for maximal amplitude, low noise and low sensitivity to small displacements is represented in fig.2.5.
2.2 sEMG signal conditioning 13
Figure 2.5: Amplitude and frequency spectrum of the EMG signal at different electrode locations. Electrodes positioned at the innervation zone (top), the muscle-tendon interface (bottom) and the border of the muscle (middle right) [38]. The power spectral density (PSD) is a quantification measurement of the frequency content, this is further detailed in section2.3.
Also, the electrodes must have an optimal distance of 1 cm to 2 cm and be oriented perpen-dicularly to the muscle fibres course in order to cross a sufficient number of fibres and have a representative signal of the MU. At the electrode’s surface, biopotentials are averaged which res-ults in their smoothing. The larger the electrode’s surface, the higher the smoothing effect and the lower the high-frequency spectrum, inducing loss of information. Consequently, small electrodes with diameter inferior to 5 mm are preferred [1].
The existing electrode options can contact directly with the skin or include interface gel sub-stances3.
Gel-based electrodes have long preparation time, are susceptible to prolonged usage and move-ment, and generally are one-time-use items. Despite this, they possess low electrode-skin impedance, low noise, proper electrode-skin contact and chemical stability, being silver-silver chloride (Ag/AgCl) the preferred plate material [35,39].
Dry electrodes have the advantage of being more easily used, not requiring a gel, thus reducing the risk of it getting dry or creating a skin reaction. However, these can be more easily detached which can compromise the entire set of measurements.
Textile electrodes are a third recent alternative which has seen an increase in its usage since they are malleable, washable and reusable, making them ideal for integration in clothes [26].
These features potentiate their use for telemedicine and professional health care monitor-ing [40].
At the electrode-skin interface conversion of the biological signal to an electrical current intro-duces noise, yet the final desired outcome of this stage is high SNR, and stability upon variations in the skin conductance due to sweating and humidity. If between the two surfaces is introduced an electrolyte, then the previous characteristics ought to be preserved. In this case, the transducer’s surface is shifted to the electrode-electrolyte interface.
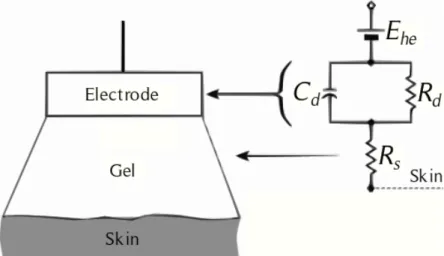
The equivalent circuit for a biopotential electrode-electrolyte interface is represented in fig.2.6.
Figure 2.6: Electrode-Electrolyte-Skin circuit model. The parallel Rd and Cdrepresent the imped-ance at the electrode-electrolyte interface. Rsrefers to the resistance of the electrolyte. Adapted from [34].
In this model, a voltage source (Ehcaccounts for the half-cell potential4), a parallel RC (resistor-capacitor) circuit (depicts the correct modelling of the interface behaviours) and a resistor (Rs portrays the electrolyte and interface resistance) delineate the electrode-electrolyte properties. Through a simple analysis in terms of frequency behaviour, it is demonstrated the electrode’s im-pedance dependence in terms of frequency5, this has implications on the selected amplifier input impedance, as shall be seen.
Common procedures before fixation of the electrodes to the skin surface are shaving and rub-bing the skin with an abrasive fabric wet with water or a solvent to remove dead material. These procedures increase the signal stability. However, for a pair of electrodes in the same electrolyte, a movement between them produces a differential potential known as MA. The second cause of MA is the change of the position between the skin and the electrolyte, significant in dynamic contraction and vigorous activities [34].
4For further insight on half-cell potential please refer toWebster[34].
5For high frequencies, where 1/ωC
d<< Rd, the capacitance is little, hence the overall impedance is Rsand the
capacitor can be viewed as "short-circuited". At high frequencies, where 1/ωCd>> Rd, the capacitor functions as an
2.2 sEMG signal conditioning 15
Thereby, following the previous recommendations in terms of electrode selection, positioning, skin preparation and fixation will yield a higher signal quality at the output of this level [35].
2.2.2 Amplification
The electrical signal acquired at the electrode’s surface requires amplification, most commonly of voltage levels, for the future processing and display of the signal. Since bipolar leads are the most often used configuration for the acquisition of biopotential signals, the differential amplifier configuration provides the best outcome for the suppression of electrical interferences. These disturbances can be from the power line and events which are common to both sensing sites, such as background noise from neighbouring muscles.
The contribution of common mode disturbances can be determined through eq. (2.1). Its prin-ciple is based on the amplification of the different signal components captured at the electrodes by subtracting both channels. The product of the differential voltage (determined through eq. (2.2)) and the gain returns the output of the differential amplifier. Vpand Vnstand for the two signals ac-quired from the electrodes conducted to the respective input terminals of the differential amplifier.
Vcommon=
Vp+Vn
2 (2.1)
Vdi f f= Vp−Vn (2.2)
The amplifier ’s capability to reject common-mode signals is quantified by the common-mode rejection ratio (CMRR) which is calculated through eq. (2.3), where Ad is the amplifier’s differ-ential gain and Acis the amplifier’s common-mode gain. The CMRR must be high for low noise amplification, higher than 90 dB is an acceptable value [41].
CMRR= 20Log10(Ad/Ac) (2.3)
While it is possible to acquire amplifiers with CMRR up to 120 dB, a number of factors limit this upper bound, namely the cost, the electrical stability, and the noise signals which may be slightly out of phase at the detection moment, making the rejection of the common-mode voltage not achievable [42]. A workaround for the non-complete removal of the common-mode signal is the right leg drive circuit where common-mode feedback is applied to the subject with an opposite phase.
As a result of the input signal’s low amplitude, the bandwidth of the amplifier should be limited for enhancement of the SNR and confer a high gain (in the order of 1000) for the subsequent processing phases. Moreover, the amplifiers’ input impedance needs to be as large as possible, at least two orders of magnitude higher than the maximal electrode-skin impedance (which may reach 1 MΩ for small dry electrodes), as to not have signal attenuation and distortion. Current components provide impedances in the order of 109Ω to 1012Ω in parallel with a 2 pF to 10 pF capacitor.
Additional noise is introduced in the path from the electrodes’ surface to the amplifier in-put due to the proximity and electric field created by both cables. To reduce this noise, a pre-amplification stage, with low noise amplifiers, can be implemented as close as possible to the electrodes, in this configuration the electrodes are referred to as active electrodes. Its advantage is related to the suppression of direct current (dc) signals, thus the amplifier’s output impedance can be reduced to 10 Ω [1].
2.2.3 Filtering
The need for filtering arises from the desire to recover a non-noisy signal with meaningful spectral content in the frequency band of the sEMG signal. Hence, it is desired the design of a bandpass filter which limits the frequency response to a specific range. The lowpass filter applied at the high-frequency end of the spectrum is designed with a corner frequency where the SNR is lower than 1 (frequency at which the voltage noise overpowers the biopotential’s voltage). With the previously stated sEMG characteristics, the lowpass corner frequency is set in the range of 400 Hz to 450 Hz, above this frequency the sEMG signal loses relevance. Additionally, the lowpass filter avoids aliasing during sampling, therefore it has to be implemented in an analog circuit [32].
At the low-frequency end of the spectrum, multiple noise sources (e.g., PLN, artefacts from slow movements and instability in the detection interface, etc.) overlap with the muscle’s gener-ated potential. Therefore, multiple studies were conducted in order to find the most appropriate cutoff frequency, which produces the lowest frequency distortion.
In 1998, the Surface EMG for Non-invasive Assessment of Muscles [35] endorsed the adop-tion of 10 Hz to 20 Hz; in 1999, the Standards for reporting EMG Data [43] advised 5 Hz corner frequency. De Luca et al. [32] select a highpass filter corner frequency at 20 Hz for natural and standard movements or isometric contractions6; while for high activity monitoring (e.g., sports
or movement disorders) higher corner frequencies are adopted with the detriment of signal’s amp-litude and spectral linearity. Moreover,De Luca et al.consider that a frequency below 20 Hz will not eliminate unstable signals resultant from the muscles firing activity.
A visual interpretation of the desired filter’s effect on the sEMG interferences is presented in fig. 2.7. sEMG signal interferences in the frequency spectrum are illustrated in figs. 2.7a
and2.7b. The baseline noise, 1/ f , has its highest amplitude at 0 Hz, reaching a nearly constant value by the 10 Hz to 20 Hz. While the MA shows a greater amplitude bellow 50 Hz. The recorded amplitudes for all the signals were acquired during a weak contraction where the baseline noise is more critical to the sEMG signal interpretation due to its lower amplitudes. Both observations validate the use of a bandpass filter, fig.2.7c, with a high end cutoff frequency in the 450 Hz for the suppression of the baseline noise without loss of sEMG signal and in the lower frequencies a highpass cutoff frequency in the 20 Hz.
6Isometric contractions are characterised by the maintenance of a still position, there is a balance between the
2.2 sEMG signal conditioning 17
(a)
(b)
(c)
Figure 2.7: Noise contamination and filtering of a sEMG signal during a weak contraction. 2.7a
illustrates the baseline noise (red) and the sEMG signal (green). 2.7bintroduces MA at different points, indicated by the vertical arrows. 2.7c signal filtering for reduction and suppression of interferences across the frequency spectrum [38].
During the design of these filters, specifications for the filter type (e.g., Butterworth, Cheby-shev, etc.) and slope of the cutoff (in dB/octave or dB/decade), usually in the order of the 40 dB/decade, should also be stated for full characterisation of the filter [1].
The earlier established bandpass frequency, 20 Hz to 450 Hz, does not cancel PLN. Further-more, the previously mentioned analog techniques for the increase of the CMRR, i.e. driven right leg circuit and cable shielding, have stability issues which affect the robustness of the PLN elimination [44]. In contrast, digital signal processing allows a more reliable elimination of this interference; however, they have to be compliant with a real-time application in low-power and wearable systems. In this field, several solutions have been developed in the past decades.
Notch filters [45] were primarily employed for suppression of PLN since they are easy to imple-ment and demand low computational requireimple-ments7. Nonetheless, important information related to the muscle’s performance is erased and distorted near PLN frequencies.
Regression Subtraction [47] and Sinusoidal Modeling [48] determine the PLN sinusoid and sub-tract it to the original acquired signal. The sinusoid parameters can only be determined when there is no muscle activity, excluding its use in dynamic contexts responsible for inducing variation in the phase of the interference. The Fast Fourier Transform allows the identifica-tion of the fundamental PLN frequency, even in dynamic settings, overcoming the previous limitation. However, the computational cost of this calculation with sufficient precision is not compatible with the requirements of real-time and low-computation capabilities. In addition, these two methods need prior knowledge of the PLN frequency.
Adaptive Filtering [46] consists of a linear filter where the PLN parameters are not known in advance, making it robust to variations in the power-line frequency. The algorithm pro-posed byKeshtkaran and Yang[46] determines variations in the frequency, amplitude and phase of the PLN and has the advantage of low computational demands and low memory requirements.
Tomasini et al.[44] perform a comparison of these four types of filters for sEMG’s PLN removal, the results can be viewed in fig. 2.8. Their work confirmed the out-performance of the adapt-ive filtering over the other digital filters for the complete removal of PLN and yielded the most satisfactory results for computational and memory requirements.
7Analog notch filters can be fully implemented in an integrated circuit (IC); however, they consume a large area for
2.2 sEMG signal conditioning 19
Figure 2.8: Removal of PLN from sEMG signal using different digital filters. Top row: raw and filtered signals, bottom row: frequency spectrum [47].
2.2.4 Sampling and A/D conversion
The ADC’s sampling frequency (fs) has to at least double the maximum frequency of the input signal, fs/2 > |f |, as defined by the Nyquist-Shannon sampling theorem. Hence, if the lowpass filter is set with a cutoff frequency of 500 Hz, then the ADC has to have a minimum sampling rate of 1000 Hz (as recommended in [35]); otherwise "aliasing" effect occurs which results in the impossibility to recover the initial waveform from its samples. Figure2.9 represents this effect, where the reconstruction of a sinusoidal signal, with the lowest possible frequency, from the set of acquired samples, is only achievable when the sampling frequency respects the Nyquist-Shannon sampling theorem.
Figure 2.9: Example of a correct sampling of a 1 V, 1 Hz sinusoid (original signal - left). Sampling at approximately 2Hz (centre) and 4/3 Hz (right), with respective signal reconstruction (signals in dashed red) from the selected samples. Only the centre sampling frequency respects the Nyquist Theorem and results in no signal aliasing. Adapted from [49].
The ADC discretises the input signal to a set level (N) given by N = 2n− 1, where n is the converter ’s number of bits used to represent each sample. Setting the input range (VRange) to an amplitude with a small margin to the expected input peak-to-peak amplitude enhances the resolution of the converter by decreasing it. The voltage increment in each level is determined with eq. (2.4) which gives the resolution of the digitisation. This limits the minimum voltage
variation resolved as a different level during the quantisation. Figure2.10illustrates the effect of reducing the voltage range of the ADC in the resolution, while keeping the number of bits constant.
VResolution= VRange/2n (2.4)
Figure 2.10: Correspondence between the resolution and the range of the ADC. The represented MU action potential is characterised by 2.5 Vppand is quantised through a 16 bits converter with a range of 10 V (left) and 2.5 V (right). The resolution (∆V ) determined with eq. (2.4) is 153 mV and 38 mV, respectively. Adapted from [49].
The common resolution of ADC is of 8, 12 or 16 bits and the typical ranges are ±1.25, ±2.5, ±5 and ±10 V, their selection will depend on the baseline noise8 of the input signal. Depending on the signal there may be the need to adjust the gain at the amplifier stage, set commonly to values between 100 to 10000, as to not have a saturation of the converter due to voltages exceeding the defined range [1].
2.2.5 Safety
The concern of having a harmful current passing through the user’s skin and body due to an elec-tric device’s failure cannot be neglected. Therefore, the user needs to be isolated from elecelec-trical sources (e.g., power lines or ground) for safety measures. This can be accomplished through the use of optical isolators or isolation transformers to reduce signal artefacts. Nonetheless, the notion of electrical isolation is not especially critical for devices solely powered by low voltage (3-15 V) batteries [42], not having a direct or indirect connection to the power-line voltage, verified in the current prototype.
2.3
Signal relevance and clinical applications
sEMG studies are used for motor control survey in physical therapy, diagnosis, task performance evaluation, gait analysis, study of neural activation patterns, and more. In this section, an overview of the two most used quantification parameters, namely, average rectified value (ARV) and root
8DelSys measures this parameter by connecting the EMG electrode inputs to the reference potential during no EMG
2.3 Signal relevance and clinical applications 21
mean square (RMS), will be presented, followed by the most relevant applications and uses of sEMG.
The ARV and the RMS are the most usually computed quantitative measures, in the time do-main, to evaluate changes in the biopotentials and characteristics of the muscular contractions. The first corresponds to the average value of the absolute amplitude over a given period of time (i.e. moving average) or to the lowpass filtered rectified value (linear envelope). While the second is defined as the square root of the amplitude mean square, as defined in eq. (2.5) where N corres-ponds to the number of samples and xkto sample k [33].
RMS= s 1 N N
∑
k=1 [xk]2, k = 1, 2, ..., N (2.5)An example of the calculation of the RMS value of an sEMG signal is illustrated in fig.2.11.
Figure 2.11: sEMG calculation of the RMS value. Resultant signal (on the right) from the applic-ation of the RMS function to the sEMG raw signal (on the left). This representapplic-ation allows the evaluation of the signal’s energy. Adapted from [38].
Both measurements are used to indirectly evaluate neural performance and enable the visualiz-ation of changes in the physiological properties of the signal. Even though ARV and RMS provide similar information, especially during isometric muscle contractions, RMS is more correlated to muscle activity.
sEMG signals suffer from various sources of inferences, so the mentioned quantitative meas-ures are calculated as percentages with reference to the recorded value during maximal voluntary contraction, this procedure is also known as normalisation. In this way, such measurements can be used as unified performance metrics, thus allowing the comparison inter-subjects performing the same movement or inter-muscle for the same individual.
An application of the RMS metric is achieved with the determination of the signal’s power (RMS2) which can be related to the produced force, although this relation is not always linear. The main reasons for the non-linearity are the dependence of the signal’s power on the angular
joint position, the speed of the produced force9, the number of recruited MU and the class of movement. While for isometric contractions, the relationship is linear between the 0-40% and 50-100% of the maximal voluntary contraction, in dynamic conditions due to the relative motion of the electrodes-muscles position, ARV is more variable and inertial components are harder to measure, making the force and torque estimation more difficult [53,54].
Depending on the properties of the muscle currently being investigated, other processing tech-niques may be implemented based on the signal frequency content, such as the PSD for analysis of muscle fatigue. The PSD is calculated in a non-parametric way with the Fourier Transform through eq. (2.6), where s(t) is the sEMG signal and T the total number of measurements [55].
ˆ PFT( f ) = 1 T T
∑
t=1 s(t)exp(− j2π f t) 2 (2.6)For sEMG signals, the mean frequency is usually located between 50 Hz to 110 Hz and the median frequency in the range of 70 Hz to 130 Hz [56]. From the PSD (vertical axis in fig.2.12a) and the median frequency (depicted in fig. 2.12 by the stars) parameters, information concern-ing fatigue levels can be inferred. Muscle fatigue induces compression of the PSD and median frequency reduction. Fatigue effects on these two measurements are represented in fig.2.12.
(a)
9The activation of MU starts with the recruitment of small MU, with time and required force multiple muscles
become activated. The activation of these muscles is done in patterns while maintaining a total constant output force. Hence, a direct correspondence between force and EMG amplitude is not valid because while some muscles reduce their contraction level, others take the responsibility for movement sustenance, also known as "load sharing" [50–52].
2.3 Signal relevance and clinical applications 23
(b)
Figure 2.12: Diagram of the fatigue’s effect in the power spectrum and in the median frequency of the sEMG signal. The fatigue induces compression of the PSD (2.12a) and median frequency ( fmed) reduction (2.12b) [38].
These calculations provide an estimate of muscles activation magnitude, making them relevant for the assessment of different medical conditions. The most significant applications of sEMG sensing are introduced henceforth.
Ergonomics and occupational medicine
Applications of sEMG sensing in ergonomics and occupational medicine stem from the need to correct lesions produced in work-related injuries, fatigue and bad posture. sEMG studies allow the quantification and assessment of muscular activity through the investigation of [33]:
• Activation intervals,
• Degree of co-contraction, and
• Detection of muscle fatigue and extent of relaxation.
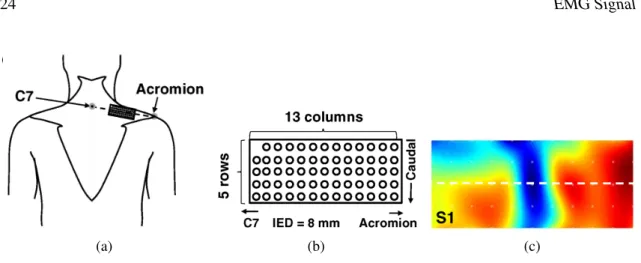
In the past decade, the use of sEMG imaging techniques has increased as it provides a map of amplitude distribution (e.g., ARV) and fatigue-related parameters, which can then be used as in-dicators for bad posture and continuous biofeedback for training or re-training. For this recording mode, a two dimensional electrode array, illustrated in fig.2.13b, conveys biopotential measure-ments for a certain area, shown in fig. 2.13a, which can then be converted to RMS values, as represented in fig.2.13c, RMS estimations are then related to muscle fatigue. The same procedure could have been implemented for ARV. In [57] and [58] the authors verified that, with biofeedback of the activation map, individuals were able to redistribute muscle activity while maintaining the same performance in repetitive tasks.
(a) (b) (c)
Figure 2.13: Measurement of muscle contraction with a bidimensional surface electrode array.
2.13a illustrates the positioning of the electrode array over the upper trapezius muscle. 2.13b
represents the bidimensional electrode array with 8 mm distance interelectrode. 2.13cpresents the interpolated image, also known as map, of the sEMG RMS during a 50% maximum voluntary contraction. Adapted from [59].
Movement and gait analysis
Muscle assessment during movement and gate is achieved with the application of 5-8 electrodes for simple tasks and 12-16 electrodes for complex ones [60].
A clinical application is the recognition of the origin of motion impairment and consequent compensatory movements, providing a useful tool for evaluation and support to physicians de-cisions for the realisation of surgery, rehabilitation, muscle inhibition with drug treatment, etc [61,
62]. In addition, it can be used to verify recovery rates derived from a specific treatment, indic-ating its effectiveness through an objective quantification of muscle activity even during dynamic observations [63].
In order to correctly correspond the acquired muscle potentials with the actual motion events, temporal markers are used, these can be added to the signal through switches, video with an adequate frame rate, or kinematic data. The steps illustrated in fig.2.14 need to be considered when designing a gait analysis study setup.
Definition of the Problem
1
2
3
4
5
6
Definition of the muscles of interest, selection of the required accuracy and resolution. Electrode SelectionFor motion analysis, small electrodes with a few millimetres diameter are preferable1. Electrode Placement Minimisation of the capture of muscle's crosstalk. Task and Repetitions Definition of the performed task and number of repetitions
to obtain consistent data, without causing
fatigue.
Data Quality
Evaluation of measurements reliability (e.g., PSD
should have a bell shape2
spectrum distribution).
Medical Report
Generation of a report for physicians
to interpret. They prefer a full-scale representation instead
of auto-scale.
1 Hence, electrodes of 1–2 cm diameter for paediatric electrocardiography (ECG) are not suitable.
2 The PSD bell shape can be affected by PLN (50Hz or 60Hz and corresponding harmonics) and MA interferences. In particular, MA interferences appear between 10 Hz to 30 Hz and short amplitude bursts, due to abrupt accelerations.
2.3 Signal relevance and clinical applications 25
Musculoskeletal physical therapy
Musculoskeletal physical therapy is used for identification of problems in the neuromuscular sys-tem and for verification of improvements through rehabilitation. From these signals, the following pieces of information can be withdrawn:
• Detection of onset10and offset11muscle activity;
• Evaluation of muscle fatigue;
• Quantification of muscle activation magnitude12;
• Tuning curves for sEMG representation of muscle activation for different forces and direc-tions;
• Mapping of sEMG spatial distributions.
As previously mentioned, muscle fatigue can be monitored with several electrodes configurations (e.g., bipolar, linear or bidimensional electrode arrays). Bidimensional electrode arrays offer in-formation in terms of conduction velocity, estimation of firing rates [64], muscle’s recruitment patterns [56,65], localisation of innervation zones and tendinous regions [66]. The conduction velocity is calculated through eq. (2.7); where e represents the interelectrode distance and d the delay between two signals, calculated with the identification of the time difference where there is a minimisation of the mean square error between the Fourier Transform of the two signals [67]. conduction velocity estimates range form 3 m sec to 5 m sec. This value indicates changes in the cells membrane characteristics and can be used in fatigue, pain, physical exercise and pathology assessment [68].
ConductionVelocity= e/d (2.7)
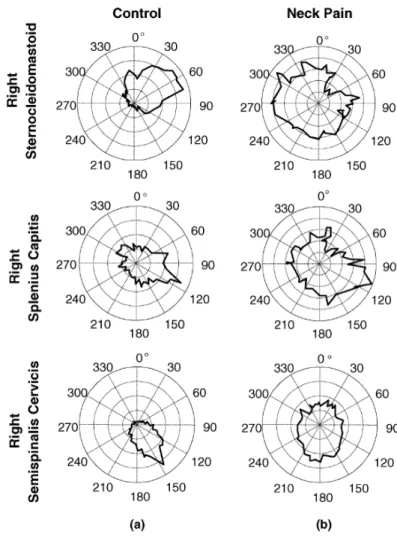
In particular, the representation of sEMG’s amplitude in tuning curves allows the visualisation of muscle activation as a function of the orientation of movement or the required force. Such studies have been used for the arm and neck, specifically for patients with neck pain. An example of this representation is presented in fig.2.15, where the recordings of ARV from three muscles are represented as a function of the angle’s direction of the force (from 0◦to 360◦) for a patient with neck pain (on the right) and a control subject (on the left). With this analysis, it can be verified the abnormal and undifferentiated muscle activation for the patient with neck pain indicating potential changes in the motor neuron excitability [69].
10Onset muscle activity is related to muscle activation and contraction. A delay in this activity corresponds to a latter
response in the muscle activation.
11Offset muscle activity is characterised by the switch off of the muscle contraction. Offset delay has the effect of
increasing the time muscles take to relax.
12To this topic ARV or RMS are used as estimate parameters, these measurements require normalisation for the
Figure 2.15: Tuning curves for ARV calculated from sEMG amplitude. Recordings of ARV from three muscles with sEMG sensors are represented dependent on the force’s direction (from 0◦to 360◦) for a patient with neck pain (on the right) and a control subject (on the left). The performed task involves a circular contraction with the change in force direction from 0◦ to 360◦exerting a 15 N force in the horizontal plane recorded with strain gauge sensors placed in the head. Hence, for the production of the same force in each direction, it is revealed that the amplitude of the activation curves for the patient have a distributed muscle excitation level across all directions [69].
2.4
Challenges
Despite sEMG’s easiness of acquisition (no need for specific training), interferences from the en-vironment pose challenges to its use and correct interpretation. The establishment of a relation between force and sEMG signal amplitude is still not possible. It is expected that for the next decades this physiological signal will remain a qualitative indicator of muscle activation and evol-ution assessment with relation to an initial reference. Up to this date due to the wide variability in the signal’s contributors, it is not possible to inversely determine the produced forces from the
2.4 Challenges 27
measured sEMG. Among the factors which induce sEMG variability are biological ones (e.g., sub-cutaneous fat layer thickness and fibres’ inclination with relation to the sensing system), originated in the setup (e.g., inter-electrode distance and applied filters) and due to subjects inter-variability (e.g., muscle length and fatigue) [42].
A second obstacle in sEMG acquisition and circuit design is related to the relative positioning of electrodes and muscles. The electrode’s location changes through the contraction of muscles which results in the capture of signals from adjacent muscles, also known as crosstalk. The current solution for this event is the study of isometric contractions or the consideration that the recorded signal is unstable. In the past, it was hypothesised that through the detection of signals in adja-cent muscles it would be possible to estimate their correlation and if these values were high there would be crosstalk. Nonetheless, the muscles and tissues anisotropic and inhomogeneous proper-ties result in signal paths up to the skin surface yielding different impedances, causing frequency mismatch (uncorrelated signals) between the two measurements, resulting in the non-elimination of crosstalk (also known as false-negative error). Moreover, the muscles’ contraction for the exe-cution of a task can be cross-correlated (e.g., both muscles working towards the same goal) without really existing crosstalk, inducing false positive detections [38]. A possible approach for muscle crosstalk identification and reduction was proposed byKoh and Grabiner[70], through the study of three differential acquisition models represented in fig.2.16.
Figure 2.16: Circuit schematics for differential amplifiers [70].
These circuits were studied during rest, maximum voluntary effort and electrical stimulation of a neighbouring muscle. It was verified that crosstalk was reduced with branched electrode and double differential configurations (fig.2.17); although the branched electrode may be preferred as it has one less amplifier then the second. These results are quite dependent on proper inter-electrode positioning, the central inter-electrode has to be exactly in the middle of the adjacent ones, and the electrode-skin impedances have to be similar. However, the previously reported studies only used the first configuration for cost reduction in the amplification circuit through the use of fewer components and electrodes.
![Figure 1.1: Block diagram of the system modules and communication pathway for the detected sEMG signals [26].](https://thumb-eu.123doks.com/thumbv2/123dok_br/15709879.1068790/24.892.209.639.430.790/figure-block-diagram-modules-communication-pathway-detected-signals.webp)

![Figure 2.3: Intramuscular and sEMG signal monitoring representation [1]. 2.3a represents the intramuscular EMG, while 2.3b illustrates the same blocks for the sEMG.](https://thumb-eu.123doks.com/thumbv2/123dok_br/15709879.1068790/30.892.134.747.247.491/figure-intramuscular-signal-monitoring-representation-represents-intramuscular-illustrates.webp)
![Figure 2.4: Representation of the three main constituting blocks for EMG recording. These are signal detection (in the electrodes), amplification and conditioning (in the AFE), and analog-to-digital converter (ADC) converter [33].](https://thumb-eu.123doks.com/thumbv2/123dok_br/15709879.1068790/31.892.166.785.815.983/representation-constituting-recording-detection-electrodes-amplification-conditioning-converter.webp)


![Figure 2.8: Removal of PLN from sEMG signal using different digital filters. Top row: raw and filtered signals, bottom row: frequency spectrum [47].](https://thumb-eu.123doks.com/thumbv2/123dok_br/15709879.1068790/39.892.151.788.143.378/figure-removal-different-digital-filters-filtered-frequency-spectrum.webp)