Does further integration lead to greater income
(in)equalities?
Bruno Carvalho
Master Dissertation in Economics
Supervised by:
Ana Paula Ribeiro
Vitor Manuel Carvalho
Vita
Bruno Carvalho started his studies at Faculty of Economics of the University of Porto (FEP) in 2007 and he completed the degree in Economics in 2010. In the same year, and after his enrollment in the Master in Economics in the same institution, he was hired to exert audit functions in the private sector. This dissertation is the final contribution in order to obtain the Master degree.
Acknowledgements
My heartfelt thanks are to my teachers and supervisors Ana Paula Ribeiro and Vitor Manuel Carvalho for their constant dedication and support to this work. They and their advices and motivation were absolutely essential to my learning and constant will to go on with this study.
An also special acknowledgement is to my family for the support and interest on the progress of this work as well as for the encouragement to perform it. Especially to my mother and brother, I’m thankful for the comprehension, attention and help that they, directly or indirectly, provided me with.
Last but not least, I am also very grateful to Patrícia, not only for her comprehension and incentive when I was absent, but also for her support and concern when I was not, but I was working for the development of this dissertation.
Abstract
Throughout the twentieth century, there have been numerous agreements towards commercial and financial integration of various countries and regions around the world. Particularly, in Europe there has been huge progress towards this direction, being already seventeen countries using a common currency – the Euro – under a free trade framework since 1993 and subject to supra-national legal environment regarding tariffs, barriers to entry and other forms of protective devices.
There are several studies on the effects of stronger integration on income inequality. However, the conclusions that result from such analysis are not clear and, sometimes, they are even contradictory.
After a revision of the main theoretical channels through which globalization may affect inequality as well as of the main empirical results, our study focuses on the analysis of the effects of integration on income inequality in ten Euro area countries, for the period 1995-2011. Inequality is measured through three alternative indicators: Gini coefficient, S80/S20 income quintile share ratio and the percentage of people at risk of poverty. By estimating several regressions with unbalanced panel data, we concluded that globalization (as measured by the composite KOF index) reduces inequality in countries structurally more weak. Inequality significantly reacts to the economic dimension of globalization, namely to FDI outflows and fewer restrictions on trade and capital flows. In turn, political dimension KOF index seems to increase inequality in countries structurally stronger. Additionally, we confirm the Kuznets effect between real GDP per
capita and inequality and that unemployment, as well as lower education, contribute to
increase disposable income inequality.
Keywords: Globalization; openness degree; income inequality; unbalanced panel data;
Europe.
Resumo
Ao longo do século XX, verificaram-se inúmeros acordos no sentido da integração comercial e financeira de diversos países e regiões de todo o mundo. Particularmente, na Europa têm existido enormes progressos neste sentido, estando já dezassete países a utilizar uma moeda comum – o Euro – sob padrões de comércio livre desde 1993 e sujeitos a um ambiente legal supranacional no que respeita a tarifas, barreiras à entrada e outras formas de instrumentos de proteção.
Há vários estudos sobre os efeitos de uma mais forte integração nas desigualdades de rendimentos. Contudo, as conclusões que resultam de tal análise não são claras e, por vezes, são mesmo contraditórias.
Depois de uma revisão dos principais canais teóricos através dos quais a globalização pode afetar a desigualdade, bem como dos principais resultados empíricos, o nosso estudo centra-se na análise dos efeitos da integração europeia sobre a desigualdade de rendimentos em dez países da zona Euro, para o período de 1995 a 2011. A desigualdade é medida através de três indicadores alternativos: o coeficiente de Gini, o rácio entre os quintis de rendimentos S80/S20 e a percentagem de pessoas em risco de pobreza. Através da estimação de diversas regressões com dados em painel não balanceados, concluímos que a globalização (medida pelo índice compósito KOF) reduz a desigualdade nos países estruturalmente mais debilitados. A desigualdade reage particularmente à dimensão económica da globalização, através do investimento direto estrangeiro no exterior e da redução das restrições internacionais ao comércio e aos fluxos de capital. Por outro lado, a dimensão política do índice KOF parece influenciar positivamente a desigualdade nos países estruturalmente mais fortes. Adicionalmente, concluímos pela validação do efeito Kuznets entre PIB per capita e desigualdade e que a taxa de desemprego, bem como menores níveis de educação, contribuem para o aumento da desigualdade no rendimento disponível.
Palavras-chave: Globalização; grau de abertura; desigualdade de rendimentos; dados
em painel não balanceados; Europa.
Table of Contents
Vita ... i Acknowledgements ... ii Abstract ... iii Resumo ... iv Table of Contents ... vList of Tables ... vii
List of Figures ... viii
Abbreviations ... ix
Introduction ... 1
1. Globalization and inequality – a literature review ... 4
1.1. The Foreign Direct Investment (FDI) channel ... 6
1.2. The degree of Openness channel ... 8
1.3. The role of initial endowments ... 11
1.4. Political and social dimensions of globalization ... 13
2. Uncovering the relationship between globalization and inequality in the Euro area – a tentative analysis ... 18
3. Assessment of the relationship between globalization and inequality in the Euro area – a panel data approach ... 25
3.1. Methodology and data ... 25
3.2. Analysis of results ... 30
4. Conclusions ... 44
References ... 47
Data Sources ... 50
Annexes ... 51
Annex A – Globalization indexes composition ... 51
Annex B – FDI outflows, average values 1995-2011 ... 55
Annex D - General descriptive statistics ... 59 Annex E – Correlations between explanatory variables ... 60
List of Tables
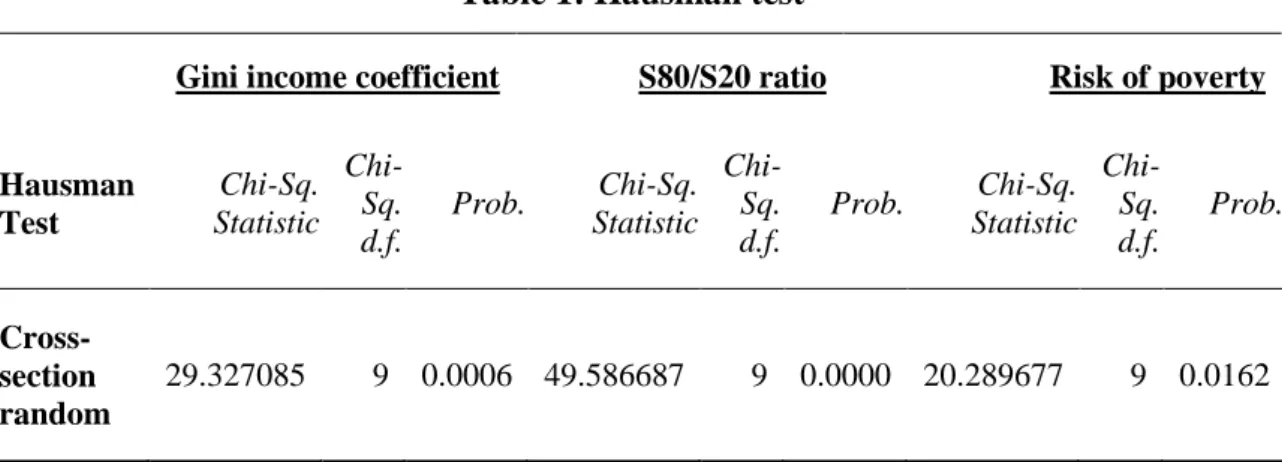
Table 1: Hausman test ... 29
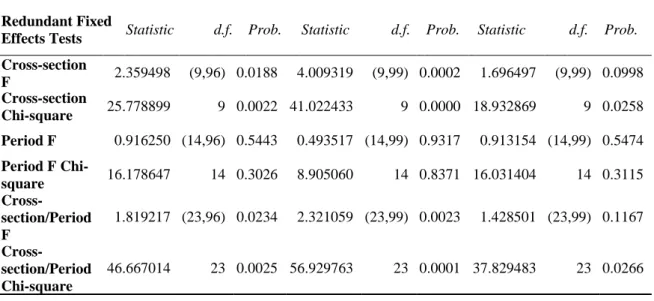
Table 2: Test for cross-section and period fixed effects ... 30
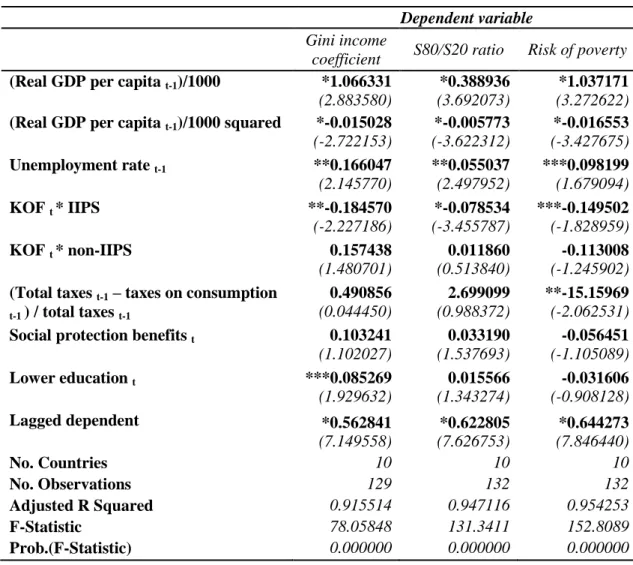
Table 3: Base model estimation results ... 31
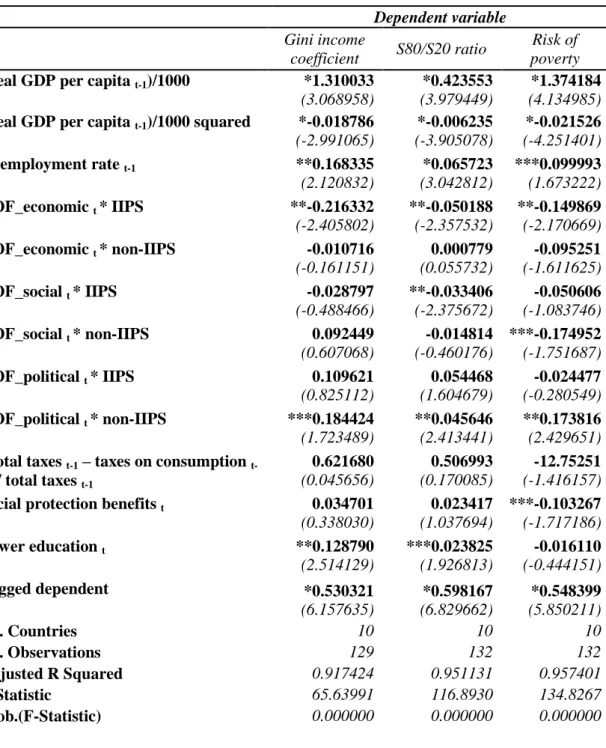
Table 4: Estimation with each dimension of KOF index ... 34
Table 5: Estimation with openness degree explanatory variable ... 36
Table 6: Estimation with FDI inflows ... 38
Table 7: Estimation with FDI outflows ... 40
Table 8: Estimation with restrictions to economic globalization ... 42
Table A.1: 2013 KOF Index of Globalization ... 51
Table A.2: Composition of the EFW Index ... 52
Table A.3: Composition of MGI ... 53
Table A.4: Composition of KGI (Kearney Globalization Index) ... 54
List of Figures
Figure 1: Openness degree and Gini coefficient, average values 1995-2011 ... 19 Figure 2: Openness degree and Gini coefficient, average values 1995-2011 (excluding Luxembourg) ... 20 Figure 3: Openness degree and S80/S20 income quintile ratio, average values 1995-2011 ... 21 Figure 4: Openness degree and the percentage of population at risk of poverty, average values 1995-2011 ... 21 Figure 5: FDI inflows and Gini coefficient, average values 1995-2011 ... 22 Figure 6: FDI inflows and S80/S20 income quintile ratio, average values 1995-2011 .. 23 Figure 7: FDI inflows and the percentage of population at risk of poverty, average values 1995-2011 ... 24 Figure B.1: FDI outflows and Gini coefficient, average values 1995-2011 ... 55 Figure B.2: FDI outflows and S80/S20 income quintile ratio, average values 1995-2011 ... 55 Figure B.3: FDI outflows and the percentage of population at risk of poverty, average values, 1995-2011 ... 56 Figure C.1: KOF index and Gini coefficient, average values 1995-2010 ... 57 Figure C.2: KOF index and S80/S20 income quintile ratio, average values 1995-2010 57 Figure C.3: KOF index and the percentage of population at risk of poverty, average values 1995-2010 ... 58
Abbreviations
ECBEEC EU
European Central Bank
European Economic Community European Union
FDI Foreign Direct Investment GDP Gross Domestic Product
IIPS Ireland, Italy, Portugal and Spain IMF International Monetary Fund
OECD Organisation for Economic Co-operation and Development SEA Single European Act
SSA Sub-Saharan Africa U.S. United States of America
Introduction
The deep integration verified over the past few decades has been the subject of much research in order to apprehend its effects on both developed and developing countries. Indeed, trade liberalization (goods and services), free movement of people as well as free capital flows (all freedoms established in 1993 for the European Union (EU) countries even though the beginning of this process dates back to 1957 with the Treaty of Rome) may have a significant impact on countries development and becomes of increasing interest to understand their effects on welfare, i.e., how does welfare change as countries take part in international economic environment. One particular aspect of welfare assessment is related to income distribution, both within as well as between countries, which has evolved alongside the liberalization process. Despite all efforts already done to explain the impact of globalization on income distribution in several regions of the world, conclusions are ambiguous and even contradictory.
The recent economic history in Europe provides a good context to evaluate the impacts of increasing integration on income inequality. The several treaties agreed on throughout the history of European Union came to provide new opportunities and challenges to the member states. The Treaty of Rome, signed in 1957 by Belgium, the Netherlands, Luxembourg, France, West Germany and Italy, created the European Economic Community (EEC), which established the progressive reduction of custom duties and proposed the creation of a customs union. In the following years several European countries have joined the EEC: Denmark, Ireland and the United Kingdom in 1973, Greece in 1981, Portugal and Spain in 1986. The year of 1986 also marks the first major revision of the Treaty of Rome, the Single European Act (SEA). The SEA established a clear objective for the EEC, which was to create a single market by 31 December 1992, characterized by a free trade area for goods and services and freedom of movement of the factors of production (labor and capital). A second major revision of the Treaty of Rome was, in 1992, the Treaty of Maastricht, which established the rules for the implementation of a single currency. This treaty, formally the Treaty on European Union, also established the European Union (EU) under its current name. The inception of free capital flows occurred in 1993, two years before a new EU enlargement to include Austria, Finland and Sweden. The last years of the XX century as well as the early ones of the new millennium were marked by the adoption of the euro in 1999 (with the exception of Denmark, Sweden, the United Kingdom and
Greece) and by the biggest EU enlargement to include countries from Central and Eastern Europe in 2004 (Cyprus, Czech Republic, Estonia, Latvia, Lithuania, Hungary, Malta, Poland, Slovenia and Slovakia). The last extensions took place in 2007, with the inclusion of Bulgaria and Romania, and in July 2013, with the membership of Croatia. After that, the world was hit by the financial crisis that started in the United States, due to the mortgage loans, in 2008. Apparently, the crisis uncovered strong external and public debt disequilibria, and opposed the wealthier countries against the remaining ones, namely on the design of multilateral supports from the former - together with the International Monetary Fund (IMF) and the European Central Bank (ECB) - to the latter (Greece, Ireland, Portugal, Spain and Cyprus).
On the one hand, integration created new opportunities for each country to start trade with another member state without additional costs allowing it to achieve new markets, before unattainable because of costs, such as tariff barriers – an opportunity linked to comparative advantages. On the other hand, a country that, before liberalization, was producing and selling one good in which it has no comparative advantage, because it was protected by tariff rates, faces, after liberalization, the challenge to improve its productivity in order to maintain its production patterns and employment levels. In this context, it becomes pertinent to assess whether this growing globalizing path has contributed to a stronger and cooperative Europe by reducing income inequalities both between and within countries or if it has, instead, contributed to enlarge them.
Recent trends in income inequality in Europe, measured by the changes in the Gini coefficient, evidence different performances over the last decades. OECD (2011) finds that, from mid-1980s to late-2000s, there are opposite paths followed by EU countries. Throughout this period of increasing integration, the Gini coefficient has risen, for example, in the Nordic countries (Sweden and Finland), United Kingdom and some other North and Central Europe countries, such as the Netherlands, Denmark, Germany, Luxembourg or Austria. On the contrary, France, Hungary and Greece experienced a decrease in the Gini coefficient. To what extent are these different paths driven by growing integration and globalization in Europe?
In this dissertation we intent to survey the main mechanisms through which integration and globalization may impinge on within-country income inequality distribution. We also intend to review the main empirical results in support (or not) for the theoretical mechanisms through which globalization transmits to income inequality.
Moreover, this study aims to contribute to the existing literature through testing and assessing how strong, and through which channels, the integration of European countries has shaped the distribution of disposable income within each country. Using a sample of ten Euro area countries and covering the period 1995 to 2011, we estimate the impacts of several dimensions of globalization (economic, social and political) on three alternative inequality measures: the Gini coefficient, the S80/S20 ratio and the percentage of population at risk of poverty.
In the following section we provide a literature review of the main studies undertaken to date on this subject, detailing their main outcomes, sample and methodology. In section 2 we provide a descriptive analysis on the evolution of cross-country indicators of globalization and income inequality for the European countries. In section 3, we proceed with the description of the methodology, as well as the definition of the main variables and data sources. Also in this section, we perform a detailed analysis of results. Finally, concluding remarks will be summarized in section 4.
1. Globalization and inequality – a literature review
The constant process in order to liberalize commercial and financial operations around the world has been a subject for many analyses that aim at ascertaining its consequences on the distribution of incomes both across and within regions/countries.
Globalization has several dimensions. It was formerly, and still usually is, identified with free trade across regions (Crafts, 2004; Kremer and Maskin, 2006; Gourdon et al., 2008; Dobson and Ramlogan, 2009; and Hellier and Chusseau, 2010). Its measurement relies on trade openness or Foreign Direct Investment (FDI) indicators, such as the “openness degree”, the “net FDI inflow/gross fixed capital formation” ratio, “per capita FDI” or “FDI in percentage of Gross Domestic Product (GDP)”. From goods and services (GS) liberalization, globalization was further extended to include also financial liberalization (Banerjee and Nag, 2011). In particular, financial integration is assessed through indicators such as the differentials in the returns to domestic and foreign capital or in the inflation rates. More recently, globalization has evolved towards a more comprehensive definition that goes beyond the economic dimension, also referring to political and social aspects (Baliamoune-Lutz, 2006; Lee, 2006; Milanovic et al., 2007; Wan et al., 2007; Dreher and Gaston, 2008; Barlow et al., 2009; Bergh and Nilsson, 2010; Zhou et al., 2011, and Chordokrak and Chintrakarn, 2011). These aspects are captured by indicators like the number of embassies in a country, membership in international organizations, foreign population in percentage of total population, per
capita internet hosts, the share of internet users in total population or the per capita
number of McDonald’s restaurants.
Starting at bridging the gap between ancient and present incomes and life expectancies inequalities, Milanovic et al. (2007) applies inequality possibility frontier and inequality extraction ratio measures to assess the relationship between ancient and present incomes and life expectancies inequalities in fourteen pre-industrial societies from 14 to 1947. The first measure refers to the maximum attainable income inequality (compatible with the grouped data from social tables and assuming that any individual from a higher social class is richer than any individual from a lower social class) and is related to the possibility, and its extent, of the landless and rural poor people of being exploited by the landed and richest ones, given the incomes distribution between social classes. As for the inequality extraction ratio refers to the actual verified income inequality in
proportion of its maximum attainable. Countries more unequal and facing racial discrimination, tribal power or regional dualism, are expected to exploit much more the maximum potential inequality when they are richer (sometimes through corruption), which becomes more likely to occur when they follow an industrialization path or by adopting a strategy oriented towards greater openness and integration. So, when their
per capita gross domestic income raises, their potential inequality also increases;
assuming a constant Gini coefficient, the inequality extraction ratio falls. This implies that current pre-industrial societies, which did not become richer, exhibit Gini coefficients close to those of the ancient pre-industrial societies. Since the authors’ estimates show that inequality extraction ratio is now smaller than before, they conclude that ancient pre-industrial societies (though their income inequality would be similar to the present pre-industrial societies) explored much more their maximum potential inequality. Thus, despite the development and globalization process observed throughout all these centuries, income inequalities perceived in pre-industrial societies have exhibited a stable path in the very long run (Milanovic et al., 2007). In addition, and according to the authors, the recent developments in order to cure diseases that have been responsible for many deaths in the past centuries, especially in African countries, as well as their worldwide diffusion, have strongly contributed to the convergence of life expectancies over the world, thereby decreasing inequalities in this domain.
Recent historical evidence shows that further integration, fostered by deepening globalization, is associated with the fall in transport and communication costs which has made international production more concentrated in more productive regions (often those exhibiting comparative advantages) while leaving out of this integration process the less productive economies (Crafts, 2004). The post-World War II period was marked by a rapid and sustained economic growth up until 1971 for the developed countries, supported by free trade promotion, stability of exchange rates sought with the establishment of Bretton Woods system (U.S. dollar tied to gold and all other currencies of the system’s member countries pegged to the dollar), institution of the Marshall Plan to rebuild and modernize Western Europe and the adoption of Keynesian economics, essentially low nominal interest rates and low inflation to control and reduce public debt. However, the collapse of Bretton Woods system in the early years of 1970s, the oil crisis in 1973 and the stock market crash in 1973-1974 came to break the long boom, as it is also known. Since East Asian countries, and mainly China, also experienced a
notable economic growth in the last two decades of twentieth century (Wan et al., 2007), global income inequality across countries verified, after these shocks, a small decline. Through a descriptive analysis, based on relevant historical publications and data, between 1820 and 1999, Crafts (2004) infers that trade liberalization widened income inequality across countries and that world income inequality peaked during the 1970s.
Relying on data on a composite index of globalization, the KOF index (covering both economic, as well as social and political dimensions of globalization), Villaverde and Maza (2011) concluded for the presence of relative convergence of globalization across countries: using a sample of 101 countries and comprising the period 1970-2005, they found that less globalized countries evolved at a faster rate to higher globalization standards. Moreover, they find evidence that globalization fosters per capita income growth and for convergence of income per capita across countries. Thus, given relative convergence of globalization and growth, the authors conclude that globalization, indirectly, promote income convergence.
Besides inequality between regions and countries also within-country inequality has been intensively investigated in order to assess the inequality effects of globalization. Several mechanisms have been explored and tested in the relevant literature regarding the relationship between globalization and within-country inequality. In what follows, we will focus, in particular, on the impacts of globalization on income inequality.
1.1. The Foreign Direct Investment (FDI) channel
FDI is expected to significantly increase income inequality, not by reducing the income of the lower-income groups but rather by increasing the income of people in higher-income layers. This results because FDI introduces skill-biased technology which increases the demand for skilled relative to non-skilled labor in the host country (Alderson and Nielsen, 2002; Lee, 2006; Dreher and Gaston, 2008; Gourdon et al., 2008; Chordokrak and Chintrakarn, 2011; and Banerjee and Nag, 2011).
Lee (2006), studying the impact of globalization on income inequality in fourteen European Union (EU) member states, over the period 1951-1992, estimates, using pooled GLS, the impact of FDI and trade (together with control variables such as the
demographic and employment structure, education and tax levels) on income inequality. Similar to Crafts (2004), Lee (2006) concludes that most of the European countries in the sample have passed the Kuznets inverted U-shaped curve1 turning point in the 1960s or 1970s, the period in which inequality within and across countries was highest. He also concludes that FDI has increased income inequality for this sample of countries. Along its growth path, each country looked for liberalization through trade openness and investment but FDI raised the relative demand for skilled labor and increased income inequalities within each country. However, the period in which growth was accompanied by increasing inequality along the Kuznets curve has stopped and now, as
per capita GDP grows more equity can be attained and a downward trend in the
Kuznets curve becomes visible.
At the same time, FDI is correlated with technological advances (Baliamoune-Lutz, 2006), and this may raise the productivity of the skilled workers faction, further widening the income gap relative to non-skilled. Evidence for the U.S., covering the period 1988-2003, is provided by Chordokrak and Chintrakarn (2011). Although they do not find a clear result that technology has influenced income inequality in the U.S., they remark that the number of employees in foreign affiliates as percentage of country overall employment increases income inequality. Thus, globalization through FDI enables an increase on the wages of the skilled workers, both through the increase in their relative demand and in productivity, enlarging income inequality within a country. Still with regard to Kuznets curve hypothesis, globalization seems, in recent years, to have modified the pattern conjectured by Kuznets in the 1950s: after the decline in inequality observed once the turning point of GDP per capita is achieved, it has been observed, in many cases, an inverted trend towards an increase on inequality after a certain level of industrial development is reached – “the great U-turn” from the Alderson and Nielsen (2002)’s study. Such behavior might be explained, instead, by FDI outflows. FDI outflows appear to shift labor resources (workers) from the industrial sector to the services sector, which entails a pronounced change on average wages levels, as services sector is typically cheaper (in terms of labor costs) than industry, as well as a modification on the income distribution, whereas the industrial sector exhibits a smoother one comparatively to that of the services sector (Alderson and Nielsen,
1 According to Kuznets hypothesis, a country experiences an increase in inequality until a certain level of
2002); thus, FDI outflows induce a raise in income inequality. Furthermore, it may strengthen multinational firms’ ability to reduce wages, taking into account the enlargement of the labor supply due to internationalization. Yet, given that FDI outflows move capital abroad, labor becomes less productive than capital and wages decrease. Additionally, since FDI outflows typically tend to re-allocate low-skilled tasks to countries with lower labor costs, domestic demand for low-skilled workers is reduced and wage inequality rises. Performing a study encompassing sixteen OECD countries for the period 1967-1992, Alderson and Nielsen (2002) show, accordingly, evidence for an inverted trend in the Kuznets’ inverted U-shaped curve. This argument mostly applies to high-income (high-developed) countries that apply savings to reallocate production at the bottom of the value added chain.
Focusing on an alternative independent variable, on income net of taxes and contributions and including all types of income redistribution, i.e., disposable income, Mahler (2004) finds out, for fourteen developed countries (Australia, Austria, Belgium, Canada, Denmark, Finland, France, Germany, Italy, the Netherlands, Norway, Sweden, the United Kingdom and the United States), between 1980 and 2000, no evidence of that FDI outflows through their effects on labor markets, as described above, influence income distribution. He bases his study on Luxembourg Income Study data on inequality to obtain a strong measure and comparability of earnings and disposable income.
1.2. The degree of Openness channel
As trade helps countries to improve their methods and productivity, inequality between countries is expected to decrease with the degree of openness. So, when countries expand the labor-intensive agricultural sector to increase employment levels (due to pressures from trade openness), tend to invest in human capital (to become more competitive) and their governments engage in redistributive measures (not being corrupt), they are on an equality-enhancing path. Nevertheless, greater openness exposes countries to higher inflation, due to price liberalization whereby governments enforce price deregulation and subsidy reduction policies (Dobson and Ramlogan, 2009; Barlow et al., 2009), and that may affect real wages. It also seems that higher openness of low-income developing countries has shifted the comparative advantage of
middle-income countries in Latin America from low-skill labor intensity goods towards those with intermediate-skill labor intensity (Dobson and Ramlogan, 2009). This occurred when low-income Asian countries entered in the international markets, during the 1980s, which allowed those countries to expand their exports in goods with low-skill intensity when Latin American countries were experiencing greater openness (Wood, 1997).
Using a sample of twenty transition economies of Central and Eastern Europe and the Commonwealth of Independent States, from 1990 to 2004, Barlow et al. (2009) found that, with price liberalization, and privatization self-employment and entrepreneurial activity, incomes can be higher, though only for those which have monetary means to ensure their access to the assets market. Moreover, inflation increases because wage rates are correlated to productivity and higher skill premium, and the private sector magnifies the impacts of liberalization on prices, as price regulation and subsidies are reduced. This erodes real wages, harming relatively more the poorer (as also indicated by Dobson and Ramlogan, 2009). Thus, inequality is higher the higher is liberalization and globalization as they negatively (positively) affect low-income (wealthier) individuals. For a sample with eighteen Latin American countries, covering the period 1982-2000, Dobson and Ramlogan (2009) test for a Kuznets curve between inequality and trade openness, given that these concepts have been associated in the literature and their link has been object of many studies. They find a curvilinear relationship between trade liberalization and income inequality in Latin America, wherein income inequality increases until a certain level of openness is reached and after which it begins to fall. Furthermore, the increased integration of national economies in world markets, through liberalization of trade and finance, can also affect gender inequality within countries. Since women in less developed countries work mainly in the agricultural sector, they are likely to benefit less from the positive effects of higher trade openness in their countries, because the increase in competitiveness in industry and the consequent reduction on the “employers’ ability to discriminate against women in concentrated
industries” (Baliamoune-Lutz, 2006: page 302 referring Becker, 1957). Being
especially small farmers, they cannot take advantage of new markets because they cannot access to credit, new technologies or market know-how. Baliamoune-Lutz (2006) explores whether globalization and growth affect gender inequality in Sub-Saharan Africa (SSA) countries and if that effect differs from that in other developing
countries. The study relies on a sample with thirty SSA countries and thirty two non-SSA developing countries, for the period 1990-1999. The author bases the gender inequality on unequal access to skills and competencies and concludes that higher openness and growth have a positive effect on gender inequality in SSA countries while in the non-SSA they appear non-significant. Thus, SSA countries seem to evidence a higher gender inequality in access to education amongst the labor force, since women continue to be discriminated among employees and the higher demand for unskilled labor (allowed by the higher trade openness) is not achieved by them. So, they remain small farmers (most of them) and female literacy rates remain low.
However, liberalization in developing countries is often linked to agricultural trade liberalization and this allows “farmers to take advantage of higher world prices” (Banerjee and Nag, 2011: page 585). Thus, the wage rate of unskilled workers rises,
“whereas rent on domestic capital and foreign capital remains unchanged” (Banerjee
and Nag, 2011: page 585). Also, the volume of skilled employment (and the respective production) is not affected. In this case, the wage gap between skilled and unskilled workers is expected to decrease (Banerjee and Nag, 2011). However, this mechanism, based on agricultural trade liberalization, lacks empirical evidence.
Barlow et al. (2009) argue that since globalization exposes countries to a more competitive market, considering jointly price liberalization, privatization and trade openness (the latter mainly through exports) it is observed that employers distribute the gains associated to exports more evenly between owners and workers (as a consequence of the competition between employers for the attempt to enlist the workers who are more skilled – efficiency-wage argument), thus reducing inequality.
However, opposite effects can also occur. Andersen and SØrensen (2011) argue that
when the process of product market integration begins and protection rents (barriers to entry) are increasingly eliminated, increased competitiveness pressures wage inequality down, promoting more efficiency and lower income inequality within country; but, in a more advanced stage of integration, it favors specialized rents (obtained through comparative advantages) and less competitive firms are driven out of the market. This latter effect occurs because, when trade frictions are already small, lower prices remain amongst the non-tradable products and wages must fall because of take-overs threat from foreign firms – in de-regulated markets, it is easier for foreign firms to penetrate into the domestic market and acquire a market share. In turn, the higher productivity of
export-oriented firms allows greater profits and higher wages and, thus, the wage gap between skilled and unskilled labor increases. Since, initially, income convergence is attained (by the reduction of protection rents) and as integration becomes deeper higher incomes are achievable, the relation between product market integration and inequality is U-shaped. It is worth to note that Andersen and SØrensen (2011) reach these
outcomes under several assumptions, such as Bertrand competition, constant returns to scale, perfect substitutes, log normally distributed productivity, and modeling two countries each with two parts – the home part (perfectly competitive, not directly affected by product market integration and commodity is not traded) and the globalized part (directly affected by product market integration) - , but no empirical evidence is provided for validation of these mechanisms.
Linked with this product market integration is the phenomenon of migration. Usually, immigrant labor force in the relatively richer countries is “characterized by low average
skills and high skills variance” (Alderson and Nielsen, 2002: page 1256). This
movement may, thus, threaten the unskilled workers wages’ stability in the host countries, as it exerts an influence towards wage reduction through the increase in labor supply and the reduction in average skills; immigration also introduces a higher heterogeneity of skills on these countries, contributing to increase inequality. On the contrary, the poor countries, exporters of low-skilled labor force, experience a decline in inequality due to a reduced pressure from labor supply. Evidence of such impacts is found, mainly during the 1980s, by Alderson and Nielsen (2002), when studying the effects of mass-migration in OECD countries.
1.3. The role of initial endowments
Besides the impacts resulting from trade liberalization and changes in FDI, country endowments may also play a major role on income inequalities within countries (Gourdon et al., 2008). On the one hand, the less developed countries are, in most cases, endowed with a large fraction of low-educated labor force, i.e., workers without complete primary or elementary education. Thus, they are expected to remain confined to non-tradable activities and low wages while the few highly skilled workers in these countries see their wages increase as globalization proceeds, which entails an inequality increase. On the other hand, countries endowed with a larger share of skilled labor,
often more developed countries, exhibit a large portion of land and capital concentrated in few people. Since their rents tend also to increase with trade liberalization, by the increase of their demand as a result of accentuated levels of FDI, only the richest increase their incomes and thus income inequality also increases. Gourdon et al. (2008) find these results through a fixed effects model in order to reduce the need to explain differences resulting from omitted variables, for a sample with sixty one countries, including nations from all continents, for the period 1980 to 2000.
In theory, a country is able to increase its production share through trade openness – because it enables capturing the production of new goods over time, globalization displaces the frontier of production between countries (Hellier and Chusseau, 2010) and cross-border production easily occurs. Thus, globalization enables foreign workers to join national workers in the same firm (Kremer and Maskin, 2006). While a country increases its production share, assuming constant technologies and, thus, worldwide global production, the other countries have to adjust themselves to a reduced production share through three possible ways (Hellier and Chusseau, 2010). The first consists in an increase of the skill premium (factor prices), which will be higher in inequality-biased countries because they have to do a stronger effort to enhance their skills in order to ascend in the scale of skill intensities and to move to specialization, to ensure full employment while maintaining their endowments in skilled and unskilled employment constant. Thus, countries relatively more unskilled, more unequal too, as they have cost advantages in low-skilled goods, their skill premium is higher than that in skilled countries – this is derived by the authors using a theoretical model. More unequal countries will experience an (higher than other countries) increase in inequality from globalization. A second way to adjust is based on the acceptance of substantial unemployment of unskilled workers, while abdicating of the skill premium so as to prevent the rise in inequality. In fact, the move to specialization consists in ascending in the scale of skill intensities and when a country captures a production share of another it captures the production of its lowest-skilled intensity goods. The last option, revealed by Hellier and Chusseau (2010)’s model, is related with the increase of the relative skill endowment which will be higher the lower the initial skill level is because of the specialization scale already referred. Hence, initially inequality-biased countries will get even more unequal. There is an inequality-unemployment trade-off. However, in countries initially more egalitarian, i.e., that display higher levels of redistribution and
social intervention before the onset of globalization (as in the case of Scandinavian countries), a small increase in its relative skill endowment will be enough to adjust to globalization without increase neither unemployment nor skill premium. Thus, these countries face a lower inequality-unemployment trade-off than inequality-biased countries.
Thereby, through the development of their model and under the assumptions of a continuum of goods, no technical progress, skilled and unskilled labor as the only inputs, a high-skilled labor market competitive, i.e., it is at full employment and that unskilled labor wage is determined by a minimum wage or a centralized bargaining, Hellier and Chusseau (2010) find that globalization constraints in terms of inequality-unemployment trade-off differ across countries and depend on their initial endowments. Both these results and those from Gourdon et al. (2008) emphasize initial endowments as relevant for the impacts of globalization on within-country income inequality.
1.4. Political and social dimensions of globalization
With the deepening of globalization and countries’ possibility to homogenize their internal policies, it is to expect that social aspects (for instance, the increase in international tourism, travel or technological connection by internet) are not of widespread benefits accruing to unskilled workers in developing countries, negatively affecting inequality; additionally, a large government makes more public consumption and transfers than a smaller one, reducing inequality (Bergh and Nilsson, 2010). Likewise, we can think in government policies in democratic states that can be more market-oriented policies rather than towards redistributive targets – a shift towards the former may increase inequality (Dreher and Gaston, 2008). In turn, privatization, boosted by the reduction of government intervention on economy and the adoption of market-oriented policies, has a positive impact on income inequality, because the search for efficiency and profit maximization will redirect the labor supply for skilled workers (in substitution of the less skilled), increasing their wages and market prices relative to the other groups (Dobson and Ramlogan, 2009).
Villaverde and Maza (2011), using data for 101 countries taken from the KOF website, conclude that dispersion in total and economic globalization indexes remained rather stable up until mid-1980s while afterwards (and up to 2005) it fell steady. As for social
globalization, disparities across countries have increased and, after a sudden fall, in 1991, have remained fairly stable. In regards to political globalization, dispersion fell strongly during the 1970s and remained stable afterwards. Still, the social and political globalization dimensions appear with more scattered indicators across countries, revealing a higher disparity between them than that observed for the economic dimension of globalization. Furthermore, and besides the relative convergence in the total globalization index, Villaverde and Maza (2011) also find similar evidence for the three sub-indexes: in particular, they find higher speed of convergence of the political measure.
Collecting several results from many studies, Clark et al. (2011) find that FDI entails an increase in income inequality. However, it may reduce poverty if its highest flows associated with globalization were accompanied by an active action by governments proceeding redistribution measures and searching highest competitive markets both through transfers or subsidies and labor market policies. Alike, Nissanke and Thorbecke (2006) find, in this debate about globalization and poverty, an important role taken by governments in order to do not accept passively the globalization process and the importance to undertake policies “to strengthen institutions of social protection”. Considering and understanding, likewise, that globalization goes beyond economic aspects, Gunter and Hoeven (2004) gather results from numerous studies to conclude for a consensus that indicate the need for a more active role of the national governments in order to provide public goods and social protection to reduce risks and uncertainty, resulting from the greater international volatility brought to trade, investment and production, that affect markets and people.
Thus, and following the development of globalization concept, it is worth considering, additionally, how political and social aspects of globalization impinge on income distribution. These aspects of globalization are usually captured by composite indexes such as the KOF Globalization Index, the Economic Freedom of the World Index (EFW), the Maastricht Globalization Index (MGI) or the Kearney Globalization Index (KGI).
According to Marginean and Orastean (2011), the first composite index of globalization was introduced by Dreher, in 2002, in an attempt to merge economic, social and political dimensions of globalization. The author uses three sub-indexes to include data
on economic integration, on political engagement and on social globalization (Dreher, 2006), using several indicators, and their respective weights in each sub-index, as described in Table A.1 in Annex A.
EFW is an index regularly published by the Fraser Institute, since 1974, and it measures contribution of policies and institutions to economic freedom (Stein and Tommasi, 2007). It includes indicators on the size of government, legal system and property rights, sound money, freedom to trade internationally and regulation as major areas which are subdivided as detailed on Table A.2 in Annex A.
The MGI was developed by Martens and Zywietz (2006), and Martens and Raza (2009) (cited by Dreher et al., 2010: page 167) to measure economic, political, social and cultural, technological and ecological dimensions of globalization. Each category is also decomposed in several variables which are shown in Table A.3 in Annex A.
Finally, the KGI, was proposed by the consulting firm A.T. Kearney, Inc. to assess economic integration, personal contact, technological connectivity and political engagement (Zhou et al., 2011) and it results from a weighted average of various variables included in the indexes already presented (see Table A.4 in Annex A for more detail).
Berg and Nilsson (2010) use the KOF and EFW indexes to measure globalization and to assess how the different dimensions are able to influence income distribution. They use data for seventy nine countries from all continents between 1970 and 2005, and found that within-country inequality increases, mainly in developed countries, when trade is liberalized and deregulated. Furthermore, they conclude that social globalization, related to technological services and interaction among countries taking part on the integration process, is practically unachievable by unskilled workers in developing countries, raising inequality in those economies; moreover, they found evidence for that a smaller government tends to increase inequality in developed countries as they tend neither to enforce redistributive measures nor to make public consumption expenditure as much as larger governments do. Dreher and Gaston (2008) use the KOF index to address the impact of globalization on industrial wage and household income inequality of developed and developing countries. By using a sample encompassing twenty seven OECD countries and seventy four non-OECD countries from all regions of the world, over a similar period, 1970-2000, they observe that an increase in democracy has led to
market-oriented reforms that made inequality increase in the OECD countries while no robust evidence of that is found in the less-developed economies. In a similar study, results in Zhou et al. (2011) provide no evidence that social and political factors have contributed to increase income within-country inequality, using a sample with sixty countries in the Kearney database (2002, 2003 and 2004 as appointed by the authors) and covering the period 1950-2001. On the contrary, the estimates reveal that higher levels for travel and tourism (as measured by “(Tourist arrivals + Tourist
departures)/Population ratio)” and internet users (in percentage of total population) are
able to negatively influence the Gini coefficient within each country.
Another assessment of inequality relies on the analysis of regional income inequalities within a country. This is likely to occur with higher frequency in large countries in which there are several regions more developed than others and more able to access and exploit resources. Regions near from seaports and trading with other developed regions or countries have the ability to attract more FDI and capital and develop their regional economy. The remarkable growth of China in the two last decades of twentieth century due to export deregulation and the abolishment of tariffs, licenses and quotas to imports that have promoted a significant increase in its international trade, provides a good example. According to Wan et al. (2007), since China’s internationalization process has been transversal to all regions, urbanization has followed a convergence trend across China, which contributes to decrease regional income inequality. This effect was reinforced by the development of transports and communication networks, by the public provision of basic education and by a policy of birth control implemented by China´s governments. However, given that east China is more developed than central and west, it is likely to attract “much more FDI and trade” and capital than the other regions (Wan et al., 2007: page 39). East China is able to better exploit benefits from trade (trading with other developed regions), and its spillovers, and it is better endowed with resources. Because of that, also privatizations are more likely to occur in this region. Thus, different regions have different paces of globalization and these last variables, location and privatization, contribute to accentuate their income inequalities (between regions). Through an analysis over the period 1987-2001 for twenty nine regions of China, Wan et al. (2007) conclude for a positive and increasing contribution of trade, domestic capital and privatization to increase regional inequality. The FDI inflows have also contributed to increase regional inequality, but at a slower path. Relative
contribution of government support has remained stable along this period, while the effects of the other variables on regional inequality, such as dependency ratio, education, location and urbanization have decreased, as related above.
2. Uncovering the relationship between globalization and
inequality in the Euro area – a tentative analysis
In this section we present a brief descriptive analysis on the evolution of cross-country indicators of globalization and income inequality for the Euro area countries. Because some actual members of the Euro area have just recently joined it (Slovenia in 2007, Cyprus and Malta in 2008, Slovakia in 2009, Estonia in 2011), and their integration processes are not as consolidated as those for the remaining countries, they are not addressed in this study. Due to data restrictions we also exclude Greece, which joined in 2001, in order not to bias our outcomes. So, the group of countries covered in this study encompasses those countries which joined to Euro area in 1999: Austria, Belgium, Finland, France, Germany, Ireland, Italy, Luxembourg, the Netherlands, Portugal and Spain.
Relying on the vast existing literature, one can define some globalization and income inequality indicators. Among the former, we devote our attention to the openness degree, the FDI and the KOF index of globalization already outlined in the previous section, while in the case of the latter we focus on the income Gini coefficient2, the S80/S20 income quintile ratio and the percentage of total population at risk of poverty after social transfers.3 All of data for these variables were extracted from Eurostat4, with the exception of the data for KOF index of globalization, whose data were obtained at http://globalization.kof.ethz.ch/ in May 2013.
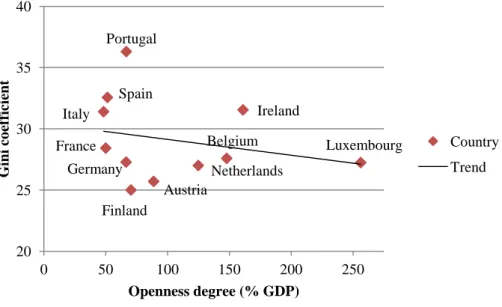
Figure 1 shows the relation between the Gini coefficient and the openness degree (as measured by the sum of exports and imports in percentage of GDP). In line with the results and conclusions obtained in former research - an ambiguous and even
2 Gini coefficient of equivalised disposable income - as described by the Eurostat, the total disposable
household income is equivalised “to take into account the impact of differences in household size and composition” (at http://epp.eurostat.ec.europa.eu/cache/ITY_SDDS/EN/ilc_esms.htm, accessed in February 2013). “The equivalised income attributed to each member of the household is calculated by dividing the total disposable income of the household by the equivalisation factor. Equivalisation factors can be determined in various ways. Eurostat applies an equivalisation factor calculated according to the OECD-modified scale first proposed in 1994 - which gives a weight of 1.0 to the first person aged 14 or more, a weight of 0.5 to other persons aged 14 or more and a weight of 0.3 to persons aged 0-13” (as defined by Eurostat at http://epp.eurostat.ec.europa.eu/cache/ITY_SDDS/EN/ilc_esms.htm accessed in February 2013).
3
Eurostat sets that the “persons are at risk of poverty if their equivalised disposable income is below the risk-of-poverty threshold, which is set at 60 % of the national median equivalised disposable income after social transfers” (at http://epp.eurostat.ec.europa.eu/cache/ITY_SDDS/EN/t2020_52_esmsip.htm, accessed in February 2013).
4
contradictory relationship between the two variables -, we find, for the period 1995-2011, a slight negative relationship between average Gini coefficient and average openness degree.
Figure 1: Openness degree and Gini coefficient, average values 1995-2011
Data Source: Own calculation based on data from Eurostat, accessed in February 2013 at
http://epp.eurostat.ec.europa.eu/portal/page/portal/statistics/themes
The average level of the openness degree varies between 48.29 and 256.28 of GDP, for Italy and Luxembourg, respectively. However, the latter is clearly an outsider because of its narrow borders and where most of the workforce is composed by foreign workers. Even if Luxembourg is left out of the sample, the linear trend drawn in Figure 1 would assume the same shape. Curiously, or not, the countries that arise at the top of the trend and facing highest inequality are Italy (average Gini coefficient equals 31.39), Ireland (31.54), Portugal (36.3) and Spain (32.56), which are those most affected by the recent economical and financial crisis and belong, together with Greece, to the well-known GIIPS – Greece, Ireland, Italy, Portugal and Spain (IIPS henceforward).
The inclusion of Luxembourg in the sample does not produce qualitative changes in the slope of the linear trend drawn in the figure, but affects it quantitatively. That is, despite its higher average level of openness degree, Luxembourg exhibits an ordinary average level of Gini coefficient, which biases the trend for countries when considering only countries with more comparable indicators. Furthermore, as we have already seen in
Belgium Germany Spain France Italy Luxembourg Netherlands Austria Portugal Finland Ireland 20 25 30 35 40 0 50 100 150 200 250 G ini co ef ficient Openness degree (% GDP) Country Trend
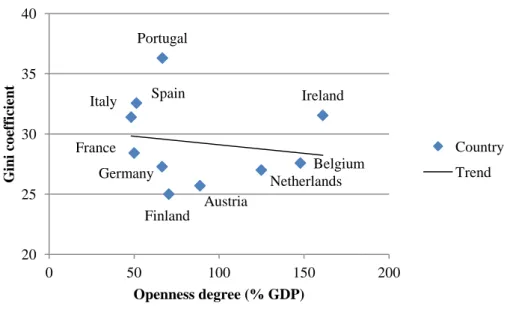
section 1, most globalization mechanisms operate through labor market. Since this market is largely composed, in Luxembourg, by foreign workers and that our inequality measures are applied to resident population, our inequality outcomes would be biased by this labor market particular feature. Therefore, we will proceed without Luxembourg in the analysis. Thus, Figure 2 shows the same trend as that in Figure 1 but it does not comprise Luxembourg.
Figure 2: Openness degree and Gini coefficient, average values 1995-2011 (excluding Luxembourg)
Data Source: Own calculation based on data from Eurostat, accessed in February 2013 at
http://epp.eurostat.ec.europa.eu/portal/page/portal/statistics/themes
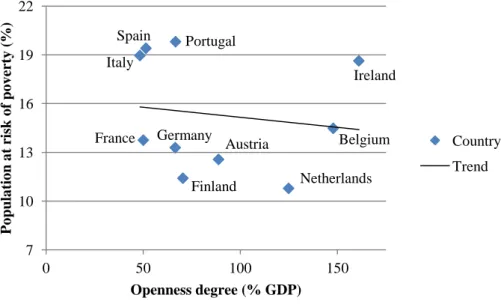
The same, rather weak, relationship is observed when other inequality indicators are used: the S80/S20 income ratio and the percentage of total population at risk of poverty. Figure 3 reflects the reduction in average S80/S20 income quintile share ratio, which represents a reduction in inequality between these opposite heights for larger openness degrees. The same trend is observed for the average percentage of total population at risk of poverty, as shown in Figure 4.
Belgium Germany Spain France Italy Netherlands Austria Portugal Finland Ireland 20 25 30 35 40 0 50 100 150 200 G ini co ef ficient Openness degree (% GDP) Country Trend
Figure 3: Openness degree and S80/S20 income quintile ratio, average values 1995-2011
Data Source: Own calculation based on data from Eurostat, accessed in February 2013 at
http://epp.eurostat.ec.europa.eu/portal/page/portal/statistics/themes
Figure 4: Openness degree and the percentage of population at risk of poverty, average values 1995-2011
Data Source: Own calculation based on data from Eurostat, accessed in February 2013 at
http://epp.eurostat.ec.europa.eu/portal/page/portal/statistics/themes Belgium Germany Spain France Italy Ireland Netherlands Portugal Austria Finland 3 4 5 6 7 0 50 100 150 S8 0 /S2 0 inco m e sha re ra tio Openness degree (% GDP) Country Trend Belgium Germany Spain France Italy Austria Netherlands Portugal Finland Ireland 7 10 13 16 19 22 0 50 100 150 P o pu la tio n a t risk o f po v er ty ( %) Openness degree (% GDP) Country Trend
It should be added that the group of countries already found above the linear trend drawn in each figure above (IIPS) keeps its position irrespectively of the inequality measure in use. Thus, the country with the highest level of S80/S20 ratio is Portugal with a ratio of 6.60 as opposed to Finland, with a ratio of 3.50. This means that, e.g., the richest 20% of Portuguese population is 6.60 times richer than the poorest 20%. In regard to the percentage of total population at risk of poverty, we observe, again, Portugal at the top (19.81%) and, at the bottom the Netherlands (10.78%); the latter is one of the Euro area countries where social transfers represent the largest share of GDP (see Eurostat database).
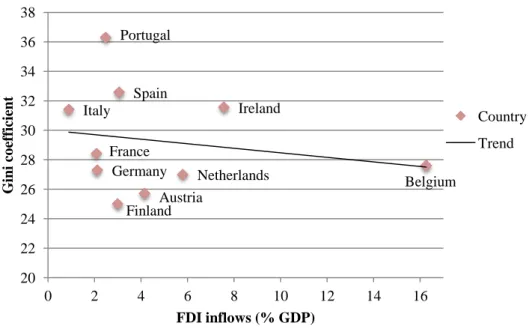
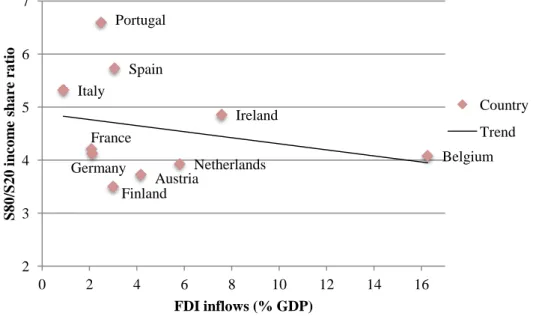
Apart from openness degree, we are also interested in ascertaining the impact of FDI on income inequality. Analysis of Figure 5 shows a negative correlation between the average net FDI inflows (investment less disinvestment in the host country) and average Gini coefficient.
Figure 5: FDI inflows and Gini coefficient, average values 1995-2011
Data Source: Own calculation based on data from Eurostat, accessed in February 2013 at
http://epp.eurostat.ec.europa.eu/portal/page/portal/statistics/themes
Not only relatively to Gini coefficient but also concerning to average S80/S20 inequality measure (the latter is shown in Figure 6 below) it is also perceived a linear trend downwards although three countries below the linear trend line seem to follow an opposite way. Finland, Austria and the Netherlands, though they influence negatively
Belgium Germany Spain France Italy Netherlands Austria Portugal Finland Ireland 20 22 24 26 28 30 32 34 36 38 0 2 4 6 8 10 12 14 16 G ini co ef ficient FDI inflows (% GDP) Country Trend
inequality in the set of countries under review, inequality exhibits an upward trend when the average levels of openness degree and FDI inflows expand. It is worth to note that this aspect was already seen in the previous figure related with this inequality indicator (S80/S20) and that Belgium, which appears usually on border of the linear trend line, follows up this countries’ upward trend.
Apparently, a negative relationship between inequality and globalization is stronger for high inequality countries while it is rather weak, even positive, for low levels of inequality.
Figure 6: FDI inflows and S80/S20 income quintile ratio, average values 1995-2011
Data Source: Own calculation based on data from Eurostat, accessed in February 2013 at
http://epp.eurostat.ec.europa.eu/portal/page/portal/statistics/themes
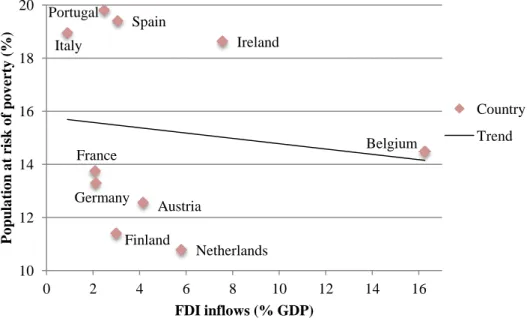
Figure 7 reveals an extreme disparity between the IIPS and all other countries as regards to percentage of total population at risk of poverty. Ireland, which is the country from IIPS with the lowest percentage (18.63%), exhibits a level which is four percentage points greater than the country with the highest one from all other countries, Belgium, with 14.48% of people at risk of poverty. In this case, we observe a downward trend between this inequality indicator and FDI inflows in both groups of countries, clearly stronger for the low inequality countries. This feature is also common to the relationship between risk of poverty and openness degree.
Belgium Germany Spain France Italy Netherlands Austria Portugal Finland Ireland 2 3 4 5 6 7 0 2 4 6 8 10 12 14 16 S8 0 /S2 0 inco m e sha re ra tio FDI inflows (% GDP) Country Trend
Figure 7: FDI inflows and the percentage of population at risk of poverty, average values 1995-2011
Data Source: Own calculation based on data from Eurostat, accessed in February 2013 at
http://epp.eurostat.ec.europa.eu/portal/page/portal/statistics/themes
The above regularities found regarding inequality measures and openness and FDI inflows are also valid when the relationship is assessed using average FDI outflows and the average KOF index of globalization. Figures B.1, B.2 and B.3, and C.1, C.2 and C.3 in Annexes B and C, respectively, (each one covering for Gini, S80/20 and risk of poverty indicators) show that, not only FDI outflows but also the KOF index, on average, relate negatively with Gini and S80/S20 inequality measures when inequality is high while exhibiting a positive relationship for low inequality levels. Using the risk of poverty indicator, the relationship is apparently negative for both groups of countries but, as before, relatively weaker when inequality is higher. Since we have already seen the inequality standards of each country, it must be only noted that the countries with the highest average FDI outflows in percentage of GDP are plainly the Netherlands (9.12%) and Belgium (13.59%). The others show a percentage between 1.56% (Italy) and 5.60% (Ireland). This ranking almost is maintained when we observe the results for the average KOF index. The exception is the replacement of Ireland by Austria. In this case, the Netherlands exhibits an average index of 90.43 and Belgium of 92.01. The gap for the other countries is now much smaller, being that the average KOF index for Austria is 88.92 and 80.18 for Italy.
Belgium Germany Spain France Italy Netherlands Austria Portugal Finland Ireland 10 12 14 16 18 20 0 2 4 6 8 10 12 14 16 P o pu la tio n a t risk o f po v er ty ( %) FDI inflows (% GDP) Country Trend
3. Assessment of the relationship between globalization and
inequality in the Euro area – a panel data approach
3.1. Methodology and data
The analysis presented in the previous section is rather inconclusive of the relationship governing globalization and inequality. Tentative analysis show that either negative or positive relationships may arise when inequality is measured through the Gini index or the S80/S20 ratio; apparently, a negative relationship arises between globalization and risk of poverty. However, several determinants, namely growth or the role of social transfers, affect inequality to a large extent, factors that the analysis in section 2 fails to address.
In this context we proceed with an econometric study in order to properly address the impact of globalization on inequality, controlling for other main determinants. In what follows we proceed with the description of the methodology as well as of the chosen variables to explain inequality. We also provide the main motivation, descriptive statistics and the data sources for each variable of the model.
In an attempt to test and to assess how globalization experience of the countries engaged in European integration has shaped the distribution of income/wealth within each country, we collected some of the more relevant studies on world inequality and we have examined the most important mechanisms, which have already been addressed in section 1. Gini coefficient on income is probably the most widely used indicator on inequality changes. Besides globalization variables, either capturing its economic, social or political dimensions, several other variables are commonly used in the literature as determinants of inequality (control variables). We collected several empirical studies encompassing all these aspects: Dreher and Gaston (2008), covering for more than one hundred countries and for the period 1970-2000; Bergh and Nilsson (2010), with a sample of seventy-nine countries and data from 1970 to 2005; and Villaverde and Maza (2011), including one hundred and one countries for time period 1970-2005. All of them test whether KOF index of globalization influences income inequality through unbalanced panel data applications. As already referred in section 1, above, KOF is a composite index which covers three dimensions of globalization (economic, social and political) using a wide range of variables, such as shown in Table A.1 in Annex A. Other studies simply rely on the economic dimension of globalization, namely through
the use of variables such as the openness degree or its components - exports and imports - (e.g., Baliamoune-Lutz, 2006, Dobson and Ramlogan, 2009), or the FDI (e.g., Mahler, 2004 uses FDI-outflows) or both (e.g., Lee, 2006, Wan et al., 2007, Barlow et al., 2009) to explain inequalities; these variables are included in the economic dimension of the KOF index.
Relatively to the most used control variables, we briefly summarize the main motivation drawn from the literature as to include them as determinants of inequality.
We introduce real GDP per capita and its square for the same reason that, e.g., Dreher and Gaston (2008), that is, to ascertain whether Kuznets curve effect is present at the level of real GDP per capita and inequality. In this regard, we expect that inequality rises until certain levels of real GDP per capita are reached, after which inequality will tend to decrease.
Like Bergh and Nilsson (2010), we also include unemployment rate to assess whether higher unemployment rates affect positively and significantly income inequality.
We also consider an education variable alike several studies in literature (e.g., Gourdon
et al., 2008, Bergh and Nilsson, 2010, Zhou et al., 2011). Our control variable consists
on the percentage of people with twenty-five years or over with only basic education. With its inclusion we expect larger values to be associated with higher inequality, because people with low educational attainment levels tend to earn lower wages, which may entail an increase in inequality.
Again following Dreher and Gaston (2008), we use a variable that collects all government social transfers. It is expected that transfers contribute to reduce inequality as they are targeted to smooth the impacts on disposable income of the poorer (e.g., unemployed or low-income households).
As referred by Faustino and Vali (2011), tax revenues, measured in percentage of GDP, may affect income distribution. We subdivide taxes into taxes on consumption (indirect) and labor and capital (direct) and we try to capture the importance of the weight of the direct taxes on total taxes to explain income inequality. We expect this ratio may to decrease inequality because taxes on labor charge workers at progressive rates, that is, they charge increasingly higher wages; and taxes on capital charge, mainly, the richest, who are capital owners, and, then, they contribute to reduce wealth and the associated incomes.