from the NOVA – School of Business and Economics.
The impact of energy transition in Integrated Oil Companies
Rui Miguel Luís Coelho – 30361
A Project carried out on the Master in Management Program, under the supervision of: Professor: Luis F. Martinez
Business Advisor: Otelo Ruivo (Galp’s Investor Relation Officer) Business Department: Galp – Strategy and Investor Relations
Rui Coelho – Nova School of Business and Economics 2
Abstract
Sustainability and the need for an energy transition are among the most talked topics worldwide due to the repercussions it may have in future generations. As governments and international entities push towards a more sustainable framework, change is inevitable, and the Energy sector must accept the progress and be prepared to embrace new regulations and business models. However, such deep changes, impactful to the foundations in which society is built, are not sudden and will require time. Integrated Oil Companies should aim to understand the pace of transformation and how to redesign its own structures. This paper attempts to identify the main key issues and factors, how they currently affect these companies, and how they should be addressed. The analysis assumes a rational economic and social point of view, considering the principle of continuity, with companies having the objective of extending their economic activity and adapting to market conditions if required, and the principle of maximizing the value creation for all stakeholders, from consumers to shareholders or members of the society in which they operate.
Keywords: Sustainability, Energy Transition, Integrated Oil Company, Fossil Fuels, Renewable
Energy
At the end of another milestone, I would like to thank to all those who have assumed an active role in my accomplishments. I would like to address a word of appreciation to Professor Luis F. Martinez for accepting this challenge and for all the availability and attention shown. Likewise, I would like to thank to all of Galp's employees who were kind enough to share their knowledge with me, but mainly to stimulate my critical thinking without ever influencing my analysis or opinion. To my grandparents, parents, sisters and friends, for always being by my side and finally to my girlfriend for being a vital part of my life and for always being there for me.
Rui Coelho – Nova School of Business and Economics 3 Index Abstract ... 2 Introduction ... 4 2. Methodology ... 7 3. Discussion ... 7
3.1. The current economic, energetic and social paradigm ... 7
3.2. The future of energy ... 12
3.3. Investors... 16 3.4. Consumers ... 18 4. Findings ... 21 5. Conclusion ... 23 Abbreviations ... 25 References ... 26 Appendix ... 30
Rui Coelho – Nova School of Business and Economics 4
Introduction
Sustainable development was defined by the United Nations as the “development that meets
the needs of the present without compromising the ability of future generations to meet their own needs” (Brundtland, 1987 - United Nations World Commission on Environment and Development:
“Our Common Future”, p. 54) and since then has been an indispensable component of the policy makers’ concerns. The impact that economic activity and social development has had on the environment has increased fears about Humankind’s future, and the limits to which extent the interests and development of the coming generations is being endangered by present actions.
As new regional, national and international environmental policies change the legislative landscape, increasingly promoting a more sustainable framework, it is expected that profound changes in the energy sector occur. The outline of strategies and the definition of targets to be achieved, such as reducing the use of fossil fuels or the emission of sulphur dioxide (SO2) into the
atmosphere, will affect the way companies operate. Integrated Oil Companies (IOC) will likely be the ones in the Energy sector to be most impacted, requiring more deep reforms due to their own nature and exposure to fossil resources.
An IOC is any company with an extended position in the oil & gas value chain [in annex, Figure 1]. These companies can engage simultaneously in upstream, midstream and downstream activities.
Upstream, or exploration and production (E&P) activities, are all those involving the search for hydrocarbons through geophysical methods, whether natural gas or oil fields, and consequent commercial evaluation and extraction. The process initiates with exploratory wells, to quantify the resources reserves’ volumes. As the economic feasibility of the project is assured, the production stage is initiated, with wells drilled to recover and extract the oil and gas reserves. E&P projects can occur either onshore or offshore, with resources being extracted to platforms or ships.
Rui Coelho – Nova School of Business and Economics 5 Midstream activities refer to the set of procedures that occurs between the extraction of reserves and the beginning of the refining process that will allow to create oil-based products. Those activities consist in transport, storage and process of oil and gas reserves, via tanker ships, pipelines and truck fleets, as the production process can occur in a considerably distant geographical region from where the refining activities will happen. Due to financial optimization, many companies prefer to not refine the crude produced, as it is more economically viable and advantageous to acquire and sell in the international markets, taking benefit of market arbitrations. Downstream activities comprehend the refining and marketing (R&M) of oil and gas-based products and can include oil refineries, petrochemical plants, crude products distributors, retail stations or natural gas distribution companies. The downstream segment is the only with business-to-consumer (B2C) activities, contrarily to the upstream and midstream activities, which are business-to-business (B2B) activities.
Nowadays, as oil and gas-based products are a fundamental energy source for the survival and regular functioning of society [in annex, Figure 2], fluctuation in crude oil prices often end up reflecting the global economic development. According to historical data, considerable periods of crisis in the 20th century and 21th century were proceed of peaks in oil prices [in annex, Figure 3].
One of the reasons presented is the fact that during geopolitical tensions, especially in geographic zones with substantial amounts of reserves like Middle East, the loss in output caused by wars creates pressure in the oil supply side, leading to an increase in prices. This increase is not followed by an increase in global gross domestic product (GDP) per capita, causing a reduction in the economic power from consumers and companies. The lost in purchase power will affect demand and consumption, implying a slowdown in the economic activity (Hamilton, 2010). Posteriorly, as geopolitical tensions ease and demand and supply adapt to the new market conditions, prices are able to return to an equilibrium point.
Rui Coelho – Nova School of Business and Economics 6 Due to the complexity of the industry’s activities, both from an operational and management level, and due to the considerable number of external factors, such as government regulations, international environmental regulations or geopolitical conflicts, many companies decided to broaden their business portfolios, reducing risk and exposure to non-controllable factors. In addition to the synergies between different business units and the enhancement of competencies, a broaden position in the value chain allows to take advantage of temporary market arbitrations. Periods of adverse market conditions in some segments, can potentially be offset by temporary propitious improvements in others. As an example, when crude prices fall sharply, ceteris paribus, the upstream financial performance decreases, since the results are highly dependent on the quantity of barrels produced and the selling price, however, fuels’ price retail stations’ present a lower elasticity, prices will not decrease as much as crude’s price, allowing some of the negative effect to be compensated.
Considering the need for diversification to reduce risk and the current energy transition, many IOC have already entered in other industries such as electricity power, engaging in its production, trading and distribution to consumers, and therefore not being exclusively dependent on oil and gas resources.
The high level of complexity of operations and activities developed imply that these companies are under constant scrutiny from regulators in order to ensure that the communities and the environment where they operate are not at risk. For the same reason, the industry is constantly changing as new legislations are adopted, implying considerable mutations at an operational level. As a capital-intensive industry, with projects, especially in the upstream segment, reaching tens of billions of dollars according to companies’ public information about capital expenditure costs, it is common for them to establish partnerships with others, even when are competitors in other business segments, to promote a more sustainable economic development and reduce financial risk.
Rui Coelho – Nova School of Business and Economics 7
2. Methodology
For the development of the paper, it was initially necessary to understand the factors that currently affect the sector, and more precisely the ones that most impact have on IOC. Therefore, it was necessary to perform a secondary research, retrieving information from academic and market researches and theoretical papers to better understand what studies have already been carried out and the conclusions about how certain factors have influenced and shaped the industry. The collection and analysis of information from documents with different scopes and referring to various time frames, through an extensive literature review, contributed to the identification of factors, not exclusively economics, that should be the basis of the decision making process of IOC.
Additionally, and considering the objective of making recommendations on how to address the energy transition, it was also necessary to perceive and estimate how these same factors will evolve in the future and their impact in the decision making process. Information from projections made by other authors and international entities was analysed, and the impact and influence in the success of future strategies was estimated. Only after this steps, it was possible to recommend a reasoned and informed strategy.
3. Discussion
3.1. The current economic, energetic and social paradigm
The world is in a continuous and perpetual state of change due to the ongoing process of innovation that allows societies to be always evolving and improving. Therefore, as part of the social dynamics, governments, companies and individuals are in an uninterrupted process of pursuing and finding a balance that supports a sustainable development where the needs of the all citizens are satisfied.
Rui Coelho – Nova School of Business and Economics 8 Despite economic and humanitarian differences across regions in the world, mainly in the developing countries where progress is still limited, currently, Humankind is witnessing a period of fast global economic and social growth [in annex, Figure 4 and Figure 5].
Historically, economic growth is highly correlated with innovation in procedures and the level of development and implementation of technological progress (Kuznets, 1955; Phelps, 1966). As technology improves, it is visible an increase in efficiency, being possible to produce more wealth with the same resources. Therefore, the combined effect of population and efficiency growth expected for next years, allows to predict that the world’s economic growth rates will continue to increase, similar to what has happen in the recent past [in annex, Table 1, Table 2 and Table 3].
Besides population growth and technology diffusion, another factor has assumed a fundamental importance in the world’s economic and social development, the energy sources. One of the industries that most contributes to economic growth and development is the energy sector (Ayres and Warr, 2009). An increase in energy sources’ efficiency will allow to reduce the cost of energy while increasing the levels of productivity. As revolutionary innovations in energy efficiency are implemented and become accessible at a global scale, productivity worldwide increases, and consequently output and total wealth. As an example, the spread of the steam engine perfected by James Watt in late 1700s, or, the global commercialization of the internal combustion engine in late 1800s, marked the begin of First and Second Industrial Revolution, respectively, changing dramatically the daily routine of billions of people around the world [in annex, Figure 6].
Hence, a clear relationship between energy efficiency and economic growth can be extrapolated. However, as energy demand and consumption grows, it is expected that the level of pollution and gases’ emissions will also increase [in annex, figure 7]. The Environmental Kuznets Curve (EKC) (Grossman and Krueger, 1991), similarly to the relation presented by Simon Kuznets
Rui Coelho – Nova School of Business and Economics 9 in the 1950s between economic development (measured as GDP per capita) and social inequality [in annex, figure 8], provides the comparison and relationship between energy use, economic growth, and the environment [in annex, figure 9]. According to the authors, the increase of economic activity will lead to an increase of the environmental degradation. However, as income rises, the necessity and desire for both higher standards of life and economic and electric efficiency will also follow the same trend. This new predisposition will stimulate and encourage investments in improving environmental quality, reducing the environmental degradation [in annex, figure 10]. In the past years, companies’ environmental damage and sustainability factors have assumed an important role (Chen and Chai, 2010), with concerns over the environmental component of services and products gradually increasing [in annex, figure 11 and table 4]. Additionally, recent studies demonstrate that, as consumers are becoming more informed about the sustainability of products and services acquired (Moisander, 2007), their motivation and action towards sustainable purchase also increases (Doran, 2009, and Makatouni, 2002). Furthermore, consumer’s willingness to pay (WTP) a premium is also increasing [in annex, Figure 12], reaching such a huge prominence that allows sustainability to be now perceived as a purchasing driver, especially among the youngest generations [in annex, table 5 and table 6].
The change in consumers’ purchasing behaviour is only one of the components of the current transformation process occurring in global markets. As society witnesses and experiences social and economic disruption, the way global trade is done is also being affected. Since the end of the last century, Humankind has been truly living and participating in the concept of “Global
Village”, developed by H. M. McLuhan, in 1959. Currently, information is instantaneously
available, and people have unlimited access to it, which consequently enables physical and time barriers to be reduced. For companies, it implies that the number of stakeholders increases considerably, competing now at an international scale.
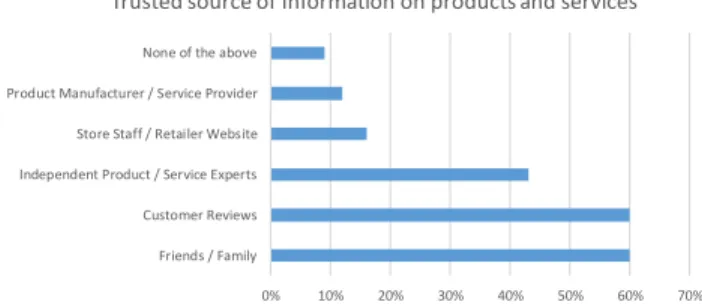
Rui Coelho – Nova School of Business and Economics 10 Hence, more than ever, companies should be concerned and follow carefully the opinion of every stakeholder, mainly consumers. Due to the progress in information technologies, customers are engaging more actively in online media platforms to transmit their experiences and opinions [in annex, figure 13]. Additionally, as consumers’ level of trust is apparently higher towards other consumers’ feedback rather than institutional actions [in annex, figure 14 and figure 15], their response and perception towards the company, brand and/or products and services can potentially have a very positive or a negative impact in other consumers.
Thus, as consumers’ importance increases, the companies are obligated to adapt if they want to stay competitive. Consequently, another major change in global markets is the shift from the product-oriented approach towards the consumer-oriented approach. During the 20th century, as the Industrial Revolutions allowed to implement mass production, companies were focused in maximizing production and wealth with efficiency, economies of scale, standardization and cost savings being some of the key cornerstones for success (Imai, 1986). However, as the world experiences a period of consumers’ empowerment, with them becoming more demanding, companies must strive to fill the gap between their current value propositions and consumers’ desires and need to be connected (Cova and Cova, 2002). For that reason, in many industries the change to a more consumer-oriented approach appears as a requirement, since it is the best way to continuously create additional value that can be perceived by the markets (Woodruff, 1997).
During the 21th century, according to BrandZ, the world's largest brand equity database,
companies that were able to create and sustain powerful brands could uninterruptedly overperform market indexes. By differentiating themselves from the remaining competitors in the market (Keller, 2002 and Kapferer, 2008), companies are able to increase their effectiveness to successfully attract, maintain and build their relationships with consumers. As the relationship matures, the consumers’ brand awareness and brand loyalty towards the brand increases (Aaker,
Rui Coelho – Nova School of Business and Economics 11 1990), leading to a growth in the consumer lifetime value, which immediately translates into superior financial results (Slater and Narver, 2000).
Therefore, while markets and consumers desire for more attention from companies to satisfy their growing needs and requests, the energy sector, one of the sectors that most contributes to develop global trade, is the same that is negatively perceived by them. The negative aspects like pollution, brought by the increase in productivity and economic activity, rapidly converts into undesirable opinions from consumers [in annex, Figure 16]. Inside the Energy sector, the Oil & Gas Industry is one of the energy branches with worst perception, while Renewable Energies and Electricity & Gas are the major contributors for improving the current perception of the sector [in annex, Figure 17 and Table 7]. Despite the pessimist image of the sector, people and communities can understand and recognize the potential benefits that are originated by the development of this Industry’s economic activity (Theodori, 2009) [in annex, Figure 18].
The impasse created between satisfying consumers’ needs and consumers’ perceptions, allows to reflect on the relationship between IOC and consumers. Should IOC, which most times fail to transmit the essence of their business portfolios, bet on a new operational and communication strategy? Should companies adapt their strategy to communicate more efficiently about a sector that is highly regulated and taxed, in which a company can simultaneously invest in oil E&P assets, while also investing in research and development of renewable energy and future sustainable mobility? Or, contrarily, all efforts to convey the sustainable role that some of these companies already have at international markets would be economically unviable since, building a more positive brand image would not evolve into a superior financial return?
Rui Coelho – Nova School of Business and Economics 12
3.2. The future of energy
Identically to almost everything related to the future, the high level of uncertainty is prevalent and often impossible to disconnect from it in the planning stage of every project and strategy. Therefore, it is a global practice for individuals, companies, governments and other entities to use scenario analysis to carefully scrutinize every possible outcome from variations in micro and macroeconomic assumptions, outside the control of the parties involved.
Commonly, as companies and governments prepare their strategy for the coming periods, their ability to accurately predict the future evolution of the industry is critical to their success, as it allows to be better prepared and efficiently deploy the right resources. For this reason, and due to the complexity of the oil & gas industry, which is largely affected by factors such as international benchmarks and regulations, when trying to understand the energy outlook, companies base their strategy on the analysis, scenarios, models and assumptions developed by independent international agencies, thereby maximizing the level of effectiveness and efficiency of their policies.
The International Energy Agency (IEA) is an autonomous organisation, which in association with the Organisation for Economic Co-operation and Development (OECD) promotes policies that will enhance the reliability, affordability and sustainability of energy in its 30-member countries and 8-associate countries. Its analysis and studies are considered a benchmark for the forecasts in the energy sector, due to the access to data from leading economic countries. Consequently, are regularly used to support decisions by both governments and companies.
Currently, IEA presents three core scenarios, with different paths being studied, analysed and addressed, differentiating essentially in the underlying assumptions about the move towards environmental sustainability frameworks and the commitment of government and international agencies when implementing their energy-related policies.
Rui Coelho – Nova School of Business and Economics 13 The predominant scenario, and the most probable to occur, is the New Policies Scenario (NPS). This scenario aims to provide the most likely outlook of how the energy sector will evolve considering current policies and how these have evolved in the past and how it is expected to evolve in the future, based on current market information. Therefore, it considers not only measures that are already being implemented but also measures and policies announced that will become a reality in the near future.
The most pessimistic scenario in relation to energy transition and development to a more energy sustainable society is the Current Policies Scenario (CPS). This scenario only considers measures that are completely rooted in society and currently in practice today. The CPS predicts a world where progress and government efforts to stimulate future changes are low.
The most optimistic and even utopian scenario for current and future societies is the Sustainable Development Scenario (SDS). This scenario does not only consider policies and measures that are expected to be implemented but also considers for instance the Sustainable Development Goals defined by the United Nations, and how it would be if these goals were achieved [more information in annex].
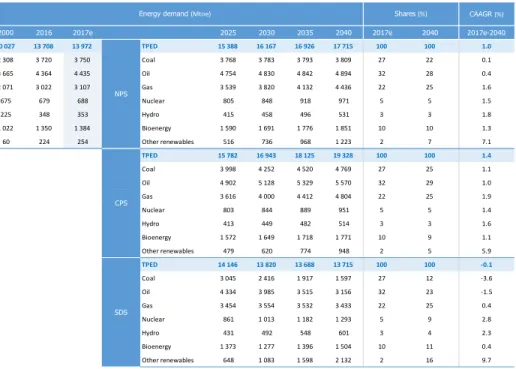
For IOC, as society moves in direction to a more energetically sustainable world, the consequences increase from a management point of view. As the level of changes in the current energy mix increases [in annex, table 8 and table 9], more profound will be the modifications required in the companies’ business portfolios to stay competitive. Thus, it is understandable that due to the scale and duration of the projects in this industry, which can take years until become operational, a good analysis of the main indicators becomes imperative for an organization to prepare its operations wisely.
Considering the NPS, the global energy demand is expected to increase by more than 25% until 2040, while electricity demand is expected to increase by 60%, with close to 90% originated
Rui Coelho – Nova School of Business and Economics 14 in the developing countries. Even in the SDS, the demand for fossil fuel is strong, being 60% of the energy primary demand in 2040, despite a strong increase from renewables.
As anticipated earlier, on the back of higher economic activity and increase in global population, the level of carbon dioxide (CO2) emissions will follow the same path [in annex, table
10]. However, this increase will be largely on the back of developing countries, as the increase in energy consumption in developed countries is compensated by an increase in energy efficiency and change in energy sources [in annex, figure 19]. Therefore, IEA’s forecasts will implicate an alteration in the EKC previously presented, regarding the correlation between increase in economic activity and the increase in emissions of pollutants. The development of global trade and cooperation between nations will allow technological advances in sustainability to be rapidly spread to countries that would otherwise be incapable of generating such knowledge and economic conditions to develop such technologies. Consequently, it will be possible to observe in the future a much more curved and sharped reduction in emission of pollutant gases in developing countries, with peak levels of environmental degradation lower than in countries that developed earlier (Dasgupta, 2002; Perman and Stern, 2003).
Despite the clear benefit of low carbon solutions from an environmental point of view, there are still reasons why IOC continue to invest in oil resources. The main reason is the demand for crude oil based-products. The sub-products produced are fundamental to the regular functioning of today's society, being fundamental in many industries, such as transportation or petrochemicals [in annex, table 11]. The transport sector, it is currently supplied almost exclusively by fossil fuels, and even in an scenario where the development and penetration of electric vehicles is high, potentially reaching 1/3 of the global fleet by 2040 (BP Energy Outlook, 2018; Bloomberg Electric Vehicle Outlook, 2018), less than 15% of the total energy required would not come fossil fuel sources [in annex, table 12]. In relation to the petrochemical industry, the products originated are
Rui Coelho – Nova School of Business and Economics 15 fundamental for several industries [in annex, Figure 20], and will be responsible a large part of the increase in crude demand until the end of the next decade [in annex, figure 21]. One of the main purposes, plastic production, can even reach about 20% of world crude oil consumption by 2050 (Center for International Environmental Law, 2017).
Another reason for the persistent use and investment in fuel fossil, at least in the short-term, is due to the superior profitability of the projects when compared to other energy
sources and other projects belonging to the value chain [in annex, table 13]. The Internal Rate of Return (IRR) of renewables range from 7% to 10%, 7% for offshore wind, 9% for onshore wind and 10% for solar, while next generation upstream projects are expected to reach around 16%.
In the future, due to the continuous investment in renewable energies [in annex, Table 14], the level of efficiency is expected to improve, which will consequently contribute to higher projects’ profitability [in annex, figure 22 and figure 23]. However, it is equally expected that some of the benefits will be partially reduced as governments and international agencies cut subsidies to investments. Furthermore, as new laws and regulations come into play, the increase in demand for services and products to support these projects will create pressure in supply, reducing margins [in annex, Figure 24].
Hence, considering the energy outlook for the next decades, at least in the short and medium-term, IOC have apparently no reason to quickly divest in their oil assets, either upstream or downstream. Despite new regulations and an increasingly strong trend towards a more sustainable framework, forecasts indicate that change will not be sudden, and demand for oil-based products will continue to exist. A sizable part will be used to manufacture products essential to societies and economic progression, like technological equipment, clothes, packages, among other products, highlighting the importance of this natural resource. In addition, due to the premature phase in which the technological development of renewable alternatives is, oil-related projects
Rui Coelho – Nova School of Business and Economics 16 continue to be more financially attractives. In any case, as technology evolves, and once supported by a more favourable legislation context, it is undeniable that sustainability knowledge will spread rapidly across countries allowing greater penetration of related projects.
3.3. Investors
As the world becomes more complex and interconnected, new challenges and opportunities appear for companies and market actors, allowing them to modify the way societies live. To address some of the existing issues, companies, governments and other entities have been involved in multiple initiatives targeting the improvement of the normal functioning of communities and human interactions.
A relevant topic nowadays are the Environmental, Sustainability and Governance (ESG) aspects of the economic activity [in annex, Table 15]. As consumers become more concerned about sustainability [in annex, Figure 25], organizations and market actors also assume a greater interest in ESG metrics and how they can improve the decision making process [in annex, Figure 26]. Nowadays, ESG approach is starting to spread, consisting in a set of measurements and issues that
“(…) in a more globalised, interconnected and competitive world (…) the way are managed is part of companies’ overall management quality needed to compete successfully” (United Nations,
2005 - “Who Cares Wins, Connecting Financial Markets to a Changing World”, p. 5).
These metrics have always existed since the beginning of capital markets. In the 1960-70s, during a period of enormous concerns about women, civil and labour rights, the Socially Responsible Investing (SRI) assumed a similar role in guiding investment decisions. Today, multiple companies present small variations of the ESG framework, being now a fundamental tool for an increasing number of investors [in annex, Figure 27 and Figure 28]. The fundamentals behind the ESG concept is that companies that have a correct approach to these components might
Rui Coelho – Nova School of Business and Economics 17 be able to better manage risks, anticipate regulatory actions or contribute to a sustainable development of the community in which they operate.
Currently, it is observable a relevant increase in sustainability reporting instruments [in annex, Figure 29], and the size of the committed assets under management (AUM) to the United Nations Principles for Responsible Investment [in annex, Figure 30], conveying the importance of understanding the investment relevance of sustainability issues. Currently, there is a lack of consensus among authors and researchers about the impact that more insightful information about ESG metrics can have in investments’ results and companies’ strategies.
Some studies argue that investing in sustainability might create benefits in various components of the business. Relatively to consumers, sustainability performance might allow to improve brand image, which consequently can increase demand for products and services, while reducing price sensitivity (Konar and Cohen, 2001). At the same time, it is possible to decrease risks related to negative legislative, criminal or fiscal actions against the company, as corporate reputation increases (Hillman and Keim, 2001, Freeman et al., 2007). Moreover, firms engaging in material sustainability issues can create value for shareholders (Kahn, 2015), by developing brand image and creating competitive differentiation. Thus, incorporating ESG metrics both from a company perspective, as well from an investor perspective, can potentially drive to superior financial and market performance (Eccles et al., 2012, Chan and Walter, 2014).
Contrarily, other studies indicate that there is no correlation between sustainable investments and better performance in the financial markets [in annex, Figure 31 and Figure 32]. Some studies even indicate that the investment can create a competitive disadvantage by increasing the costs of the company, which might lead to benefits in terms of management but reduced benefits to shareholders (Brammer and Millington, 2008).
Rui Coelho – Nova School of Business and Economics 18 Despite the divergence of opinions about the impact of ESG metrics on a company's performance, it is undeniable that it is increasingly assuming itself as an investment criteria for shareholders. Shareholders are currently divesting their positions in the industry (Ayling and Gunningham, 2015), with c.$6.2 trillion already divested (Arabella Advisors, 2018). As studies indicate that exiting the industry will not imply inferior investing performance according to historical data (Trinks et al., 2017), companies in the energy sector, more precisely in the oil & gas industry, should analyse the impact of their decisions to avoid being in the divestment list.
If a company becomes unattractive to investors, besides the deterioration of the company's reputation in the capital markets, the size of the AUM available to be invested will be lower. Consequently, the daily trading volume will decrease, with the share price potentially following the same direction, while the share volatility and the risk of stock price’s manipulation increase. Although these factors do not impact the daily operations of a company, they may cause difficulties during financing periods, either through capital issuance (lower value per share due to devaluation), or through debt issuance (higher costs of debt due to higher risk). Furthermore, if a material depreciation of the share’s price occurs, a potential hostile takeover can happen, increasing the risk and instability for the company’s management.
3.4. Consumers
The concerns about sustainability is among the trends that is most shaping societies today. As mentioned earlier, as the world faces an environmental crisis and a significant decrease in its natural resources, governments are required to engage in activities that promotes a transition to a more environmentally responsible paradigm. More and more, as organizations try to promote and implement environmentally sustainable projects in everyday life, consumers also demonstrate an intention to follow and assume an active role in change. Furthermore, the WTP for such products
Rui Coelho – Nova School of Business and Economics 19 and services increases as consumers look for alternatives that best fit this new lifestyle. However, despite the desire to practice a more sustainable way of life, there is a disparity and inconsistency in their actions, with the intention not translating into action and/or purchase [in annex, Table 16]. Several studies have been conducted in the past decades to better understand what factors affect consumers’ predisposition for green-purchase behaviour. Furthermore, studies and researches were developed to explore the reasons why there is a lack of consistency between the position assumed by consumers and their behaviour. The main factors identified as a barrier to adopting more sustainable behaviour were higher prices, low availability and lack of trust and knowledge regarding brands, products and services (Young et al., 2010, Joshi and Rahman, 2015) [in annex, Figure 33].
The increase in products and services’ price was identified as one of the highest barrier, by preventing a significant number of consumers from being willing to abdicate the purchasing power required to acquire them (Gleim et al., 2013). Likewise, the product availability was also identified as one of the major obstacles for consumers. The difficulty in acquiring such products appears as a barrier to purchasing environmentally sustainable products (Vermeir and Verbeke, 2008), as consumers nowadays demand convenience.
For consumers the characteristics of the products also represent a significant weight in their judgement. Sustainability alone is not a purchase factor, as consumers continue to rely on the functional attributes of products and services to adopt a decision (Chen and Lobo, 2012). In addition, the knowledge that consumers have about the brand itself acts as a determinant, since confidence in the brand positively influences consumers purchase behaviour (Rahbar and Wahid, 2011). Furthermore, consumers also feel the need to know and believe in the claim of sustainability that is being promoted by organizations (Gupta and Ogden, 2009). Finally, it is not only necessary
Rui Coelho – Nova School of Business and Economics 20 to have confidence in organizations and products, it is equally necessary for consumers to know what environmental problems they are addressing (Eze et al., 2013).
Regarding the energy sector, and more precisely the power industry, there is a gap between costumers’ expectations, performance and cost. This gap appears to be independent of the cost of the service, but is rather related with the level of information, as consumers desire and value a high level of personalised information (Opower, 2013). Recent studies demonstrate that the WTP a premium for renewable energy sources is positively associated with the education level on the sustainability topic and a favourable position assumed by government entities and organizations, through subsidies and efficient environmental policies (Bösche, 2016; Ntanos et al. al., 2018). To overcome financial convenience, consumers must feel incorporated in the design and implementation of the renewable energy policies and targets, and must have access to reliable environmental information.
Another trend that will shape society and the power industry in the coming decades is the fact that the marginal cost of renewable energy will tend to zero (Rifkin, 2014), since after the initial fixed costs, the cost of producing an extra unit of energy is close to zero. Despite the costs associated with maintenance, storage, and power generation through conventional sources at peak periods when renewables cannot satisfy all the demand, the cost of energy for consumers is anticipated to be lower. Therefore, energy companies will have to adapt in order to maximize revenues. One of the possibilities for the industry and companies is the transformation of the service into an experience, based on the concept of Experience Economy (Pine II and Gilmore, 1998). Consumers’ WTP is higher for memorable experiences and events [in annex, Figure 34], and companies should invest in tailoring their products and services to deliver a captivating experience, by increasing the range of benefits offered or by partnering with other companies to transform the current business model.
Rui Coelho – Nova School of Business and Economics 21 Regarding the distribution of oil-refined products, the only B2C activity involving crude oil derivatives, sustainability still plays a minor role in consumer purchase behaviour. Considering the case of oil Marketing in Portugal, a considerable percentage of consumers are mainly affected by purchase drivers independent of brand and sustainability components [in annex, Figure 35]. Moreover, to support the lack of preponderance and sensitivity to brand-related factors, there is apparently no relation between a favourable brand image and market share in the Portuguese market [in annex, Table 17, Table 18, Table 19 and Table 20].
4. Findings
It is practically unanimous among experts that Humans are currently living beyond their possibilities from a sustainability point of view. As the effects and consequences of human activity become visible, through the destruction of the ozone layer or the increase in the average global temperature that leads to the melting of the ice caps, we also observe an increase in environmental policies and measures at a global scale. Supported by technological advances, the new environmental policies will try to combat the recent climate change and create a landscape where Humankind can live in harmony with the environment.
The change is imminent and due to the goals it hopes to achieve, it must not be contested but promoted and encouraged. As we move towards a more sustainable society and carbon neutrality, profound changes in energy companies will be mandatory. The energy transition will undoubtedly change the way the energy sector is structured and it is necessary to make a careful analysis of the immediate impact that this transformation will have and how it should occur. It is wrong to consider that the transition will be sudden and not a gradual process. The modifications required to be introduced in society are enormous and a period of adaptation is fundamental. An abrupt total reduction in the emission of polluting gases or the banning of certain energy sources,
Rui Coelho – Nova School of Business and Economics 22 such as fossil fuels, could potentially have a drastic effect on society. The inability to satisfy total energy demand and the increase in price due to the law of supply and demand, would affect citizens and businesses, jeopardizing economic growth and social wellbeing.
Governments and international entities’ obligation to guarantee economic stability and the generalized access to energy will make a gradual change imperative. As IOC will unquestionably be one of the most affected, considering that the basis of their activity is fossil resources, during the transition period they must promote internal restructurings. By developing a balanced strategy, IOC will be able to take full advantage of the current economic landscape, but remain competitive and capable to create value for all the stakeholders in a few years' time when the energy transition is already in place. Currently, from an economic point of view, the superior profitability of fossil energy sources and market’s current demand and supply still provides attractive investment opportunities for IOC. Even in a scenario where United Nations’ goals are reached, the demand for oil-based products will continue to exist, especially in the petrochemical industry, since renewable energy can only offer solutions in the areas of electricity and mobility. Nevertheless, it is expected that renewable energy alternatives spread in the future, becoming more and more an alternative, as the profitability increases due to technological progresses and new regulations and laws create the proper conditions for the diffusion of these solutions.
From a communication perspective, companies have an encouragement from shareholders and consumers to embrace energy transition. Companies must convey their sustainable objectives and plans to investors, since an increasingly significant percentage of them is demanding more information about relevant sustainable indicators to access their investment decisions. The inability to attract and retain investment can be harmful both in short and long-term, and companies must communicate their real interest and efforts in investing in low carbon solutions and how they are changing their current portfolio mix and participating in the transition. A successful operational
Rui Coelho – Nova School of Business and Economics 23 and communicational strategy will reduce the risk of massive divestment, while keeping the reputation in stock markets unchanged. Furthermore, market performance is not affected and the stock price will continue to reflect the intrinsic value of the company, avoiding potential takeovers. The potential transition to a more sustainable framework is expected to have a positive effect in consumers due to the current sustainability trend. A more favourable perception from consumers will result in an improvement of brand image and brand reputation, even though it is not expected to result in significant increases in revenues in the short-term. Currently, energy used to electricity and transportation is still seen as a commodity and consumers are not sensitive to brand effects when compared to other key purchase drivers such as price or convenience. It is expected that, as sustainability education spreads worldwide and consumers become more aware of environmental issues, their WTP also increases. Additionally, as the cost of energy is expected to decline over the next decades, due to the marginal cost of energy from renewables, to maintain the profitability levels, companies should try to develop new business models that allow the creation of an experience that adds value to consumers, reshaping the sector as we know it today.
5. Conclusion
Through this paper, I hope have managed to convey which factors should be the basis for the decision making process for companies in this industry. By considering not only economic factors, but also social and reputational factors in the decision process, a company is able to develop strategies that aim to maximize long-term value for stakeholders. Based on that, currently, companies in the oil & gas industry should not fully embrace this transition and radically reshape their business portfolios, at least in the short-term, considering that it would imply value destruction.
Rui Coelho – Nova School of Business and Economics 24 While companies cannot ignore the impact that their economic activity has on the environment, focusing only on financial results, they should not also ignore all the heritage and history and radically redesign their operations. As the profitability of oil and gas projects are higher and a relevant share of consumers are not willing to pay a premium for energy, as price and convenience remain the main purchase drivers, an abrupt change would be an irresponsible decision for a company’s management. However, IOC must prepare the transition, starting with their business portfolios, and studying the market and macro conditions to define the most appropriate portfolio in the future, ensuring that when the energy mix changes significantly it is possible for the company to maintain its position in the market.
To conclude, the impact of energy transition in IOC is limited in the short-term, with no relevant visible consequences. The only significant impact is in the planning stage of companies’ future strategies. Despite no financial benefits are expected in the short-term, more likely to be negative, governments and international organizations commitment to promote the energy transition will change the energy landscape and companies must prepare for that. The opportunity for these companies lies in the fact that the uncertainty about the speed of change and implementation of new policies provide occasions to new business units to emerge. Therefore, the only major impact from energy transition comes in a form of a challenge: to continuously examine project’s profitability, market demand and investors and consumers’ behaviour, in order to be able to identify the best market opportunities and know how and when to exploit them.
Rui Coelho – Nova School of Business and Economics 25
Abbreviations
AUM Assets Under Management
B2B Business-to-Business
B2C Business-to-Consumer
CO2 Carbon Dioxide
CPS Current Policies Scenario
E&P Exploration & Production
EKC Environmental Kuznets Curve
ESG Environmental, Sustainability and Governance
GDP Gross Domestic Product
IEA International Energy Agency
IOC Integrated Oil Company
IRR Internal Rate of Return
LCOE Levelized Cost of Energy
NPS New Policies Scenario
OECD Organisation for Economic Co-operation and Development R&M Refining and Marketing
SDS Sustainable Development Scenario
SO2 Sulphur Dioxide
SRI Socially Responsible Investing
Rui Coelho – Nova School of Business and Economics 26
References
Aaker, D. (1990). “Brand Extensions: The Good, the Bad and the Ugly”. Sloan Management Review. 4, pp. 47–56.
Arabella Advisors (2018). “The Global Fossil Fuel Divestment and Clean Energy Investment Movement – 2018 Report”.
Ayling, J., and Gunningham, N. (2017). “Non-state governance and climate policy: the fossil fuel divestment movement”. Climate Policy Journal, 17:2, pp. 131-149.
Ayres, R. U. and Warr, B. (2009). “The economic growth engine: How energy and work drive material prosperity”. Edward Elgar, Cheltenham, UK and Northhampton MA, United States. Bloomberg New Energy Finance (2018). “Bloomberg NEF, Electric Vehicle Outlook 2018”. BP (2018). “BP Energy Outlook – 2018 Edition”.
Bösche, A. (2016). “The Chinese Consumers' Attitudes towards Their "Willingess to Pay" for Renewable Electricity”. Department of Economic History, Lund University School of Economics and Management.
Brammer, S., and Millington, A. (2008). “Does it pay to be different? An analysis of the relationship between corporate social and financial performance”. Strategic Management Journal, 29(12), pp. 1325-1343.
Brundtland, G. (1987). Report of the World Commission on Environment and Development: “Our Common Future”.
Center for International Environmental Law (2017). “The Production of Plastic and Petrochemical Feedstocks”. Fossils, Plastics & Petrochemical Feedstocks.
Chan, P.T., and Walter, T. (2014). “Investment performance of “environmentally friendly” firms and their initial public offers and seasoned equity offers”. Journal of Banking and Finance, 44, pp. 177-188.
Chen, J. and Lobo, A. (2012). “Organic food products in China: determinants of consumers’ purchase intentions”. The International Review of Retail Distribution and Consumer Research. 22, pp. 293-314.
Chen, T. B. and Chai, T. C. (2010). “Attitude towards the Environment and Green Products”. Management Science and Engineering Vol.4 No.2.
Cova, B. and Cova, V. (2002). “Tribal Marketing: The Tribalisation of Society and its Impact on the Conduct of Marketing”. European Journal of Marketing, 36 (5-6), pp. 595–620.
Dasgupta, S., Laplante, B., Wang, H., and Wheeler, D. (2002). “Confronting the environmental kuznets Curve”. Journal Econ. Perspect. 16, pp. 147–168.
Doran C. J. (2009). “The role of personal values in fair trade consumption”. Journal of Business Ethics, 84 (4), pp. 549-563.
Rui Coelho – Nova School of Business and Economics 27 Eccles, R., Ioannou, I., and Serafeim, G. (2012). “The Impact of Corporate Culture of Sustainability
on Corporate Behavior and Performance”. SSRN Electronic Journal.
Eze, J.C., Nweze, A.U., and Enekwe, C.I. (2016). “The Effects of Environmental Accounting on a Developing Nation: Nigerian Experience”. European Journal of Accounting, Auditing and Finance Research, 4(1), pp. 17-27.
Freeman, R. E., Harrison, J. S., and Wicks, A. C. (2007). “Managing for stakeholders: survival, reputation, and success”. New Haven, CT Yale Univ Press.
Gleim, M. R., Smith, J. S., Andrews, D., and Cronin, J. J. (2013). “Against the Green: A Multi-method Examination of the Barriers to Green Consumption”. Journal of Retailing, 89(1), pp. 44–61.
Grossman, G. M. and Krueger, A. B. (1991). “Environmental impacts of a North American Free Trade Agreement”. National Bureau of Economic Research Working Paper 3914, NBER, Cambridge MA, United States.
Gupta, S., and Ogden, D. T. (2009). “To Buy or Not to Buy - A Social Dilemma Perspective on Green Buying”. Journal of Consumer Marketing. 26, pp.376-391.
Hamilton, J. D. (2010). "Historical Oil Shocks". National Bureau of Economic Research Working Paper No. w16790. San Diego, United States.
Hillman, A., and Keim, G. (2001). “Shareholder value, stakeholder management, and social issues: What's the bottom line?”. Strategic Management Journal, 22(2), pp. 125-139.
IEA (2018). “World Energy Outlook 2018”. Paris, International Energy Agency (IEA), Organisation of Economic Co-Operation and Development (OECD).
Imai, M. (1986). “Kaizen: The Key to Japan’s Competitive Success”. McGraw-Hill Publishing Company.
Joshi, Y., and Rahman, Z. (2015). “Factors Affecting Green Purchase Behaviour and Future Research Directions”. Technology Analysis and Strategic Management.
Kapferer, J.N. (2008). “The new strategic brand management; Creating and sustaining brand equity long term”. 4th edition, Kogan page Limited, London and Philadelphia.
Keller, K. L. (2002). “Branding and Brand Equity, MSI Relevant Knowledge Series”. Cambridge MA: Marketing Science Institute.
Khan, M., G. Serafeim and A. Yoon. (2015). “Corporate Sustainability: First Evidence on Materiality”. Accounting Review, Vol. 91, No. 6, pp. 1697-1724.
Konar, S., and Cohen, M. A. (2001). “Does The Market Value Environmental Performance?”. Review of Economics and Statistics 83(2), pp. 281-289.
Kuznets, S. (1955). “Economic Growth and Income Inequality”. American Economic Review, Vol. 45, No. 1, pp. 1-28.
Rui Coelho – Nova School of Business and Economics 28 Makatouni A. (2002). “What motivates consumers to buy organic food in the UK? Results from a
qualitative study”. British Food Journal 104 (3/4/5), pp. 345–352.
Moisander, J. K. (2017). “Motivational Complexity of Green Consumerism”. International Journal of Consumer Studies, Vol. 31, No. 4, pp. 404-409.
Nelson, R. and Edmund S. Phelps. (1966). “Investment in Humans, Technological Diffusion, and Economic Growth”, American Economic Review, 56, pp. 69-75.
Ntanos, S., Kyriakopoulos, G., Chalikias, M., Arabatzis, G, and Skordoulis, M. (2018). “Public Perceptions and Willingness to Pay for Renewable Energy: A Case Study from Greece. Sustainability”.
OPOWER (2013). “Five Universal Truths about Energy Consumers”. United Kingdom.
Perman, R., and Stern, D. I. (2003). “Evidence from panel unit root and cointegration tests that the Environmental Kuznets curve does not exist”. Austr. J. Agric. Resource Econ. 47, pp. 325–347.
Pine II, B.J.; Gilmore J.H. (1998). “Welcome to the experience economy”. Harvard Business Review, 76 (4), pp. 97-105.
Rahbar, E., and Wahid, N. A. (2011). "Investigation of green marketing tools' effect on consumers' purchase behavior". Business Strategy Series, Vol. 12 Issue: 2, pp. 73-83.
Rifkin, J. (2014). “The zero marginal cost society: the internet of things, the collaborative commons, and the eclipse of capitalism”. 1st Edition, Palgrave Macmillan. New York. Slater, S. F. and Narver, J. C. (2000). “The Positive Effect of a Market Orientation on Business
Profitability: A Balanced Replication”. Journal of Business Research, 48, (1), pp. 69-73. The UN Global Compact (2005). “Who Cares Wins, Connecting Financial Markets to a Changing
World”. United Nations and Swiss Federal Department of Foreign Affairs.
Theodori, G.L. and Jackson-Smith, D. (2010). “Public Perception of the Oil and Gas Industry: The Good, the Bad, and the Ugly.”.
Trinks, A., Scholtens, B., Mulder, M., & Dam, L. (2017). “Divesting Fossil Fuels: The Implications for Investment Portfolios”. (SOM Research Reports; Vol. 17001-EEF). Groningen: University of Groningen, SOM research school.
Vermeir, I., and Verbeke, W. (2008). “Sustainable food consumption among young adults in Belgium: Theory of planned behaviour and the role of confidence and values”. Ecological Economics.
Woodruff, R. B. (1997). “Customer Value: The Next Source of Competitive Advantage”. Journal of the Academy of Marketing Science, 25, pp. 139-153.
Young, C. W., Hwang, K., McDonald, S., and Oates, C. (2010). “Sustainable consumption: green consumer behaviour when purchasing products”. Sustainable Development, 18 (1), pp. 18-31.
Rui Coelho – Nova School of Business and Economics 29
Other relevant references used for information provided in the Paper and Appendix
Bernstein (2018). “A Primer on oil and gas company valuation and investment”.
BoA Merrill Lynch (2018). “ESG: good companies can make good stocks”. Equity and Quant Strategy, United States.
BoA Merrill Lynch (2018). “The ABCs of ESG”. Equity and Quant Strategy, United States. Deutsche Bank (2013). “Oil & Gas for Beginners”. United Kingdom.
Ernst & Young (2017). “How can oil and gas fuel tomorrow as well as today?”. Gallup (2018). “Business and Industry Sector Ratings”.
Glass Packaging Institute (2014). “The Millennials: A Generation Invested in Health and the Environment”.
Goldman Sachs (2018). “A Revolution Rising - From low chatter to loud roar”. GS Sustain ESG Series.
IEA (2017). “The Future of Petrochemicals: Towards more sustainable plastics and fertilisers”. Paris, International Energy Agency (IEA), Organisation of Economic Co-Operation and Development (OECD).
IEA (2017). “World Energy Outlook 2017”. Paris, International Energy Agency (IEA), Organisation of Economic Co-Operation and Development (OECD).
IEA (2018). “World Energy Investment 2018”. Paris, International Energy Agency (IEA), Organisation of Economic Co-Operation and Development (OECD).
Jones, C. I. (2015). “The facts of economic growth”. Handbook of Macroeconomics, 2a, pp. 3–69. Lazard (2017). “Lazard’s Levelized Cost of Energy Analysis – Version 11.0” (Nov. 2017)
Stern, D., and Cleveland, C. (2004). “Energy and Economic Growth”.
The UN Global Compact (2014). “The Consumer Study: From Marketing to Mattering”. United Nations and Accenture CEO Study on Sustainability in collaboration with Havas Media.
Rui Coelho – Nova School of Business and Economics 30
Appendix
Scenario definition according to IEA:
“The World Energy Outlook-2018 (WEO-2018) presents projections for three core scenarios, which are differentiated primarily by their underlying assumptions about the evolution of energy-related government policies.
The New Policies Scenario (NPS) is the central scenario of this Outlook, and aims to provide a sense of the direction in which the most recent policy ambitions could take the energy sector. In addition to incorporating policies and measures that governments around the world have already put in place, it also takes into account the effects of announced policies, as expressed in official targets and plans. The Nationally Determined Contributions of the Paris Agreement provide important guidance regarding policy intentions, although some have been supplemented or superseded by more recent announcements. Given that “new policies” are by definition not yet fully reflected in legislation or regulation, the prospects and timing for their full realisation are based upon our assessment of the relevant political, regulatory, market, infrastructural and financial constraints.
The Current Policies Scenario (CPS) considers the impact of only those policies and measures that are firmly enshrined in legislation as of mid-2018. In addition, where existing policies target a range of outcomes, it is assumed that the lower end of the range is achieved. In this way, CPS provides a cautious assessment of where existing policies might lead the energy sector in the absence of additional impetus from governments. It provides a benchmark against which the impact of “new policies” can be measured.
The Sustainable Development Scenario (SDS) was introduced for the first time in the WEO- 2017. Unlike the other main scenarios, it starts from the objectives to be achieved and then assesses what combination of actions would deliver them. These objectives are derived from the Sustainable Development Goals (SDGs) of the United Nations, providing an energy sector pathway that achieves: universal access to affordable, reliable and modern energy services by 2030 (SDG 7.1); a substantial reduction in air pollution (SDG 3.9); and effective action to combat climate change (SDG 13). On the latter point, the Sustainable Development Scenario is fully aligned with the goal of the Paris Agreement to hold the increase in the global average temperature to well below 2 °C above pre-industrial levels. This scenario lays out an integrated strategy for the achievement of these important policy objectives, while also having a strong accent on energy security.” Retrieved from: IEA (2018). “World Energy Outlook 2018”. Paris, International Energy Agency (IEA), Organisation of Economic Co-Operation and Development (OECD).
Rui Coelho – Nova School of Business and Economics 31
Figure 1 Integrated Oil Company Value Chain Source: Based on Integrated Oil Companies portfolios
27% 32% 22% 5% 3% 10% 2% Coal Oil Gas Nuclear Hydro Bioenergy Other renewables
Figure 2 World's Current Energy Mix
Rui Coelho – Nova School of Business and Economics 32
Figure 3 Fluctuation of crude oil prices and periods of U.S. economic recession Source for data: BP, NBER/Federal Reserve Bank of St. Louis
Source for annotations: Hamilton, James “Historical Oil Shocks”, University of California, San Diego, Goldman Sachs Global Investment Research.
Note: 2014 value was computed as an average of the year until December 8, 2014
0 10,000 20,000 30,000 40,000 50,000 60,000 70,000 1970 1980 1990 2000 2010
Gross domestic product (GDP) USD/capita, 1963 – 2017
China O.C.D.E. E.U. 28 U.S.
Figure 4 Gross Domestic Product (GDP) per Capita, USD/capita
Source: OECD (2018), Gross domestic product (GDP) (indicator). doi: 10.1787/dc2f7aec-en (Accessed on 04 November 2018) Retrieved from: https://data.oecd.org/gdp/gross-domestic-product-gdp.htm
Rui Coelho – Nova School of Business and Economics 33 0 10,000 20,000 30,000 40,000 50,000 60,000 1980 1990 2000 2010 2020
Gross domestic product (GDP) USD/capita, 1980 – 2023 (Forecast) World E.U. Developed Countries Emerging Countries FORECAST
Figure 5 Gross Domestic Product (GDP) per Capita, USD/capita Source: IMF (2018), Gross domestic product (GDP), current prices. Retrieved from:
https://www.imf.org/external/datamapper/NGDPDPC@WEO/ADVEC/OEMDC/EURO/WEOWORLD?year=2018
Table 1 The World's Economic Growth Rate (%)
Year GDP per person ($/cap) Growth rate (%) Population (millions) Growth rate (%)
1 590 - 19 -1000 420 -0.03 21 0.01 1500 780 0.12 50 0.17 1820 1,240 0.15 125 0.28 1900 3,350 1.24 280 1.01 2006 26,200 1.94 627 0.76
Note: Growth rates are average annual growth rates in %, and GDP per person is measured in real 1990 dollars, for Europe and United States. Source: Data are from Maddison, A. 2008. Statistics on world population, GDP and per capita GDP, 1-2006 AD.
Rui Coelho – Nova School of Business and Economics 34
Table 2 The World's Expected GDP Growth Rate per Region (%)
2000-17 2017-25 2025-40 2016-40
North America 1.9% 2.1% 2.1% 2.1%
United States 1.8% 2.0% 2.0% 2.0%
Central & South America 2.7% 2.6% 3.0% 2.9%
Brazil 2.3% 2.3% 3.0% 2.8% Europe 1.8% 2.1% 1.6% 1.8% European Union 1.5% 1.8% 1.4% 1.6% Africa 4.4% 4.1% 4.4% 4.3% South Africa 2.8% 1.9% 2.8% 2.5% Middle East 4.1% 3.3% 3.5% 3.4% Eurasia 4.0% 2.2% 2.5% 2.4% Russia 3.4% 1.6% 2.1% 1.9% Asia Pacific 6.0% 5.4% 4.0% 4.5% China 9.1% 5.8% 3.7% 4.4% India 7.2% 7.8% 5.7% 6.5% Japan 0.8% 0.7% 0.7% 0.7% Southeast Asia 5.2% 5.3% 4.0% 4.5% World 3.6% 3.7% 3.3% 3.4%
Compound average annual growth rate
Note: Calculated based on GDP express in year-2017 dollars in purchasing power parity (PPP) terms. Source: International Monetary Fund (I.M.F., 2018); World Bank Database; IEA Database and Analysis
Table 3 The World’s Expected Population Growth Rate per Region (%)
2000-17 2017-25 2025-40 2017 2040 2017 2040
North America 1.0% 0.8% 0.7% 487 571 81% 87%
United States 0.9% 0.7% 0.6% 327 376 82% 87%
Central & South America 1.2% 0.8% 0.6% 516 599 81% 86%
Brazil 1.0% 0.6% 0.4% 209 232 86% 91% Europe 0.3% 0.1% 0.1% 690 700 75% 81% European Union 0.3% 0.1% 0.0% 512 513 75% 82% Africa 2.6% 2.4% 2.3% 1,256 2,100 42% 54% South Africa 1.4% 1.1% 0.9% 57 69 66% 76% Middle East 2.3% 1.6% 1.4% 237 323 71% 78% Eurasia 0.4% 0.4% 0.2% 232 243 65% 70% Russia -0.1% -0.1% -0.3% 144 136 74% 80% Asia Pacific 1.1% 0.7% 0.5% 4,098 4,636 47% 60% China 0.5% 0.3% 0.0% 1,392 1,401 58% 77% India 1.4% 1.0% 0.8% 1,339 1,605 34% 46% Japan 0.0% -0.3% -0.4% 126 114 92% 94% Southeast Asia 1.3% 1.0% 0.7% 646 766 48% 61% World 1.2% 1.0% 0.9% 7,516 9,172 55% 64%
Compound average annual growth rate Population (million) Urbanisation rate
Rui Coelho – Nova School of Business and Economics 35
Figure 6 Estimated Global GDP per Capita (USD/cap) compared to technological progress
Source: Angus Maddison, “Statistics on World Populations, GDP and GDP per Capita, 1-2008 AD”, The Maddison Project Database; McKinsey Global Institute Analysis
Figure 7 Global energy related CO2 emissions (Gt – Gigatons) Source: Data OECD and IEA (2017)
Figure 8 Dependence of the GINI Index on the Common Logarithm of GDP per Capita for 145 Countries
Note: All historical observations in period 1979-2008 are plotted. Curved line shows result of linear regression using the model function described by Equation (1). Straight line shows the mean GINI index calculated as arithmetic average of all entries. Source: WDI (2011), Analysis and computations made by Oksana Melikhova, Jakub Čížek.
Rui Coelho – Nova School of Business and Economics 36
Figure 9 Environmental Kuznets Curve (EKC) for SO2 emissions compared to Gross National Product (GNP) per Capita Source: Panayotou (1993) and Stern, Common, and Barbier (1996)
Figure 10 Relationship between electricity consumption and GDP per capita Note: GDP = gross domestic product; PPP = purchasing power parity. Source: IEA (2018), World Energy Outlook 2018
0% 10% 20% 30% 40% 50% 60% Job Creation Economic Growth Pollution Clean Energy Ending Corruption Poverty Reduction Climate Change Conservation of Wildlife Healthcare Access Inequality in access Peace and Security Hunger Relief Nutrition Education Reducing Nacional Debt
Critical challenges for bussiness to address
Figure 11 Challenges for businesses to address identified by consumers
Source: Data from Havas Media/Accenture survey of 30,000 consumers worldwide
Challenges related with Environment
Rui Coelho – Nova School of Business and Economics 37
Table 4 Key Purchaising Drivers for consumers
The products are made by a brand/company that I trust 62.0%
The product is known for its health & wellness benefits 59.0%
The product is made from fresh, natural and/or organic ingredients 57.0%
The product is from a company known for being environmentally friendly 45.0%
The product is from a company known for its commitment to social value 43.0%
The product’s packaging is environmentally friendly 41.0%
The product is from a company known for its commitment to my community 41.0%
I saw an ad on television about the social and/or environmental good the 34% product’s company is doing 34.0% Key purchsing drivers as weighted by all survey respondents
Source: Nielsen (2015), Global Sustainability Report, “The sustainability imperative, New insights on consumer expectations” Note:Key sustainability purchasing drivers were categorized as either “Very Heavy Influence” or “Heavy Influence” by the percentage of respondents
0% 10% 20% 30% 40% 50% 60% 70%
2013 2014 2015
Critical challenges for bussiness to address
Figure 12 Willingness to pay more for a sustainable product
Source: Nielsen (2015), Global Sustainability Report, “The sustainability imperative, New insights on consumer expectations”
Table 5 Environmental Concerns by Age Group
Environmental Concerns 21-35 36-45 46-55 55-65 Average
Landfills and dumps 42.6% 37.8% 40.1% 62.0% 62.0%
Threat of climate change 51.6% 46.2% 44.1% 59.0% 59.0%
Loss of natural resources 57.5% 57.4% 55.8% 57.0% 57.0%
Source: Glass Package Institute (2014), “The Millennials, A Generation Invested in Health and the Environment”
Table 6 Perceptions towards Sustainability by Age Group
Source: Glass Package Institute (2014), “The Millennials, A Generation Invested in Health and the Environment”
Perceptions towards Sustainability 21-35 36-45 46-55 55-65 Average
Little Changes Can Make a Big Environmental Impact 83.2% 81.1% 82.2% 77.2% 81.4%
Being Eco-Friendly Improves Quality of Life 83.2% 72.8% 72.1% 73.3% 76.5%
Look for Changes to Make Home/Lifestyle Greener 77.2% 76.1% 72.4% 66.9% 75.4%
It is Worth Paying More for Eco-Friendly Products 62.5% 48.5% 42.2% 39.9% 50.8%