Question order and context effects on multi-items scales questions
by
Paula Cristina Figueiredo Vieira
Dissertation submitted as a partial fulfillment of the requirements for the Degree of
Mestre em Estatística e Gestão de Informação (Master of Statistics and Information Management)
by
Instituto Superior de Estatística e Gestão de Informação of
Instituto Superior de Estatística e Gestão de Informação Universidade Nova de Lisboa
Question order and context effects on multi-items scales questions
Paula Cristina Figueiredo Vieira
Dissertation submitted as a partial fulfillment of the requirements for the Degree of Mestre em Estatística e Gestão de Informação
(Master of Statistics and Information Management)
Dissertation supervisor
Professor Doutor Pedro Simões Coelho
Lisboa November, 2011
ACKNOWLEDGEMENTS
First I wish to thank Professor Pedro Simões Coelho for accepting the invitation to be my supervisor and for his guidance throughout this dissertation.
A special acknowledgement to Professor Jörg Henseler for his support in this work and for kindly providing me a compilation of papers about question order effects.
I am truly grateful to my family and all my friends for the understanding and for helping me in so many ways.
And last but not least, I would like to thank Dário, for his support, assistance and for being always by my side.
ABSTRACT
This study examines question order effects, in particular context effect, on multiple-item scales questions and the impact that these effects can have in validity and reliability of measurement. For this purpose, it was performed a survey research with two versions of ECSI questionnaire, in which the position of the indicators of two constructs was changed. In the two groups of items studied, only one of them presented differences when they are grouped or separated in the questionnaire. Although even in this group of questions the effect is diminished, the results suggest that context effects are not necessarily negative for marketing research, since grouping related questions together can result in a higher correlation between them and, consequently, lead to a decrease of variation and an increase of reliability. However, the emergence of context effect seems to be closely related with question content and the level of similarity between the items. Future research should examine the generalization of these results across other service industries and with other question content.
KEYWORDS
Question order effect, context effects, question position, customer satisfaction, multi-item scales, validity and reliability.
RESUMO
Este estudo examina o efeito da ordem das perguntas, em particular o efeito de contexto, em questões de itens múltiplos e o impacto que estes efeitos podem ter na validade e fiabilidade das medidas. Com este propósito, foi realizado um estudo de mercado utilizando duas versões distintas do questionário ECSI, nas quais o posicionamento dos indicadores de dois construtos foi alterado. Nos dois grupos de questões estudados, apenas um deles apresentou diferenças comparando os resultados de quando os itens estão agrupados com os resultados de quando estão separados no questionário. Ainda que, neste grupo de perguntas o efeito seja diminuto, os resultados sugerem que os efeitos de contexto não têm necessariamente um efeito negativo para as pesquisas de marketing, uma vez que um agrupamento de questões relacionadas entre si, podem resultar numa maior correlação entre elas e, consequentemente, levar a uma diminuição da variação e a um aumento de fiabilidade. No entanto, o aparecimento de efeitos de contexto parece estar estreitamente relacionado com o teor dos itens e o nível de similaridade entre as questões. Para estudos futuros sugere-se que seja examinada a generalização destes resultados entre outros sectores de actividade e também com outras questões.
PALAVRAS-CHAVE
Efeito da ordem das questões, efeito de contexto, posição das questões, satisfação do cliente, escalas de itens múltiplos, validade e fiabilidade.
CONTENTS
ACKNOWLEDGEMENTS ... iii ABSTRACT ... iv KEYWORDS ... iv RESUMO ... v PALAVRAS-CHAVE ... v CONTENTS ... viLIST OF FIGURES ... vii
LIST OF TABLES ... viii
ACRONYMS LIST ... ix
1. INTRODUCTION ... 1
2. LITERATURE REVIEW... 3
2.1. Question order and context effects ... 3
2.2. Framework of question order and context effects on satisfaction studies ... 6
2.3. Research Hypotheses ... 8 3. METHODOLOGICAL APPROACH ... 10 3.1. Data Collection... 10 3.2. Operational Measures ... 14 4. RESULTS ... 16 4.1. Descriptive Analysis ... 16 4.2. Exploratory Analysis ... 19
4.3. Measurement reliability and validity... 21
5. DISCUSSION AND CONCLUSIONS ... 26
6. LIMITATIONS AND RECOMMENDATIONS FOR FURTHER RESEARCH ... 29
LIST OF FIGURES
LIST OF TABLES
Table 1 - Indicators of the measurement Model ... 13
Table 2 - Means, standard deviations and standardized loadings of manifest variables ... 18
Table 3 - Frequency distributions of responses % ... 20
Table 4 - Correlations between indicators of perceived value and loyalty ... 21
Table 5 - Reliability and validity measures ... 22
Table 6 - Correlations between latent variables and square roots of average variance extracted ... 23
Table 7 - Structural model results ... 24
ACRONYMS LIST
ACSI – American Customer Satisfaction Index AVE – Average Variance Extracted
CATI – Computer Administered Telephone Interviewing DK – Don’t know response
ECSI – European Customer Satisfaction Index LIT – Loyalty indicators together
NA – Not Applicable response PLS – Partial Least Squares RDD – Random Digit Dialing VIT – Value indicators together
1. INTRODUCTION
The propensity of survey responses to variations in questionnaire form, most notably question context and order effects, has been a concern of a variety of market research authors over the years. Welch & Swift (1992) defined order effect as the prejudicial impact that the order of presentation of a question, idea, answer, or product has on a respondent and it is well know that this effect can be a major source of measurement error in surveys (Schuman & Presser, 1981), although Perreault (1975) supports the idea that question order may have both positive and negative effects. A frequent approach in dealing with order effect biases is to use several forms of the same survey, for example, multiple randomized orderings or a frontward and backward order (Perrault, 1975; Bradlow & Fitzsimons, 2001; Ramirez & Straus, 2006). However, at the same time, the order in which questions are presented also may produce a context effect. In few words, context effects suggest that answers to survey questions can be affected by prior items, which may provide respondents with cognitive cues that are used to answer subsequent questions (Johnson et al., 1998). Numerous studies have confirmed that question context may influence survey responses (Schuman & Presser, 1981; Mcfarland, 1981; McClendon & O'Brien, 1988; Tourangeau & Rasinski, 1988; Tourangeau Singer & Presser, 2003).
One prerequisite for the emergence of context effects is that the items involved have some clear conceptual relation to each other (Tongereau, Singer & Presser, 2003). Satisfaction and service quality studies are often measured with multiple-item scales. This type of scales are typically used to represent complex psychological constructs that can't be summarized in a single question (e.g., attitudes, personality, loyalty and satisfaction), corresponding to the process of ranking results from a series of questions testing the same attribute in a variety of ways. In this way, it is more likely to be found a question context effect (Feldman & Lynch, 1988; Tongereau, Singer & Presser, 2003).
Few researches have looked at the effects that questions order may produce in surveys using multiple items scales (see Bradlow & Fitzsimons [2001] or DeMoranville & Bienstock [2003] as exceptions). In the pursuit of the highest quality survey data and the most accurate and actionable results, removing any bias that could potentially skew
the results, or, at least, understand the implications that context effect can bring to a marketing research, is of the utmost importance. So, the main purpose of this study is to prove if, the location of questions referring to the same block (construct) has or has not an effect on the answers of respondents (context effect) and the impact that it may have on their constructs (latent variables). Very few studies in the context literature have looked at the impact of context on the predictive validity of the attitude items (Tongereau, Singer & Presser, 2003), although DeMoranville, Bienstock & Judson (2008) already have affirm that “response reliability and validity appear to be affected by the order of survey questions”. Therefore it was also considered in this study the impact that the context question may have in the validity and reliability of responses. The reliability of the surveys instruments can be fairly easily assessed using measures of interrater reliability, internal consistency, or the Cronbach's Coefficient alpha (Randall & Gibson, 1990).
The structure of the paper is organized as follows. The next section analyzes the extant literature on question order and context effects, deriving the main Hypotheses of the study. The subsequent section describes the research design. The fourth section presents empirical results of the study, while the discussion on the main findings is presented in the fifth section. The final section identifies possible limitations and suggests areas for future research.
2. LITERATURE REVIEW
2.1. Question order and context effects
The results of a public opinion survey can be significantly affected by several factors, like the way in which questions are worded, the form in which they are presented, the administration mode (e.g. face-to-face or telephone interviews) and the order or context in which they are asked (Schwarz et al., 1991). For this reason, the effect of the order of questions and question context on questionnaires responses has been the focus of many researches over the last decades (Johnson et al., 1998).
Schuman & Presser (1981) explains that:
“Apart from sampling error, question order effects are probably the most frequently offered explanation for an unexpected or unreplicated survey finding. Since individual survey questions are not asked in isolation, but as part of a continuous flow of items, the context in which any questions appears, or its position in a sequence of items, may conceivably influence the answer given to it.”
Question order effects can be of two types: context and sequence. Context effects are those of consistency (when responses to later questions become more congruous due to an earlier stimulus) or contrast (when there is a greater difference due to ordering). Contrast effects are recognizable when the gap in ratings between the two items is larger in the comparative context than in the non comparative context, i.e., the opposite of consistency effects (Moore, 2002). In sum, “context effects refer to changes in the answers to a survey question as a function of the previous items in the questionnaire” (Tongereau, Singer & Presser, 2003). There have been mixed findings (Schuman & Presser, 1981) regarding the impact of either consistency or contrast on survey results (Welch & Swift, 1992). On the other hand, according to Schuman & Presser (1981), sequence effects can occur in three situations: owing to rapport (when the respondent relaxes during the interview and gives franker responses), fatigue (when the respondent starts getting tired and deliberates less on each question) and initial frame of reference (when the respondent has no evaluative reference point and therefore assigns extreme values). Rossi et al. (1993), cited by Ramirez & Straus (2006), describe also a saliency effect (question order could affect the saliency of certain topics by providing differential contexts within which responses are elicited) and a redundancy
effect (referring to effects that question order could be if questions are not grouped together by topic. For instance, “questions on the same topic in different parts of an interview could make respondents wonder if they are being asked the same questions again” Ramirez & Straus [2006]).
Nevertheless, these two concepts (context and sequence effects) are closely related since the context effect describes response changes regarding question order, information provision, and item rotation in the survey instrument which in turn may alter the context (Hsu, Fang & Li, 2007).
Tongereau & Rasinski (1988) determined that context can affect the interpretation of an attitude item in two main ways. One is that prior items can provide an interpretive framework for the later items, influencing the respondent's view of what issue the later item is supposed to be about. Another is that prior items can determine what is seen by the respondent as worth saying and what is seen as redundant. Both effects can influence responses to the later items.
However, the context effect is more likely to appear when the items are logically related, i.e., when the association among logically related items was made salient, people would attempt to reduce inconsistencies among their responses to the items (Tongereau & Rasinski, 1988). Also, according to Tongereau & Rasinski (1988), this may influence the size of the context effect because:
“The pressure to appear consistent or moderate is greater when the connection between the context and target items is obvious. When respondents care about the issue, heightening the connections among the items is likely to produce consistency effects; when respondents do not care about the issue, it is likely to produce moderation effects.”
In other words, if two highly similar items (e.g., two items in a multi-item scale measuring the same construct) are interspersed by n unrelated ones (i.e., items that do not explain the same issue) in a questionnaire, it may be quite likely that the earlier response would influence the latter one, with this likelihood being relatively insensitive to the size of n (that is, regardless of the number of issues separating the two similar items). If two mildly similar items (e.g., belief about an attribute of an object and overall evaluation of the same object) are separated by the same n unrelated items, one's propensity to retrieve the first one as a basis for the latter question may be lowered considerably if n is reasonably large. Though, if the two items are contiguous, judgment
recovery may be invoked even if the two items seem only moderately similar (Feldman & Lynch, 1988).
This theory contrasts with the results of Schuman & Presser (1981) in a consistency effects study, where they have concluded that “merely placing two questions with similar content next do each other does not necessarily create an order effect”. Such effect is only created if the respondents have a need to make their answers to the second question consistent with their answers to the first one.
In fact, Bradburn & Mason (1964) didn’t find consistency effects in a research with questions of self-report and self-evaluation. Their study regarding worries and happiness with five sections of questions about several aspects of life (marriage and family life, work experiences and satisfactions, general satisfaction and health, social participants, community and neighborhood), presents the questions ordered in four different combinations. They expected, for instance, that there should be a consistency effect when questions on marital happiness and job satisfaction appeared before ratings of over-all happiness. However, the rotation of the sections affected neither the marginal distribution of responses nor the correlations between the items, concluding that there was no consistency effect produced by the order of the questions.
On the opposite, DeMoranville & Bienstock (2003) found consistency effects (or what the authors refer as assimilation effects) on service measurement quality of three services (banking, hair salon and dental services), using the SERVQUAL instrument. SERVQUAL consists of several clear subscales or dimensions that contribute to an overall aggregate score or rating (i.e., tangibility, reliability, responsiveness, assurance, and empathy subscales all contribute to an overall perception of service quality). Their purpose was to examine which effect (assimilation or contrast) can occur when the specific items are asked prior to general questions and the reverse. They found assimilation effects for general questions which had a higher mean when asked after specific questions than when asked before, and contrast effects for specific questions which had a lower mean when asked after general questions than when asked before, although the contrast effects were found for only one service.
However there are several factors that can influence the emergence of questions order effects in surveys, like the mode of administration or the social demographics characteristics of the respondents. Most surveys that have consistency and contrast
effects are done by telephone (DeMoranville & Bienstock, 2003). It is expected, for instance, that question order effects are reduced or eliminated in mail or paper and pencil surveys, mainly because respondents have the opportunity of reading all of the questions before recording their responses. Secondly, because in self-administered surveys, respondents can go back and change answers to previous questions after reading a related question at a later point in the questionnaire (Ayidiya & McClendon, 1990), which telephone respondents can’t. Some studies have found these effects in mail surveys, but the effects are not consistent. For example, Ayidiya & McClendon (1990) found question order effects in mail surveys for newspaper reporter items but not for abortion items. The results of Bishop et al. (1988) also support the assumption that telephone surveys are more likely to present question order effects, comparing with other types of administration mode. They found that order effects which occurred in their telephone surveys were absent in the self-administered mode. The age of the respondents can also produce the appearance of context effects. For instance, Knäuper et al (2007) have found evidence that the content of preceding questions is less likely to remain accessible for older respondents, thus attenuating or eliminating their impact on answers to subsequent questions. Nonetheless, this decrease is a function of age-related chances in cognitive function, indexed by working memory capacity. Therefore, older adults with high working memory capacity showed the usually obtained question order effects, whereas no question order effects were observed for adults of with the same age, but with low working memory capacity.
2.2. Framework of question order and context effects on satisfaction studies
There is an extensive literature on question-context effects, whether questions asked (and answered) earlier in a questionnaire influence the answers to subsequent questions (e.g., Schuman & Presser 1981). However, in the framework of satisfaction surveys, little research has been conducted on question-context effects with regard to the measurement of satisfaction (Peterson & Wilson, 1992).
One of the exceptions are McClendon & O'Brien (1988) that have reported question order effects when measuring overall subjective well-being in eight specific
life domains. They found that whether the determinants of overall subjective well-being were asked before order effects in customer satisfaction modeling or after overall subjective well-being had a significant effect on the magnitude of the regression coefficients. Moreover, their study revealed that the closer the determinants were relative to the overall subjective well-being question, the greater the size of the regression coefficients. They suggested that a recency effect, along with an accessibility explanation, justifies these results.
Schul & Schiff (1993) found order effects when measuring satisfaction with customers of an Israel telecommunications company. They argue that the overall satisfaction evaluation is a linear combination of positive and negative evaluations of domain specific satisfaction ratings. When a general satisfaction question appears after questions about specific domains are asked, the earlier questions increase the accessibility of both positive and negative information, i.e., positive and negative evaluations of domain specific satisfaction questions are more or less equally represented in the overall satisfaction rating. In contrast, when overall satisfaction questions are asked prior to the domain specific satisfaction question, negative evaluations of domain specific satisfaction questions are more heavily represented in the overall satisfaction evaluation because of their greater accessibility.
Auh et al. (2003) studied how the order in which satisfaction survey data is collected affects the satisfaction model. They found that locating product attribute evaluations prior to overall evaluations of satisfaction and loyalty explain more variation (R2) and make positive satisfaction and loyalty evaluations more extreme. However, they expected that the model coefficients, or impact scores, associated with satisfaction drivers should be moderately greater when overall satisfaction is elicited after attribute ratings, because the overall ratings should be reflections of the attribute ratings, but the impact of satisfaction drivers showed to be relatively unaffected. Their empirical results are inconsistent with McClendon & O'Brien (1988) that found significant differences in the regression coefficients, indicating that the weights respondents give to the domains when answering the general well-being questions is affected by the order of the questions. The dependent variable in the McClendon and O'Brien (1988) study was subjective well-being whereas in Auh et al. (2003) study it
was cumulative satisfaction. Thus, the effect of question order on model parameters may depend on the nature of the dependent variable under investigation.
Moreover Kristensen & Eskildsen (2010) included an order effect factor in their study about the design of PLS structural modeling regarding satisfaction studies in general. So, in half of the cases the endogenous variables were listed first in the questionnaire and in the other half the exogenous variables are placed first. They discovered that the entire structure changed. In the case of placing the exogenous variables first the employee and social factors are the most important drivers of satisfaction, but in the case of listing the endogenous variables first the costumer factor dominates the rest of the drivers. With this results, they concluded that from a statistical point of view is not possible tell which solution is the correct one (if any), but this result informs the researcher that it is extremely important to have a subject theme discussion of the order of variables before the study is launched.
2.3. Research Hypotheses
Feldman & Lynch (1988) state that when any particular construct is measured in a questionnaire prior to another construct, multiple measures of the former will increase correlations with the latter. Also, Bradlow & Fitzsimons (2001) found that the correlation between items from the same subscale increases when they are grouped in the questionnaire. Cooper, Traugott & Lamias (2001), in their study about questionnaire format and design in web surveys, also supports this theory: the correlations among items appearing together on screen are constantly higher than items separated across numerous screams. By the same token, it can be expected in this study that when two items used to measure the same block are contiguous on the questionnaire, the correlations between these two items will increase, as stated in Hypotheses one.
Hypotheses 1: Correlations between indicators of the same construct are higher when the questions are placed together than the opposite.
In addition, Cooper, Traugott & Lamias (2001) examined the effect of multi-items versus single-item screens on item-missing data. Their results suggest that non-responses (or the choice of DK/NA option) are lower in multiple-item screen version
than in single-item screen version. Dickinson & Kirzner (1985) already have concluded that sequential question position has a significant relationship with item missing rate. However, their results indicate that questions appearing afterwards in a questionnaire and latter within their respective groups are less probable to be answered. By the literature mentioned, there can be expected two distinct effects on non-responses: on the one hand, grouping the related items can lead to a lower rate of non-responses; on the other hand the last item can have a higher non-response rate, even when the related items appear together. In one way or another, it can be expected to have an effect on missing-items rate. This expectation will be analyzed in this study as Hypotheses two.
Hypotheses 2: Non-response rate are lower when the questions are placed together than the opposite; or Non-response rate are higher for the last item.
Nevertheless, minor changes in the order of questions, the words used in question and item context can change both the distributions of the responses and the reliability of these responses (Schuman & Presser, 1981; Tongereau & Rasinski, 1988; Krosnick, 1991). Bradburn & Mason (1964) argued that the context provided by item order can not only influence attitude items individually but can also affect the responses distribution, although they didn’t found significant difference in response distributions in their study. Bradlow & Fitzsimons (2001) have argued that when multiple similar items appear together the reliability will be higher. This may occur because respondents find processing easier, observe greater item coherence, and have a greater ability to recognize similar items. These predictions will be analyzed in this paper, stated formally as Hypotheses three and four.
Hypotheses 3: Indicators have a different distribution when they are placed together than when they appear separated,
Hypotheses 4: constructs have a higher reliability and validity when theirs indicators are placed together than the opposite.
3. METHODOLOGICAL APPROACH
3.1. Data Collection
The data was collected from the 2010 wave of The Portuguese Customer Satisfaction Index (ECSI Portugal), through telephone interviews supported by a CATI system in Internet activity sector.
ECSI Portugal appeared in 1999, adapted from the Swedish Customer Satisfaction Index (Fornell, 1992) and it is compatible with the ACSI (American Customer Satisfaction Index) (Tenenhaus et al., 2005). The ECSI model is a system for measuring the quality of goods and services available in the national market through customer satisfaction and covers various sectors of economic activity (water distribution, insurance, retail banking, petrol stations, bottle gas, communications - which includes Internet, Cable TV, postal services, fixed phones and mobile phones - and public transportation).
The ECSI model is composed of two sub-models: the structural model and the measurement model. The structural model defines the relations between the latent variables (variables that are not directly observed but are rather inferred, through the measurement model, from other variables that are observed). Customer satisfaction is the central variable of this model, having as antecedents the image of the company, customer expectations, perceived quality of products and services and perceived value (see Figure 1). As consequences of customer satisfaction there are two variables: complaints and loyalty (Vilares & Coelho, 2005: 328-329).
Source: Vilares & Coelho (2005: 329)
Each latent variable is explained by a set of questions (indicators), which can be observed in Table 1 below. The measurement model relates the latent variables with the measurement variables. The indicators of the measurement model are measured with a 10 point interval scale. Interval scales is one of the most common ways of collecting data about the quality, satisfaction, intentions or attitudes of respondents towards certain products, services or companies (Vilares & Coelho, 2005: 95). The reasons behind the common use of this practice are the fact of it being easier and more viable to question about attitudes than to observe real behavior, and on the other hand, the common belief that attitudes can be seen as antecedents of behaviors (Coelho & Esteves, 2007).
ECSI model is considered an important economic indicator (Fornell, 1992), as well as an index with predictability of financial results (Vilares & Coelho, 2005: 334-335). For this reason it is important evaluate if the questionnaire design, namely the question order on multi-items scale questions, can have an impact in the validity and reliability of measurement. Perceived Quality Expectations Image Perceived Value Satisfaction Loyalty Complaints
The sampling design for this research is based on the random selection of all Portugal households with telephone, using random digit dialing (RDD). In each household the selection of a resident is also made randomly, based on which eligible resident has the most recent birthday study (Ball, Coelho & Vilares 2006). Also, the potential respondent must meet certain criterions defined at the beginning of the survey to be qualified, such as to have experience with the sector in study (generally, is considered at least six months) and not to be an employee of the industry in study (Ball, Coelho & Vilares 2006). All the items included in the survey are measured in a 10-point rating scale, between 1 meaning the lowest level and 10 the highest level.
The questionnaire includes a set of questions regarding the seven constructs of the structural ECSI model (image, expectations, perceived quality, perceived value, complaints, customer satisfaction and customer loyalty), plus a series of social demographic questions (Ball, Coelho & Vilares 2006).
For the study of question order effect on multiple-items scale questions, it was development two versions of ECSI questionnaire, altering the position of the perceived value indicators and Loyalty indicators. For the Mobile Internet industry the indicators of perceived value construct (y31: “Evaluation of price given quality” and y32: “Evaluation of quality given price”) were positioned not together, but in a different place of the questionnaire, whereas the indicators of loyalty construct (y61: “Intention of remaining as a customer” and y62: “Recommendation to colleagues and friends”) were placed together in the questionnaire. For the remaining companies in the Internet sector, the order of the Indicators was reversed, i.e., indicators of perceived value were put together and loyalty indicators were placed in different parts of the questionnaire.
After data cleaning and validation, the sample size was a total of 1242 interviews: 994 for Internet and 248 for Internet Mobile.
The sample spread over the main Internet and Mobile Internet operators in Portugal.
Table 1 - Indicators of the measurement Model
Latent Variable Indicators
Image x11 It is a reliable operator
x12 It is well established
x13 It gives a positive contribution to society
x14 It is concerned about its customers
x15It is innovative and forward looking
Expectations y11Expectations concerning overall quality
y12 Expectations concerning the fulfillment of personal needs
y13 Expectations concerning reliability
Perceived Quality y21 Perceived overall quality
y22Technical quality of the network
y23 Treatment and ability to advice
y24 Ability to solve technical problems
y25 Quality of products and services
y26 Diversity of products and services
y27 Reliability of products and services
y28 Clearness and transparency of information provided
y29 Clearness and transparency of tariffs
y20 Quality of treatment in store
Perceived Value y31 Evaluation of price given quality
y32 Evaluation of quality given price
Satisfaction y41 Overall satisfaction
y42 Fulfillment of expectations
y43 Distance to the ideal company
Complaints y51 Complaint handling
y52 Expectations of complaint handling
Loyalty y61 Intention of remaining as a customer
3.2. Operational Measures
All constructs in the proposal model are based on reflective multi-items scales. Indicators of image, expectations, perceived quality, perceived value, customer satisfaction, complaints and customer loyalty are similar to the ones used in the original ECSI model (Vilares & Coelho, 2005: 328). Nevertheless, the original ECSI model is well-established as a tool for measuring and explaining customer satisfaction and its antecedents and related constructs (Cassel & Eklof, 2001) have been validated across several European countries and many industries.
Partial Least Squares (PLS) Path Modeling was used to estimate both Internet and Mobile Internet models. This option is mainly due to the nature of the data, given that the variables presented are measured using interval numerical scales with an unknown frequency distribution. In fact, as Chin et al. (1996) stated “Partial Least Squares (PLS) can be a powerful method of analysis because of the minimal demands on measurement scales, sample size, and residual distributions.”
The PLS method is constituted by two steps: first estimates the observations of latent variables (constructs) and, second estimates the parameters of the structural equations and measurement model (Vilares, Almeida & Coelho 2010). Moreover, PLS has been applied very extensively in customer satisfaction studies, in particular PLS has been the standard estimation method in the framework of the ECSI and in the ACSI model (Tenenhaus et al., 2005).
The reliability and validity measurement of the indicators was assessed regarding their internal consistency reliability, composite reliability and average variance extracted (AVE). The usual criterion for internal consistency is Cronbach’s alpha (Cronbach, 1951), which provides an estimate for the reliability based on the indicator inter-correlations (Henseler, Ringle & Sinkovics, 2009). The composite reliability takes into attention that indicators have different loadings, and can be interpreted in the same way as Cronbach’s alpha. Whatever particular reliability coefficient is used, an internal consistency reliability value should be greater than 0.7 (Nunnally & Bernstein, 1994).
Average Variance Extracted is a measure proposed by Fornell & Larcker (1981) and intends to measure the total variance of an indicator explained by a given construct.
AVE should be at least equal to 0.5, ensuring that at least 50% of the variance of the indicators is explained (Vilares & Coelho, 2005: 268).
Reliability and convergent validity of the measurement can also be confirmed be analyzed standardized loadings for indicators. A loading reflects the correlation between original variables and derived factors. The factor loading squared is the percentage of observed variance in an item that is explained by this factor. Loadings should be greater than 0.7 (Oleksiak, 2009).
Lastly, correlations between latent variables should not be higher than the square roots of average variance extracted. (Ringle, Wende & Will, 2005).
The estimation and all data analyses were done using SmartPLS (Ringle, Wende & Will, 2005) and SAS System.
4. RESULTS
4.1. Descriptive Analysis
The following descriptive analysis is based on Internet (Value indicators
together) and Mobile Internet (Loyalty indicators together) samples. There is a higher
proportion of females respondents among Internet respondents (55,6%) and of males for Mobile Internet (60,5%). These costumers spread over all ages classes, however on Mobile Internet sample the higher percentage of respondents are in the younger’s age classes, while on the Internet there is a similar structure in each category range: less than 30 years old (30,4% for Internet and 40,7% for Mobile Internet); between 30 and 39 years (24,3% for Internet and 27,8% for Mobile Internet); between 40 and 49 years (21,8% for Internet and 14,9% for Mobile Internet) and 50 years or older (22,9% for Internet and 16,1%). As for the socio-professional profile of the respondents 62,6% of Internet costumers and 60,5% of Mobile Internet costumers are employed, in which 2,7% of Internet costumers and 2,6% of Mobile Internet costumers are employers, 8,2% of Internet respondents and 13,9% of Mobile Internet respondents are independent professionals, while 88,8% of Internet costumers and 83,4% of Mobile Internet costumers are employees. Of the remaining 40% that aren’t employed, 10,3% of Internet costumers and 8,5% of Mobile Internet costumers are retired, 8,5% of Internet costumers and 6,0% of Mobile Internet costumers are unemployed, 17,1% of Internet costumers and 23% of Mobile Internet costumers are students and 0,9% of Internet costumers and 1,6% of Mobile Internet costumers are housewives. Regarding the educational level, 29,2% of Internet costumers and 31,0% of Mobile Internet costumers have only basic education (9 or less years); 32,1% of Internet costumers and 34,3% of Mobile Internet costumers have secondary education (between 10 and 12 years) and 38,0% of Internet costumers and 33,9% of Mobile Internet costumers have university education (bachelor or more).
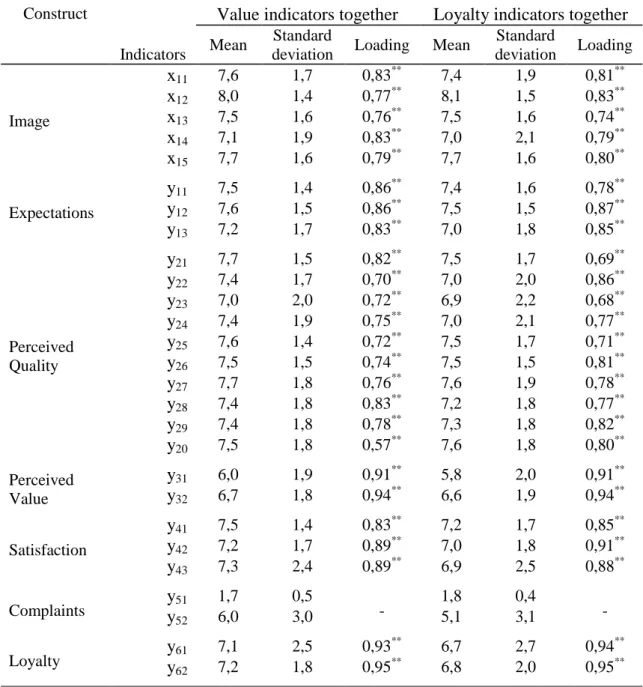
Means and standard deviations of the original variables can be observed in table 2. For both samples the highest means are found in image indicators and the lowest values are in complaints and perceived value. Also, in both samples the highest means
are in the indicator x12 (“The company is well established”) with a value of 8.0 for
Value indicators together group and 8.1 for Loyalty indicators together. On the other
side, the lowest means can be observed in the variables y51 (“Complaint handling”) with a mean of 1.7 for Value indicators together t and 1.8 for Loyalty indicators together; y52 (“Expectations of complaint handling”) with 6.0 for Value indicators together and 5.1 for Loyalty indicators together; and in the indicator y31 (“Evaluation of price given quality”) with a mean of 6.0 for Value indicators together and 5.8 for Loyalty indicators
together. The most significant differences between the means of the two data sets are
found in the indicators of loyalty and the indicator “Expectations of complaint handling” (y52) of the complaints construct, with Value indicators together group costumers showing higher perceptions.
On what standard deviations are concerned, in the Value indicators together the lowest values found was of 0.5 (y51 – “Complaint handling”) and 1.4 (x12 – “The company is well established”, y11 – “Expectations concerning overall quality”, y25 – “Quality of products and services” and y41 – “Overall satisfaction”) and the highest was 3.0 (y52 – “Expectations of complaint handling”) and 2.5 (y61 – “Intention of remaining as a customer”). For the Loyalty indicators together the lowest standard deviation are 0.4 (y51 – “Complaint handling”) and 1.5 (x12 – “The company is well established”, y12 – “Expectations concerning the fulfillment of personal needs” and y26 – “Diversity of products and services”). The highest values for this data set are 3.1 (y52 – “Expectations of complaint handling”) and 2.7 (y61 – “Intention of remaining as a customer”). Loyalty indicators are the ones that globally show highest standard deviations and the indicators of perceived value are the ones with the lowest variability. Globally, the Value
indicators together data set tends to present highest means and lower standard
Table 2 - Means, standard deviations and standardized loadings of manifest variables Construct
Indicators
Value indicators together Loyalty indicators together Mean Standard
deviation Loading Mean
Standard deviation Loading Image x11 7,6 1,7 0,83** 7,4 1,9 0,81** x12 8,0 1,4 0,77** 8,1 1,5 0,83** x13 7,5 1,6 0,76** 7,5 1,6 0,74** x14 7,1 1,9 0,83** 7,0 2,1 0,79** x15 7,7 1,6 0,79** 7,7 1,6 0,80** Expectations y11 7,5 1,4 0,86 ** 7,4 1,6 0,78** y12 7,6 1,5 0,86** 7,5 1,5 0,87** y13 7,2 1,7 0,83** 7,0 1,8 0,85** Perceived Quality y21 7,7 1,5 0,82** 7,5 1,7 0,69** y22 7,4 1,7 0,70** 7,0 2,0 0,86** y23 7,0 2,0 0,72** 6,9 2,2 0,68** y24 7,4 1,9 0,75** 7,0 2,1 0,77** y25 7,6 1,4 0,72** 7,5 1,7 0,71** y26 7,5 1,5 0,74** 7,5 1,5 0,81** y27 7,7 1,8 0,76** 7,6 1,9 0,78** y28 7,4 1,8 0,83 ** 7,2 1,8 0,77** y29 7,4 1,8 0,78** 7,3 1,8 0,82** y20 7,5 1,8 0,57** 7,6 1,8 0,80** Perceived Value y31 6,0 1,9 0,91** 5,8 2,0 0,91** y32 6,7 1,8 0,94** 6,6 1,9 0,94** Satisfaction y41 7,5 1,4 0,83** 7,2 1,7 0,85** y42 7,2 1,7 0,89** 7,0 1,8 0,91** y43 7,3 2,4 0,89** 6,9 2,5 0,88** Complaints y51 y 1,7 0,5 - 1,8 0,4 - 52 6,0 3,0 5,1 3,1 Loyalty y61 7,1 2,5 0,93 ** 6,7 2,7 0,94** y62 7,2 1,8 0,95** 6,8 2,0 0,95**
4.2. Exploratory Analysis
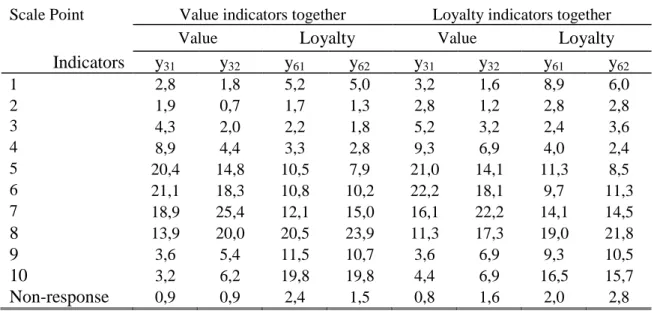
For a more exhaustive analysis of the indicators that were the subject of study, table 3 presents the frequency distributions of ratings assigned on the indicators of perceived value (y31: “Evaluation of price given quality” and y32: “Evaluation of quality given price”) and on the indicators of loyalty construct (y61: “Intention of remaining as a customer” and y62: “Recommendation to colleagues and friends”). In general, the perceived value indicators have a highest rate of responses in the 5 and 6 scale points, whereas the loyalty indicators shows higher response frequency in the 7 and 8 scale points. On what non-responses rates are concerned, the second value indicator and loyalty indicator (y32 and y62) have a high non-responses frequency for the Loyalty
indicators together data set, while the y31 value indicator and the y61 loyalty indicator have a high non-responses frequency for the Value indicators together sample, yet none of these differences are statistically significant (Z*< 1,645 for all indicators, not rejecting the null Hypotheses H0: pA - pB ≤ 0). In the light of these results, there is no evidence that the placement of indicators has an impact on non-responses rate, thus Hypotheses 2 (Non-response rate are lower when the questions are placed together than the opposite; or Non-response rate are higher for the last item) is not supported.
In order to assess whether the indicators have a different distribution in the two groups it was performed a chi square test for homogeneity. The results indicates that the null Hypotheses, which corresponds to the existence of the same distribution in both groups (H0: F(x) = G(x)), is rejected at a significance level of 5% for the loyalty indicators y61 (Q*=20,484> 18,307) and at a significance level of 1% for the loyalty indicator y62 (Q*=37,829> 23,209). The value indicators have the same distribution in both data sets, since the null Hypotheses is not rejected for this items (with Q*=4,148< 18,307 for y31 and with Q*=11,263< 18,307). Accordingly, Hypotheses 3 (Indicators have a different distribution when they are placed together than when they appear separated) is supported, but only for loyalty indicators.
Table 3 - Frequency distributions of responses %
Scale Point Value indicators together Loyalty indicators together
Value Loyalty Value Loyalty
Indicators y31 y32 y61 y62 y31 y32 y61 y62
1 2,8 1,8 5,2 5,0 3,2 1,6 8,9 6,0 2 1,9 0,7 1,7 1,3 2,8 1,2 2,8 2,8 3 4,3 2,0 2,2 1,8 5,2 3,2 2,4 3,6 4 8,9 4,4 3,3 2,8 9,3 6,9 4,0 2,4 5 20,4 14,8 10,5 7,9 21,0 14,1 11,3 8,5 6 21,1 18,3 10,8 10,2 22,2 18,1 9,7 11,3 7 18,9 25,4 12,1 15,0 16,1 22,2 14,1 14,5 8 13,9 20,0 20,5 23,9 11,3 17,3 19,0 21,8 9 3,6 5,4 11,5 10,7 3,6 6,9 9,3 10,5 10 3,2 6,2 19,8 19,8 4,4 6,9 16,5 15,7 Non-response 0,9 0,9 2,4 1,5 0,8 1,6 2,0 2,8
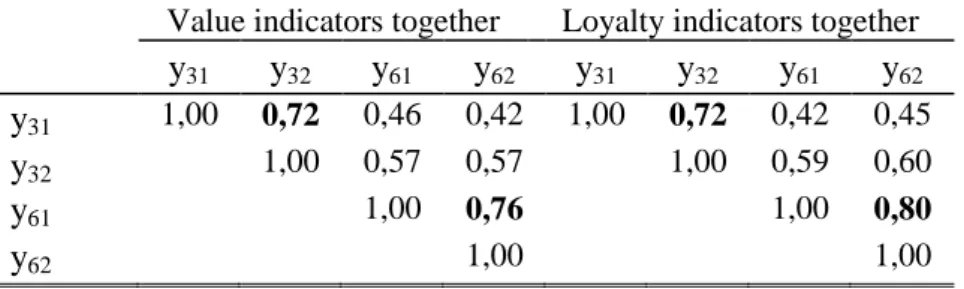
Table 4 shows the correlations between indicators of perceived value (y31 and y32) and indicators of loyalty (y61 and y62), highlighted in boldface. The correlation between y31: “Evaluation of price given quality” and y32: “Evaluation of quality given price” has the same value for both data sets (0.72). Nevertheless, the correlation between y61: “Intention of remaining as a customer” and y62: “Recommendation to colleagues and friends” is higher in the data set where these items are placed together (0.76 for VIT and 0.80 for LIT). Thus, H1 (Correlations between indicators of perceived value and loyalty are higher when the questions are placed together than the opposite) is partially supported. One possible explanation why the Hypotheses was supported for Loyalty but not for perceived value is that the indicators of perceived value are more conceptually related, so even when they are separated along the questionnaire, it is more likely that respondents related the two questions (explaining why they had the same correlation in both models). On the other hand, the loyalty indicators are not so similar. Though, when the items are placed together in the questionnaire, it is more probable that the respondents realize that they should be related. Consequently when the items are separated the correlation is lower than when they are asked together.
Table 4 - Correlations between indicators of perceived value and loyalty Value indicators together Loyalty indicators together
y31 y32 y61 y62 y31 y32 y61 y62
y31 1,00 0,72 0,46 0,42 1,00 0,72 0,42 0,45
y32 1,00 0,57 0,57 1,00 0,59 0,60
y61 1,00 0,76 1,00 0,80
y62 1,00 1,00
4.3. Measurement reliability and validity
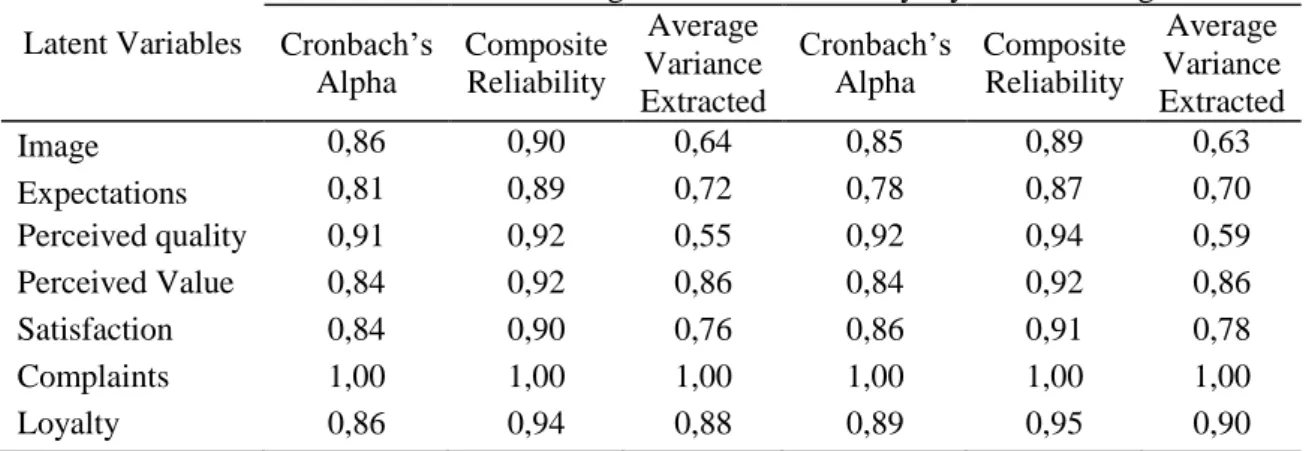
The reliability and internal validity measures for the model constructs was accessed by calculating the Cronbach’s Alphas, composite reliability and average variance extracted (AVE), as shown in Table 5. All Cronbach’s Alphas (Cronbach, 1951) exceed the 0.7 threshold recommended by Nunnally and Bernstein (1994) and are globally higher than 0.8. On what the composite reliability is concerned, every value in both samples are equal or above 0.87, showing a high internal consistency of indicators measuring each construct and confirming construct reliability (Fornell & Larcker, 1981). With regard to the average variance extracted (AVE) only the value of perceived quality construct is below 0.7 (either on Value indicators together or on Loyalty
indicators together) with the rest being higher than 0.7, implying that the variance
captured by each latent variable is significantly larger than the variance associated with measurement error. This proves that the latent variables are characterized by a high convergent validity.
Reliability and convergent validity of the measurement model was also confirmed by computing standardized loadings for indicators and Bootstrap t-statistics for their significance (Anderson & Gerbing, 1988; Henseler, Ringle & Sinkovics, 2009). As show in Table 2, almost all standardized loadings exceed the 0.7 threshold and are statistically significant at a 1% significance level, confirming a high convergent validity of the measurement model. All the standardized loadings of perceived value and loyalty indicators are higher than 0.9, but presents the same values in both samples.
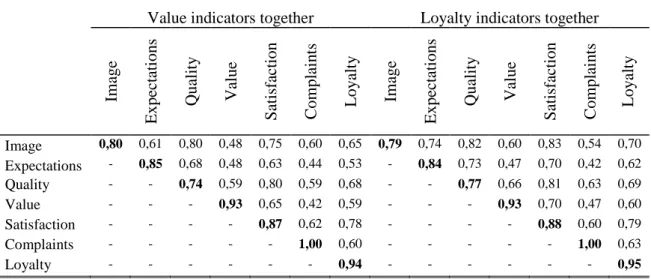
Discriminant validity is assessed determining whether each latent variable, or constructs, shares more variance with its own measurement than it does with other
constructs in the model (Fornell & Larcker, 1981). In the Table 6 it is compared the square root of the AVE for each construct with the correlations with all other constructs in the model. As observed, almost every one square roots of AVE (main diagonal values, highlighted in boldface) exceed the cross correlations between all other constructs, thus given further assurance of the validity of the latent variables. The exception occurs in the quality construct in both data sets, where the correlation with image is higher than the square root of AVE, indicating that this may not be sufficiently discriminable.
On what perceived value and loyalty constructs specifically are concerned, the values of Cronbach’s Alpha (0.86 for VIT against 0.89 for LIT), composite reliability (0.94 for VIT against 0.95 for LIT) and AVE (0.88 for VIT against 0.90 for LIT) are slightly higher for loyalty in Loyalty indicators together data set, however for the perceived value construct the reliability and internal validity measures are identical in both models. These results partially support the H4 (Perceived value and loyalty constructs have a higher reliability and validity when indicators are placed together than the opposite).
Table 5 - Reliability and validity measures
Latent Variables
Value indicators together Loyalty indicators together Cronbach’s Alpha Composite Reliability Average Variance Extracted Cronbach’s Alpha Composite Reliability Average Variance Extracted Image 0,86 0,90 0,64 0,85 0,89 0,63 Expectations 0,81 0,89 0,72 0,78 0,87 0,70 Perceived quality 0,91 0,92 0,55 0,92 0,94 0,59 Perceived Value 0,84 0,92 0,86 0,84 0,92 0,86 Satisfaction 0,84 0,90 0,76 0,86 0,91 0,78 Complaints 1,00 1,00 1,00 1,00 1,00 1,00 Loyalty 0,86 0,94 0,88 0,89 0,95 0,90
Table 6 - Correlations between latent variables and square roots of average variance
extracted
Value indicators together Loyalty indicators together
Im age Expect at ion s Q ual it y V al ue Sat isf act ion C om pl ai n ts Loyal ty Im age Expect at ion s Q ual it y V al ue Sat isf act ion C om pl ai n ts Loyal ty Image 0,80 0,61 0,80 0,48 0,75 0,60 0,65 0,79 0,74 0,82 0,60 0,83 0,54 0,70 Expectations - 0,85 0,68 0,48 0,63 0,44 0,53 - 0,84 0,73 0,47 0,70 0,42 0,62 Quality - - 0,74 0,59 0,80 0,59 0,68 - - 0,77 0,66 0,81 0,63 0,69 Value - - - 0,93 0,65 0,42 0,59 - - - 0,93 0,70 0,47 0,60 Satisfaction - - - - 0,87 0,62 0,78 - - - - 0,88 0,60 0,79 Complaints - - - 1,00 0,60 - - - 1,00 0,63 Loyalty - - - 0,94 - - - 0,95
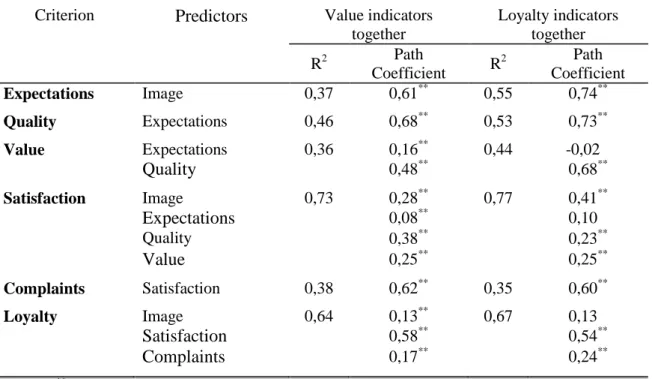
The explanatory power of the structural equations explaining each of the endogenous constructs (through determination coefficient R2) is showed in Table 7. The explanatory power of the latent variables range between 0.36 for perceived value and 0.73 for satisfaction on Value indicators together and between 0.44 for perceived value and 0.77 for satisfaction on Loyalty indicators together model. Also the loyalty constructed show a good explanatory power for the two data sets (0.64 for VIT and 0.67 for LIT). The explanatory power of the latent variables in Loyalty indicators together is higher than in the Value indicators together, with no exceptions.
Furthermore, Table 7 shows the estimates of path coefficients of the proposed model and their respective significance. For the Value indicators together data set all paths are statistically significant at 1% significance level for a two tailed test. On what the Loyalty indicators together data set is concerned, almost all path coefficients are significant at 1% significance level. The exceptions are the impact of expectations on perceived value and on satisfaction, and the impact of image on loyalty.
Table 7 - Structural model results
Criterion Predictors Value indicators together Loyalty indicators together R2 Path Coefficient R 2 Path Coefficient Expectations Image 0,37 0,61** 0,55 0,74** Quality Expectations 0,46 0,68** 0,53 0,73** Value Expectations 0,36 0,16** 0,44 -0,02** Quality 0,48** 0,68** Satisfaction Image 0,73 0,28** 0,77 0,41** Expectations 0,08** 0,10** Quality 0,38** 0,23** Value 0,25** 0,25** Complaints Satisfaction 0,38 0,62** 0,35 0,60** Loyalty Image 0,64 0,13** 0,67 0,13** Satisfaction 0,58** 0,54** Complaints 0,17** 0,24** **
: Significant at <0.01 level (Two-tailed test)
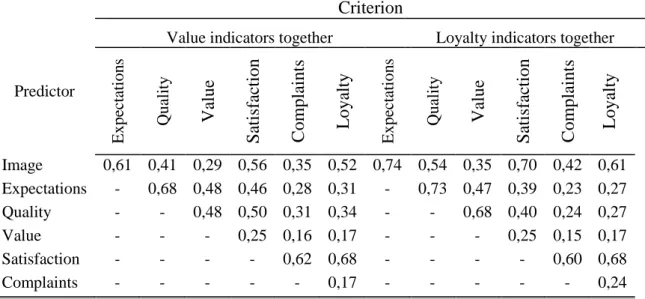
In table 8 the total effects (direct plus indirect effects) between constructs (origins of the effects in rows and destination in columns) are presented. From all the constructs, satisfaction is the one that has the highest total impact on customer loyalty (0.68 in VIT and in LIT). Image shows the second highest effect on customer loyalty for the Value indicators together (0.52) and Loyalty indicators together (0.61) data sets. On the other hand, perceived value is the construct that shows the lowest total effect on loyalty (0.17 for both samples).
Table 8 - Total Effects
Criterion
Predictor
Value indicators together Loyalty indicators together
Expect at ion s Q ual it y Va lue S ati sfa cti on C ompl aint s Loya lt y Expect at ion s Q ual it y Va lue S ati sfa cti on C ompl aint s Loya lt y Image 0,61 0,41 0,29 0,56 0,35 0,52 0,74 0,54 0,35 0,70 0,42 0,61 Expectations - 0,68 0,48 0,46 0,28 0,31 - 0,73 0,47 0,39 0,23 0,27 Quality - - 0,48 0,50 0,31 0,34 - - 0,68 0,40 0,24 0,27 Value - - - 0,25 0,16 0,17 - - - 0,25 0,15 0,17 Satisfaction - - - - 0,62 0,68 - - - - 0,60 0,68 Complaints - - - 0,17 - - - 0,24
5. DISCUSSION AND CONCLUSIONS
Question position is an important aspect of the art and science of questionnaire construction. Several authors have emphasized that changes in the mode of survey administration, in the words used, in the number of points offered by a ratings scale, in the order of responses alternatives or even in the order of questions can affect the responses and the results of a survey research (Schuman & Presser, 1981; Sigelman, 1981; Mcfarland, 1981; McClendon & O'Brien, 1988; Tongereau & Rasinski, 1988; Krosnick, 1991; Bishop & Smith, 2001; DeMoranville & Bienstock, 2003), Nevertheless, systematic research on question order effects has produced mixed results.
The current study examined the effect of the question position with multi-item scales on the measurement of the respective constructs using the ECSI model. In contrast with previous studies using multiple items questions, focusing on the effect resulting from changes in the placement of specific questions relative to general questions in the survey, this study focuses on the effect resulting of the position of two items that explain the same construct.
The ECSI model is composed by seven constructs, each one with several indicators to explain it. For this research, there was created two different questionnaire versions, altering the positioning of the two items that explain the perceived value construct and the two items that explain the loyalty construct.
In order to answer to the proposed Hypotheses were performed several tests, including analysis for correlations between related items in both versions, non-responses analysis, differences in non-responses distributions and the impact in the measures of reliability and validity of the constructs.
Generally, the results indicate that there is a context effect. However this effect is not so significant as could be expected. The position of items in the questionnaire did not reveal any effect on the perceived value indicators. The results for these indicators are identical in both samples for all the analysis performed, which could be explained in one of two ways: or the perceived value items are not influenced by the context, or on the other hand, even when the indicators are not together the prior item has impact in the response for the next one. Actually, Feldman & Lynch (1988) already have affirmed
that if two highly similar items are interspersed by others unrelated items in a questionnaire, it’s more likely that the earlier response would influence the second one, regardless the number of items that separates them.
Nevertheless, in what loyalty indicators are concerned, the results are different and seem to be present a context effect. In view of the fact that the two indicators that explain loyalty have a different behavior when they are placed together, comparing with when they are separated in the questionnaire.
According to Perreault (1975), in order to evaluate whether an order effect is present in a marketing research, both response rate and response distributions should be tested statistically to determine if there were differences between the two samples. For this reason, it was performed an analysis to test if the items position has an effect on responses distribution and on non-responses rate. The results showed that loyalty indicators have a significant different distribution, when they are grouped together or separated across the questionnaire. On what non-responses rates are concerned, no significant differences were found in the analysis of non-responses for loyalty items, or for value items. This result goes in opposition to the initial expectation and against the results of Cooper, Traugott & Lamias (2001) that found that DK/NA responses (i.e., non-responses) in the multiple-item screen version was significantly lower than for the single-item screen version. Obviously, it is need to be aware that there is a difference between web survey and telephone surveys (which was used in this study). However, the literature review reveals that telephone surveys are more likely to present question order effects.
Another purpose of this study was to evaluate the effect that item position might have on the reliability and validity of their construct. The reliability and internal validity for both models was verified. However, once again, loyalty indicators present differences between the two data sets, while value indicators have the same results in both models. The reliability and internal validity of loyalty construct are slightly higher when their indicators are placed together on the questionnaire. As Bradlow & Fitzsimons (2001) have argued, this may happen because grouping related items may turn the process easier to the respondent, since this may increase the ability to recognize the proximity between items.
In summary, question position may produce a context effect, however, this effect it’s not necessarily negative for the marketing research results. Indeed, in a multi-item scale questionnaire, grouping related questions together can result in a higher correlation between them and, consequently, lead to a decrease of variation and an increase of reliability. Though, the emergence of context effect is closely related with question content and the level of similarity between the items.
The main conclusion of this study is that grouping items has diminished context effects in the responses given by survey respondents.
6. LIMITATIONS AND RECOMMENDATIONS FOR FURTHER
RESEARCH
The research has been conducted in the Internet industry. However, the two questionnaire schemes were applied in two different sub industries of Internet, one for costumers of fixed internet companies, and another for costumers of mobile internet companies. As a consequence, the social demographics characteristics of the respondents in the two groups are not as similar as would be recommended. This situation brought some limitations to the study, in terms of possible analysis and in terms of conclusions, since some findings in this study could be explained by the difference of the two samples and not only by the context effect studied.
For future researches it is recommended the application of the two versions of the questionnaire in two similar groups of costumers from the same company. Also, future research should examine the generalization of these results across other industries.
In this study it was not found differences for perceived value indicators, however it is possible that the number of unrelated questions between the two related items make the context effect more obvious. Separating more the items across the questionnaire may display some differences, comparing with a sample with the items together.
Another interesting research, will be analyzing these effects in a questionnaire with more items by construct.
7. REFERENCES
Anderson, J. C., & Gerbing, D. W. (1988). Structural Equation Modeling in Practice: A Review and Recommended Two-Step Approach. Phychological Bulletin,
103(3), 411-423.
APQ, IPQ, & ISEGI. (2010). ECSI Portugal – Índice Nacional de Satisfação do
Cliente. URL: http://www.ecsiportugal.pt/ [Retrieved on August 8, 2010].
Auh, S., Salisbury, L. C., & Johnson, M. D. (2003). Order effects in Customer Satisfaction modelling. Journal of Marketing Management, 19, 379-400.
Aydiya, S. A., & McClendon, M. J. (1990). Response Effects in Mail Surveys. Public
Opinion Quarterly, 54, 229-247.
Ball, D., Coelho, P. S., & Vilares, M. (2006). Service Personalization and Loyalty.
Journal of Services Marketing, 20(6), 391-403.
Bishop, F., G., Hippler, H.-J., Schwarz, N., & Strack, F. (1988). A comparison of response effects in self administered and telephone surveys. In R. Groves (Ed.),
Telephone Survey Methodology (pp. 321-340). New York: Wiley.
Bishop, G., & Smith, A. (2001). Response-Order Effects and the Early Gallup Split-Ballots. [Article]. Public Opinion Quarterly, 65(4), 479-505.
Bradburn, N. M., & Manson, W. M. (1964). The Effect of Question Order on Responses. Journal of Marketing Research, 1(4), 57-61.
Bradlow, E. T., & Fitzsimons, G. J. (2001). Subscale Distance and Item Clustering Effects in Self-Administered Surveys: A New Metric. Journal of Marketing
Research, 38, 254-261.
Cassel, C., & Eklof, J. A. (2001). Modelling customer satisfaction and loyalty on aggregate levels: Experience from the ECSI pilot study. Total Quality
Management, 12(7/8), 834-841.
Chin, W. W., Marcolin, B. L., & Newsted, P. R. (1996). A Partial Least Squares latent
variable modeling approach for measuring interaction effects: Results from a Monte Carlo simulation study and voice mail emotion/adoption study. Paper
presented at the Seventeenth International Conference on Information Systems, Cleveland, Ohio.
Coelho, P. S., & Esteves, S. P. (2007). The Choice Between a Five-point and a Ten-point Scale in the Framework of Customer Satisfaction Research. International
Journal of Market Research, 49(3), 313-339.
Couper, M. P., Traugott, M. W., & Lamias, M. J. (2001). Web Survey Design and Administration. Public Opinion Quarterly, 65, 230-253.
Cronbach, L. J. (1951). Coefficient Alpha and the Internal Structure of Tests.
Psychometrika, 16(3), 297-334.
DeMonraville, C. W., & Bienstock, C. C. (2003). Question order effects in measuring service quality. International Journal of Research in Marketing, 20, 217-231. DeMoranville, C. W., Bienstock, C. C., & Judson, K. (2008). Using question order for
predictive service quality measures. Journal of Services Marketing, 22(3), 255-262.
Dickinson, J. R., & kirzner, E. (1985). Questionnaire Item Omission as a Function of Within-Group Question Position. Journal of Business Research, 13, 71-75. Feldman, J. M., & Lynch, J. G. J. (1988). Self-Generated Validity and Other Effects of
Measurement on Belief, Attitude, Intention, and Behavior. Journal of Applied
Psychology, 73(3), 421-435.
Fornell, C. (1992). A National Customer Satisfaction Barometer. The Swedish Experience. Journal of Marketing, 56(1), 6-21.
Fornell, C., & Larcker, D. F. (1981). Evaluating Structural Equation Models with Unobservable Variables and Measurement Error. Journal of Marketing
Research, 18, 39-50.
Henseler, J., Ringle, C. M., & Sinkovics, R. R. (2009). The Use of Partial Least Squares Path Modeling in International Marketing. In R. R. G. Sinkovics, P.N. (eds.) (Ed.), Advances in International Marketing (Vol. 20, pp. 277-319): Emerald Group Publishing Limited.
Hsu, Y.-C., Fang, C.-P., & Li, C.-L. (2007). Context and question order effects on measures of satisfaction: the case of whitewater rafters in Taiwan. Journal
Forest Snow and Landscape Research, 81(1), 89-98.
Johnson, T., Rourke, D., & Severns, E. (1998). Effects of Question Context and Response Order on Atittude Questions. 857-860. Retrieved from American
http://www.amstat.org/sections/srms/proceedings/
Knäuper, B., Schwarz, N., Park, D., & Fritsch, A. (2007). The Perils of Interpreting Age Differences in Attitude Reports: Question Order Effects Decrease with Age.
Journal of Official Statistics, 23(4), 515-528.
Kristensen, K., & Eskildsen, J. (2010). Design of PLS - Based satisfaction studies. In W. W. C. V. Esposito Vinzi, J. Henseler & H. Wang (Ed.), Handbook of partial
least squares: Concepts, methods, and applications (pp. 247-277). Berlim:
Springer.
Krosnick, J. A. (1991). Response Strategies for Coping with the Cognitive Demands of Attitude Measures in Surveys. Applied Cognitive Psychology, 5(213-236). McClendon, M. J., & O'Brien, D. J. (1988). Question-order effects on the determinants
of subjective well-being. Public Opinion Quarterly, 52, 351-364.
Moore, D. W. (2002). Measuring New Types of Question-Order Effects Additive and Subtractive. [Article]. Public Opinion Quarterly, 66(1), 80-91.
Nunnally, J. C., & Bernstein, K. L. (Eds.). (1994). Psychometric Theory (3rd ed.). New York: McGraw Hill.
Oleksiak, M. (2009). Satisfaction Drivers in Retail Banking: Comparison of Partial Least Squares and Covariance Based Methods. Central European Journal of
Economic Modelling and Econometrics, 1, 83-102.
Perreault, W. (1975). Controlling Order-Effect Bias. Public Opinion Quarterly, 39, 544-551.
Peterson, R. A., & Wilson, W. R. (1992). Measuring Customer Satisfaction: Fact and Artifact. Journal of the Academy of Marketing Science, 20(1), 61-71.
Ramirez, I. L., & Straus, M. A. (2006). The Effect of Question Order on Disclosure of Intimate Partener Violence: An Experimental Test Using the Conflict Tactics Scales. Journal of Family Violence, 21(1).
Randall, D. M., & Gibson, A. M. (1990). Metodology in Business Ethics Research: A review and critical assessment. Journal of Bussines Ethics, 9, 457-471.
Ringle, C., Wende, S., & Will, A. (2005). SmartPLS 2.0 M3. Available at http://www.smartpls.de.
Schul, Y., & Schiff, M. (1993). Measuring Satisfaction with organizations - Predictions from information accessibility. Public Opinion Quarterly, 57, 536-551.