Rita Afonso de Moura Mendes
Mestrado em Biologia e Gestão da Qualidade da Água
Departamento de Biologia 2014
Orientador
Agostinho Antunes Pereira, Professor Auxiliar Convidado, Faculdade de Ciências da Universidade do Porto
Coorientador
Vitor Manuel de Oliveira e Vasconcelos, Professor Catedrático, Faculdade de Ciências da Universidade do Porto
Cyanotoxin
detection in
freshwater
systems from the
North and Center
of Portugal
Todas as correções determinadas pelo júri, e só essas, foram efetuadas. O Presidente do Júri,
Acknowledgments
I would like to acknowledge several people that in some way contributed to this thesis:
Firstly, I would like to thank my supervisor, Prof. Dr. Agostinho Antunes for his supervision and advices given during the development of this thesis.
I would also like to thank my co-advisor, Professor Dr. Vitor Vasconcelos, for welcoming me into his group with such warmth.
To Fundação para a Ciência e Tecnologia (FCT), for all the support through the projects: PesT-C/MAR/LA0015/2013, PTDC/AAC-AMB/104983/2008 008610) and PTDC/AAC-CLI/116122/2009 (FCOMP-01-0124-FEDER-014029)
To all the staff from the Laboratory of Ecotoxicology, Genomics and Evolution (LEGE) of the Interdisciplinary Center for Marine and Environmental Research (CIIMAR) for the good working environment that was provided and also especial thanks to Cristiana for the fantastic opportunity to work with cyanotoxins, the transmitted knowledge, the patience, time and support; to Joana Azevedo for all the assistance in HPLC and LC-MS analysis, the sympathy and all the time spent in teaching and helping me to understand those methods; to Micaela for all the help provided in the performance of ELISA assays; to Catarina and Joana for all the advices given during this thesis, the laughs and tears, the affection, the friendship and for showing me that great friends sometimes are at where we least expect; to Mafalda for the friendship, the talks, the spectacular lunch breaks and for the effort in convincing me to be a healthier person while eating chocolates; and to Ana, Catarina, Tiago and Susana for all the companionship and support given throughout the thesis.
To Daniela, my housemate, for all the meals cooked, the long talks, the chocolates and cakes brought when I was so stressed out and, more importantly, for the effort you made to understand my field of study so you could help me as much as possible.
To Leila, João, Bruno, Tânia, Sara and Telmo for the friendship, the support, the laughter, for always listening to me and cheering me up, for being so proud of me and for showing me that despite the distance, you are still my family.
Finally, I would like to thank my parents for their unconditional love, all the support and advices, for always being there for me, celebrating my personal achievements and uplifting me in my saddest moments. I don’t think that there are enough words to describe how thankful I am for everything they have done for me to be in this position today.
Abstract
In recent years, freshwater ecosystems have undergone changes in their physical, chemical and biological properties due to eutrophication processes. The increase of nutritive compounds in the water leads to an accelerated growth of all aquatic productivity, especially in the cyanobacteria communities. The densification of the cyanobacteria community in the water surface leads to the production of cyanotoxins, secondary metabolites that contribute to the degradation of the water quality and has serious consequences for both the environment, animal and human health. With a high variety of chemical variants and several degrees of toxicity, cyanotoxins can be grouped according to their mode of action in hepatotoxins (microcystins, nodularins), cytotoxins (cylindrospermopsin), neurotoxins (anatoxin-a, saxitoxin) and dermatotoxins (lyngbyatoxin, aplysiatoxin). The aim of this study is to detect the presence of microcystins, cylindrospermopsin, anatoxin-a and saxitoxin in freshwater systems from the North and Center of Portugal, through chemical, biochemical and molecular methods. To achieve such goal, environmental samples from seven freshwater systems from the North and Center of Portugal were analyzed for the presence of amplified fragments of genes involved in cyanotoxin biosynthesis (molecular methods) and, when those fragments were present, samples were quantified in order to detect and quantify toxins, through chemical and biochemical methods. The results showed the presence of microcystins, cylindrospermopsin, anatoxin-a and saxitoxin in the studied freshwater systems and the potential for their production by the cyanobacteria genera present in the water environment. Also the efficiency of the molecular methods in monitoring programs to detect the presence of cyanotoxins and their producing cyanobacteria genera revealed to be an effective and valuable tool. In the absence of other information about the presence of anatoxin-a, cylindrospermopsin and saxitoxin in Portuguese freshwater systems, this study constitutes the first report of the presence of these cyanotoxins in Portuguese freshwater systems.
Keywords: Eutrophication, Cyanobacteria, Cyanotoxins, Methods for cyanotoxin detection
Resumo
Nos últimos anos, os sistemas aquáticos têm sofrido alterações nas suas propriedades físicas, químicas e biológicas, devido aos fenómenos de eutrofização que se registam nesses mesmos sistemas. O aumento dos compostos nutritivos na água leva a um crescimento exponencial de toda a produtividade aquática, especialmente das comunidades de cianobactérias. A densificação destas comunidades nas superfícies dos recursos aquáticos leva à produção de metabolitos secundários – cianotoxinas – que contribuem ativamente para a degradação da qualidade da água e originam graves consequências a nível de saúde ambiental, animal e humana. Com uma elevada variedade de isoformas químicas e diversos graus de toxicidade, as cianotoxinas podem ser agrupadas de acordo com o seu modo de ação em hepatotoxinas (microcistinas, nodularina), citotoxinas (cilindrospermopsina), neurotoxinas (anatoxina-a, saxitoxina) e dermatotoxinas (aplisiotoxina, lingbiatoxina). Assim, o objetivo deste estudo é a deteção da presença de microcistina, cilindrospermopsina, anatoxina-a e saxitoxina em sistemas aquáticos de água doce nas regiões Norte e Centro de Portugal, através de métodos químicos, bioquímicos e moleculares. Para tal, amostras ambientais de sete pontos de amostragem das regiões Norte e Centro foram analisadas para a presença de genes envolvidos na síntese de cianotoxinas através de métodos moleculares; seguidamente, e em caso de presença desses fragmentos, as amostras foram quantificadas com recurso a métodos químicos e bioquímicos, de modo a quantificar a toxina presente no meio. Os resultados mostram a presença de microcistina, cilindrospermopsina, anatoxina-a e saxitoxina nos diversos pontos de amostragem e a presença de géneros potencialmente produtores no meio aquático. Paralelamente, a eficácia dos métodos moleculares como medida inicial de monitorização dos pontos de amostragem para a presença de cianotoxinas e respetivos géneros produtores mostrou ser bastante fiável. Na ausência de bibliografia que reporte a presença de anatoxina-a, cilindrospermopsina e saxitoxina em sistemas aquáticos portugueses, e dado os dados obtidos, este estudo apresenta-se como sendo o primeiro a relatar a presença destas cianotoxinas em sistemas de água doce Portuguesas.
Palavras-chave: Eutrofização, Cianobactérias, Cianotoxinas, Métodos de detecção de cianotoxinas
Table of contents
Acknowledgments ... i
Abstract ... iii
Resumo ... iv
List of Tables... vii
List of Figures ... viii
List of Abbreviations ... xi 1. Introduction ... 1 1.1. General concepts ... 1 1.2. Cyanotoxins ... 2 1.2.1. Microcystins ... 3 1.2.2. Cylindrospermopsin ... 5 1.2.3. Anatoxin-a ... 7 1.2.4. Saxitoxin ... 8
1.3. Methods for cyanotoxin research ... 10
1.3.1. Chemical methods ... 11
1.3.2. Biochemical methods ... 12
1.3.3. Molecular methods ... 12
1.4. Objectives ... 13
2. Materials and Methods ... 14
2.1. Study Area ... 14
2.1.1. Torrão Reservoir (Tâmega River) ... 14
2.1.2. Parque Fluvial do Tâmega (Tâmega River) ... 14
2.1.4. Vela Lake ... 16
2.1.5. Mira Lake ... 17
2.2. Sample collection and treatment ... 18
2.3. Molecular analysis ... 19
2.3.2. PCR amplification ... 20
2.4. Immunological assays (ELISA tests) ... 23
2.4.1. Sample preparation ... 23
2.4.2. ELISA quantification assays ... 23
2.5. Chemical analysis ... 26
2.5.1. Sample preparation ... 26
2.5.2. Detection and quantification by HPLC-PDA ... 27
2.5.3. Detection by LC-MS ... 27 2.6. Statistical analysis ... 28 3. Results ... 28 3.1. Physical/Chemical parameters... 28 3.1.1. Temperature ... 28 3.1.2. pH ... 30 3.2. PCR amplification ... 35
3.3. ELISA quantification assays ... 42
3.4. Detection and quantification by HPLC-PDA ... 48
3.5. Quantification by LC-MS ... 51 4. Discussion ... 53 5. Conclusion ... 59 6. Future Perspectives ... 60 7. Communcations ... 61 References ... 62
List of Tables
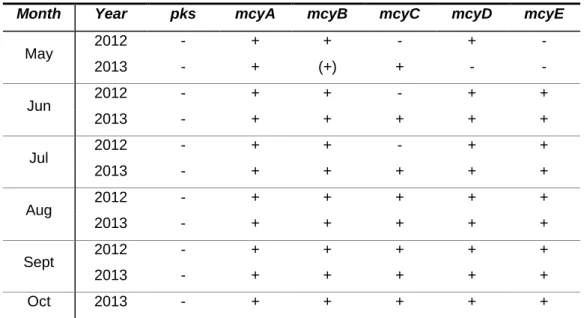
Table 1. Primer sets used in the PCR amplifications. ... 21 Table 2. Detection of amplified fragments implicated in hepatatoxins biosynthesis from samples of Torrão Reservoir. ... 35 Table 3. Detection of amplified fragments implicated in hepatatoxins biosynthesis from samples of Parque Fluvial do Tâmega. ... 36 Table 4. Detection of amplified fragments implicated in hepatatoxins biosynthesis from samples of Parque da Cidade do Porto Lake 1. ... 36 Table 5. Detection of amplified fragments implicated in hepatatoxins biosynthesis from samples of Parque da Cidade do Porto Lake 2. ... 37 Table 6. Detection of amplified fragments implicated in hepatatoxins biosynthesis from samples of Parque da Cidade do Porto Lake 3. ... 37 Table 7. Detection of amplified fragments implicated in hepatatoxins biosynthesis from samples of Vela Lake. ... 38 Table 8. Detection of amplified fragments implicated in hepatatoxins biosynthesis from samples of Mira Lake. ... 38 Table 9. Detection of amplified fragments implicated in neurotoxin biosynthesis from samples of Torrão Reservoir. ... 39 Table 10. Detection of amplified fragments implicated in neurotoxin biosynthesis from samples of Parque Fluvial do Tâmega. ... 39 Table 11. Detection of amplified fragments implicated in neurotoxin biosynthesis from samples of Parque da Cidade do Porto Lake 1. ... 40 Table 12. Detection of amplified fragments implicated in neurotoxin biosynthesis from samples of Parque da Cidade do Porto Lake 2. ... 40 Table 13. Detection of amplified fragments implicated in neurotoxin biosynthesis from samples of Parque da Cidade do Porto Lake 3. ... 41 Table 14. Detection of amplified fragments implicated in neurotoxin biosynthesis from samples of Vela Lake. ... 41 Table 15. Detection of amplified fragments implicated in neurotoxin biosynthesis from samples of Mira Lake. ... 42
List of Figures
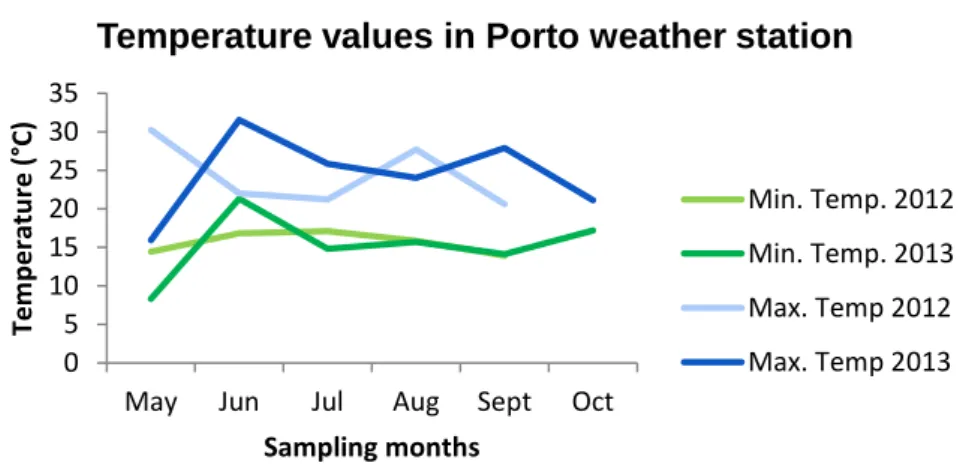
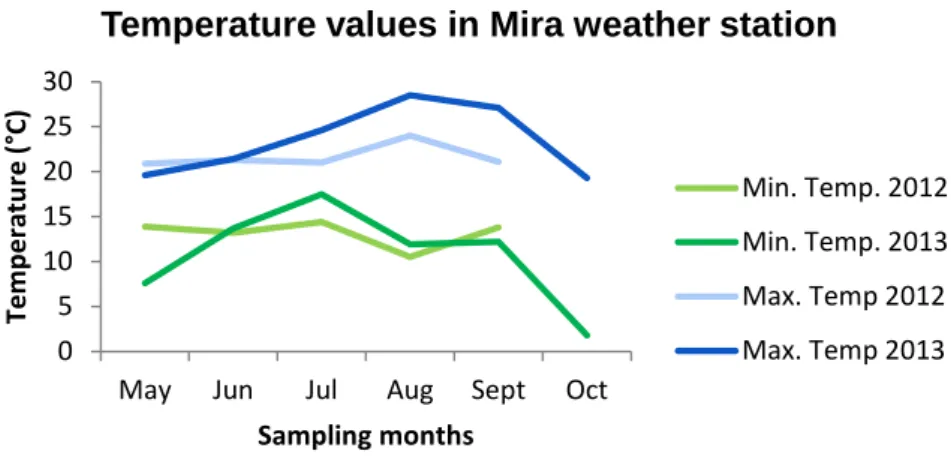
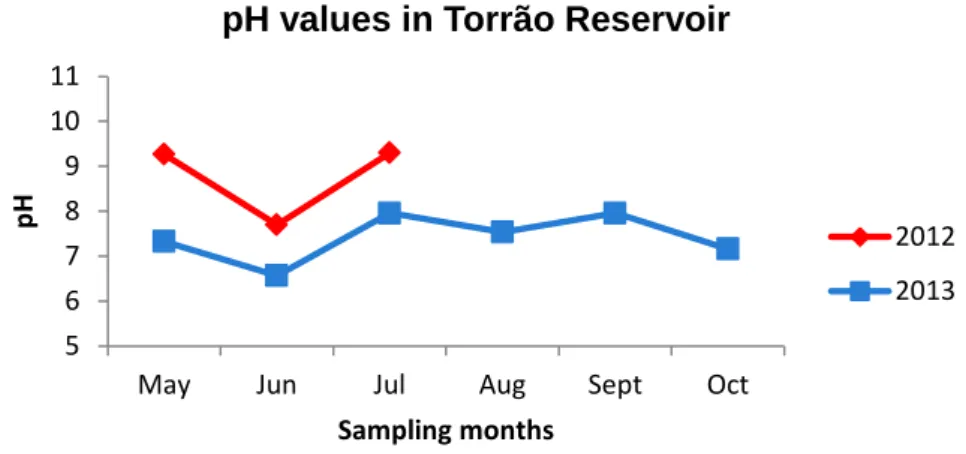
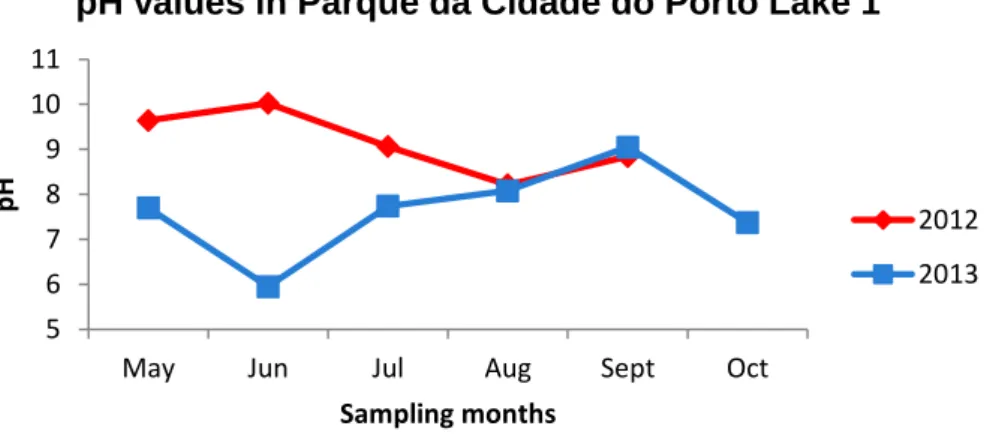
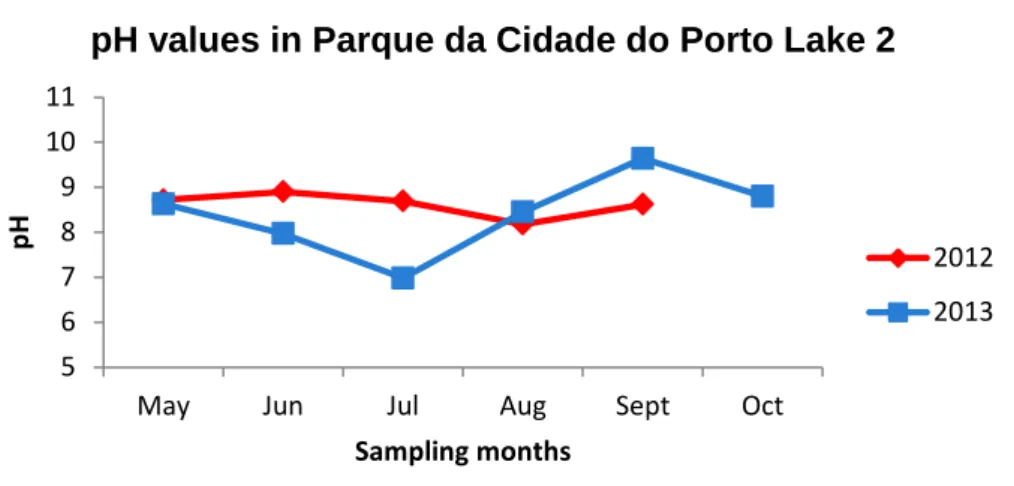
Figure 1. Chemical structure of microcystin (adapted from Neilan et al., 1999). ... 3 Figure 2. Chemical structure of cylindrospermopsin (adapted from van Apeldoorn et al., 2007). ... 5 Figure 3. Chemical structure of anatoxin-a (adapted from van Apeldoorn et al., 2007). 7 Figure 4. Chemical structure of saxitoxin (adapted from van Apeldoorn et al., 2007). .. 9 Figure 5. Location of Torrão Reservoir (image obtained using Google Earth 7.1.2.2041 software) and sampling site. ... 14 Figure 6. Location of Parque Fluvial do Tâmega (image obtained using Google Earth 7.1.2.2041 software) and sampling site. ... 15 Figure 7. Location of Parque da Cidade do Porto (image obtained using Google Earth 7.1.2.2041 software).Parque da Cidade sampling sites. a) Lake 1 (sampling site 1); b) Lake 2 (sampling site 2); c) Lake 3 (sampling site 3)... 16 Figure 8. Location of Vela Lake (image obtained using Google Earth 7.1.2.2041 software) and sampling site. ... 17 Figure 9. Location of Mira Lake (image obtained using Google Earth 7.1.2.2041 software) and sampling site. ... 18 Figure 10. Minimum and maximum temperatures registered in Luzim weather station in the sampling periods of 2012 and 2013 (data provided by IPMA). ... 29 Figure 11. Minimum and maximum temperatures registered in Porto weather station in the sampling periods of 2012 and 2013 (data provided by IPMA). ... 29 Figure 12. Minimum and maximum temperatures registered in Figueira da Foz weather station in the sampling periods of 2012 and 2013 (data provided by IPMA). ... 30 Figure 13. Minimum and maximum temperatures registered in Mira weather station in the sampling periods of 2012 and 2013 (data provided by IPMA). ... 30 Figure 14. pH values registered in Torrão Reservoir in the sampling periods of 2012 and 2013. ... 31 Figure 15. pH values registered in Parque Fluvial do Tâmega in the sampling periods of 2012 and 2013. ... 31 Figure 16. pH values registered in Parque da Cidade do Porto Lake 1 in the sampling periods of 2012 and 2013. ... 32 Figure 17. pH values registered in Parque da Cidade do Porto Lake 2 in the sampling periods of 2012 and 2013. ... 33 Figure 18. pH values registered in Parque da Cidade do Porto Lake 3 in the sampling periods of 2012 and 2013. ... 33
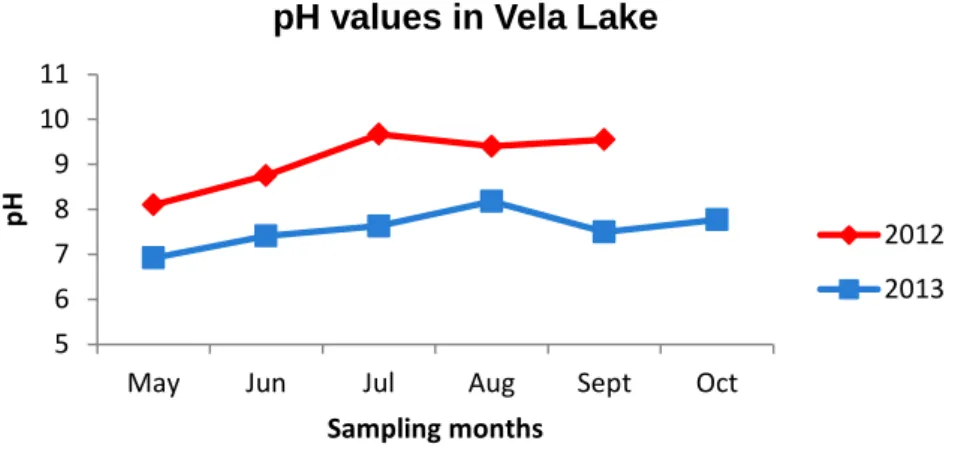
Figure 19. pH values registered in Vela Lake in the sampling periods of 2012 and
2013. ... 34
Figure 20. pH values registered in Mira Lake in the sampling periods of 2012 and 2013. ... 34
Figure 21. Microcystin quantification by ELISA in Torrão Reservoir in 2012 and 2013. ... 43
Figure 22. Microcystin quantification by ELISA in Parque Fluvial do Tâmega in 2012 and 2013. ... 43
Figure 23. Microcystin quantification by ELISA in Parque da Cidade do Porto Lake 1 in 2012 and 2013. ... 43
Figure 24. Microcystin quantification by ELISA in Parque da Cidade do Porto Lake 2 in 2012 and 2013. ... 44
Figure 25. Microcystin quantification by ELISA in Parque da Cidade do Porto Lake 3 in 2012 and 2013 ... 44
Figure 26. Microcystin quantification by ELISA in Vela Lake in 2012 and 2013. ... 44
Figure 27. Microcystin quantification by ELISA in Mira Lake in 2012 and 2013. ... 45
Figure 28. Cylindrospermopsin quantification by ELISA in Vela Lake in 2012. ... 45
Figure 29. Anatoxin-a quantification by ELISA in Torrão Reservoir in 2012 and 2013.46 Figure 30. Anatoxin-a quantification by ELISA in Parque Fluvial do Tâmega in 2012 and 2013. ... 46
Figure 31. Anatoxin-a quantification by ELISA in Parque da Cidade do Porto Lake 1 in 2013. ... 46
Figure 32. Anatoxin-a quantification by ELISA in Parque da Cidade do Porto Lake 3 in 2013. ... 47
Figure 33. Anatoxin-a quantification by ELISA in Mira Lake in 2013. ... 47
Figure 34. Saxitoxin quantification by ELISA in Parque da Cidade do Porto Lake 2 in 2012. ... 48
Figure 35. Saxitoxin quantification by ELISA in Vela Lake in 2012. ... 48
Figure 36. (a) Chromatogram of the sample from May 2012 of dissolved matter at 262 nm, with the retention time at 7.207 minutes. (b) Spectrum of absorption for cylindrospermopsin. ... 49
Figure 37. (a) Chromatogram of the sample from September 2012 for dissolved matter at 262 nm, with the retention time at 7.201 minutes. (b) Spectrum of absorption for cylindrospermopsin. ... 49
Figure 38. (a) Chromatogram of the sample from May 2013 of dissolved matter at 262 nm. (b) Spectrum of absorption for cylindrospermopsin. ... 50
Figure 39. (a) Chromatogram of the sample from October 2013 for particulated matter at 262 nm. (b) Spectrum of absorption for cylindrospermopsin. ... 50 Figure 40. Quantification values of cylindrospermopsin present in samples from Vela Lake obtained by HPLC-PDA. ... 51 Figure 41. Mass spectrum of cylindrospermopsin by LC-MS (sample from May 2012). ... 51 Figure 42. Mass spectra of cylindrospermopsin by LC-MS (spiked sample from October 2013 and standard). ... 52 Figure 43. Mass spectra of cylindrospermopsin by LC-MS (samples from May 2013 and October 2013). ... 52
List of Abbreviations
BMAA – β-methylanino-L-alanine
BSA – Bovine Serum Albumin CE – Capillary Electrophoresis CYN - Cylindrospermopsin DNA – Deoxyribonucleic Acid
dNTPs – Deoxynucleotide Triphosphates
EDTA - Ethylenediamine Tetraacetic Acid
ELISA – Enzyme-Linked Immunosorbent Assay
FLD – Fluorescence Derivatization
HPLC – High-Performance Liquid Chromatography
HPLC-PDA – High-Performance Liquid Chromatography-Photodiode Array
IL-1 – Interleukin-1
LC-MS – Liquid Chromatography-Mass Spectrometry
LOD – Limit of Detection
MC-LR – Microcystin-LR
MS – Mass Spectrometry
NMR – Nuclear Magnetic Resonance
NRPS – Non-ribosomal Peptide Synthesis
PCR – Polymerase Chain Reaction PDA – Photodiode Array
PKS – Polyketide Synthesis PSP – Paralytic Shellfish Poisoning
SXT - Saxitoxin
TAE - Tris-Acetato-EDTA
TNF-α – Tumor Necrosis Factor Alpha UV – Ultraviolet radiation
1. Introduction
As a community, the evolution of human species always finds itself related to the water presence, its abundance and worldwide distribution. The exploitation of water resources has been used by humans for their locomotion, for their livelihoods and their development, whether in a technological or in a civilizational level. However, along with this development of humans, recorded mostly after the Industrial Revolution, there has also been deterioration, both in quality and biodiversity, of the available water resources exploited by man, due to the non-sustainable resource management and the constant pressures on them (Mendes and Oliveira, 2004).
The degradation of water resources reveals itself through a series of changes in their physical, chemical and biological characteristics, leading to the eutrophication of the water ecosystem, and subsequently, to several issues in terms of environmental, animal and public health.
1.1.
General concepts
Widely recognized as a worldwide problem (Zhang et al., 2009), the eutrophication of freshwater systems is a process characterized by increase of the nutritive compounds in the water, like nitrogen and phosphorus, leading to the accelerated growth of all aquatic biologic productivity, especially from algal communities (de Figueiredo et al., 2004; Porteiro et al., 2005; Nimptsch et al., 2008). The state of eutrophication is determined by the observation of changes that occur in the phytoplanktonic communities, especially in the decrease of the relation between sensitive taxa/ tolerant taxa and in the global intensification of the abundance of phytoplanktonic biomass (Gonçalves et al., 2006). This is a process that occurs naturally over millennia; however, this is accelerated or even triggered by human pressures exercised on freshwater systems (Porteiro et al., 2005). Along with other factors, like high temperatures, physic stability of water column and inadequate agricultural procedures near water resources that leads to an excessive and unnecessary use of fertilizers (de Hoyos et al., 2004; Nimptsch et al., 2008), this process provides favorable conditions to the occurrence of cyanobacterial blooms, common elements of phytoplankton in most freshwater systems (Bittencourt-Oliveira, 2003; Quesada et al., 2004; Papadimitiou et al., 2012).
Cyanobacteria are photosynthetic prokaryotes dated from three billion years ago, commonly present in aquatic systems, especially in freshwater and marine ecosystems (Sze, 1993; de Hoyos et al., 2004; Kumar et al., 2011). Its presence is detected on the surface of aquatic systems in eutrophic and mesotrophic state, located in areas with a range of temperatures that allow the proliferation of cyanobacteria. The richness, in a nutrient level, of these waters, along with the suitable physical-chemical parameters, allows cyanobacteria to form dense accumulations on the water surface and then become active competitors against eukaryotic phytoplankton for the nutrients in the water and for the absorption of the active photosynthetic radiation available along the water column (Neilan et al., 1999; de Hoyos et al., 2004; Quesada et al., 2004; Bittencourt-Oliveira et al., 2010a).
One of the main consequences of this process is the production of secondary metabolites by some species of cyanobacteria, which contribute to the degradation of water quality, with severe consequences in terms of environmental, animal and human health – the cyanotoxins (Quesada et al., 2004).
1.2.
Cyanotoxins
Secondary metabolites with a high level of toxicity, cyanotoxins present an extended variety of chemical and molecular structures and several levels of toxicity (Kumar et al., 2011). Produced by cyanobacteria, these toxins can remain inside the cell after their synthesis (intracellular) or be released to the water environment (extracellular), during cyanobacteria growth phase and/or during cellular lysis (senescence).
Given the wide variety of chemical and molecular structures, cyanotoxins can be classified at two levels: through its mode of action or only by its chemical structure. According to its chemical structure, cyanotoxins can be classified as cyclic peptides (microcystins and nodularins); alkaloids (cylindrospermopsin, anatoxin-a, anatoxin-a(S) and saxitoxin) and lipopolysaccharides (Carmichael and Liu, 2006). According to its target-organ and mode of action, cyanotoxins can be classified as hepatotoxins (microcystins, nodularins), cytotoxins (cylindrospermopsin), neurotoxins (anatoxin-a, anatoxin-a(S), β-methylamino-L-alanine (BMAA) and saxitoxin) and dermatotoxins
(lyngbyatoxin, aplysiatoxin) (Bittencourt-Oliveira, 2003; Carmichael and Liu, 2006; Kumar et al., 2011).
Cyanotoxins have the ability to accumulate in the tissues of organisms from diverse trophic levels. This accumulation in the tissues can lead to several symptoms, most of them difficult to detect and prevent and can also lead to the death of the individuals, being already responsible for high mortality rates, especially in aquatic animals (Bittencourt-Oliveira, 2003). Humans are exposed to cyanotoxins mostly through ingestion of contaminated food, especially shellfish; they can also be exposed through the accidental ingestion or contact with contaminated water during recreational activities and through the ingestion of contaminated water (Žegura et al., 2011; Merel et al., 2013). The most severe case already reported dates back to 1996, when 76 patients of a hemodialysis clinic in Caruaru, Brazil died due to the contact with contaminated water used in hemodialysis being the resulted symptoms described as the so called “Caruaru Syndrome” (Bittencourt-Oliveira, 2003; Bittencourt-Oliveira et al., 2010b).
1.2.1.
Microcystins
Microcystins comprise a group of cyclic heptapeptides whose chemical structure varies according to the amino acids in X and Z positions (Figure 1). More than 90 structural variants of microcystins are already known, despite just one or two of the isoforms dominate in each one of the producing genera (Neilan et al., 1999; Bittencourt-Oliveira, 2003; Kumar et al., 2011).
Figure 1. Chemical structure of microcystin (adapted from Neilan et al., 1999).
Natural toxins produced by some species belonging to the genera Microcystis, Anabaena, Oscillatoria, Nostoc and Planktothrix (Xie et al., 2005; Kumar et al., 2011), microcystins are synthesized by a non-ribosomal enzymatic complex, which comprehends a non-ribosomal signaling pathway through an enzymatic complex peptide synthesis (NRPS) and a polyketide synthesis mechanism (PKS). This
synthesis mechanism is responsible for the incorporation of the amino acids in the peptide chain, being codified by mcy gene clusters (Bittencourt-Oliveira, 2003; Ouahid et al., 2005; Mankiewicz-Boczek et al., 2006; Bittencourt-Oliveira et al., 2010).
Early detection of microcystins and their producing species leads to an effective prevention against its action. Their toxicity, as well its high stability and thermal resistance, translate into serious consequences to the environment and to biodiversity, in a direct or indirect form, through water that contains microcystins, due to their capacity to bioaccumulate over the several trophic levels of the established food chains in the affected ecosystems (Neilan et al., 1999; Bittencourt-Oliveira et al., 2010; Papadimitriou et al., 2012).
In the human organism, microcystins act on the bile acid transport system, where occur hyperphosphorylation of the microfilaments. On hepatocytes, microcystins activate phosphorylase A2 and cyclooxygenase; in macrophages, this toxin is capable to induce tumor necrosis factor alpha (TNF-α) and interleukin-1 (IL-1). Given the effects on hepatocytes and macrophages, microcystins are also considered as promoters of hepatic tumors (Neilan et al., 1999; Xie et al., 2005; Chen et al., 2010; Papadimitriou et al., 2012).
Due to its high toxicity the World Health Organization (WHO) established 0.04μg/kg of body weight as a daily limit of tolerable intake for microcystins and 1μg/L for its presence in drinking water, with the assumption that about 80% of human exposure to this toxin is due to consumption of contaminated water (Poste et al., 2011). In Portugal, a guideline value for microcystins of 1μg/L for drinking water was established, according to the Decreto-Lei 306/2007. Despite these recommendations, cases of contamination of humans continue to be reported annually, some of them with the occurrence of deaths of individuals.
One of the most severe cases of contamination in humans reports to 1996, where 76 patients of a hemodialysis center in the city of Caruaru, Brazil, died due to the ingestion of water contaminated with microcystins and wherein the manifested disease became known as “Caruaru Syndrome” (Bittencourt-Oliveira, 2003; Bittencourt-Oliveira et al., 2010b). In China, the consumption of fish originated from eutrophic lakes with a frequent record of toxic cyanobacterial blooms caused several cases of microcystin contamination through bioaccumulation processes, being already considered a serious case of public health, given the eutrophic state of most of Chinese water resources (Zhang et al., 2009).
In Portugal, microcystins are present in freshwater systems, widely spread and studied across the country, being the principal cyanotoxin in Portuguese freshwater ecosystems, although without a record of human contamination due to ingestion or contact with contaminated water (Vasconcelos, 1993, 1994, 1995, 1999, 2001; Vasconcelos et al., 1995, 1996; Freitas, 2009; Morais, 2009; Regueiras, 2009).
1.2.2.
Cylindrospermopsin
Among the toxins with hepatotoxic, neurotoxic and cytotoxic effects (Pearson et al., 2010; Neilan et al., 2013), cylindrospermopsin are a group of tricyclic alkaloid toxins, with a chemical and molecular stable structure, without great variations in their amino acid composition (Aráoz et al., 2010; Žegura et al., 2011; Gutiérrez-Praena et al., 2013). With a low molecular weight (415 Da) (Žegura et al., 2011), cylindrospermopsin is a polyketide-derived alkaloid, containing a guanidine group and a hydroxide group, connected to a tricyclic-carbon skeleton (Figure 2) (Mihali et al., 2008; Pearson et al., 2010; Žegura et al., 2011; Poniedziałek et al., 2012; Gutiérrez-Praena et al., 2013; Merel et al., 2013). Changes in its molecular structure originate the cylindrospermopsin’ analogues 7-epicylindrospermopsin, a toxic minor metabolite of Aphanizomenon ovalisporum, due to the occurrence of an epimer at the hydroxyl bridge, and 7-deoxy-cylindrospermopsin, given the lack of the hydroxyl group at C-7 (Mihali et al., 2008).
Figure 2. Chemical structure of cylindrospermopsin (adapted from van Apeldoorn et al., 2007).
Produced by common species of the cyanobacteria community present in freshwater systems, like Cylindrospermopsis raciborskii, Umezakia natans, Aphanizomenon ovalisporum, Raphidiopsis curvata, Lyngbya wollei, Anabaena bergii, Aphanizomenon flos-aquae e Anabaena lapponica (Mihali et al., 2008; Pearson et al.,
2010), cylindropsermopsin is a very water-soluble toxin (Žegura et al., 2011), finding itself, in 90% of the total quantity of cylindrospermopsin produced by cyanobacteria, dissolved in water. The chemical structure of this toxin gives it a high stability, even in extreme environments in terms of temperature, pH and radiation, making difficult its elimination from the water (Saker et al., 2004; White et al., 2006; Kalaitzis et al., 2010; Poniedziałek et al., 2012; Gutiérrez-Praena et al., 2013). Degradation of cylindrospermopsin present in the water is promoted in the presence of oxygen and inhibited in anoxic environments, wherein the adsorption process of the toxin, during sedimentation process, depends of the amount of organic carbon available (Poniedziałek et al., 2012).
In recent years, exponential growth of the number of reported cases of cylindrospermopsin potentially-producing species has raised several questions regarding the impact of their presence in the environment and its capacity to bioaccumulate in the tissues of the organisms present in the affected environment (Saker et al., 2004; White et al., 2006). The wide geographical distribution of cylindrospermopsin and its producing species, its high solubility in water and its high presence in water in its dissolved form, causes humans to be more susceptible to cylindrospermopsin contamination, relatively to other cyanotoxins (Gutiérrez-Praena et al., 2006).
In human organisms, cylindrospermopsin acts on the protein synthesis, inhibiting this process. This cyanotoxin also interferes on the metabolism of cytochrome p450 and other cellular mechanisms, therefore being classified as cytotoxic (Saker et al., 2004; Aráoz et al., 2009; Pearson et al., 2010; Gutiérrez-Praena et al., 2013). However, previous studies (Humpage et al., 2000; Shen et al., 2002), show that cylindrospermopsin can also be classified as carcinogenic, given the damages caused by this toxin in DNA (Deoxyribonucleic Acid) strains. At a functional level, exposure and contamination of the organism by cylindrospermopsin can cause serious damages in organs as diverse as the liver, kidneys, thymus, heart, lungs, spleen and immune system (Pearson et al., 2010; Žegura et al., 2011). Despite its effects in the organisms and in the environment, there are no official guidelines stablished by WHO for the presence of cylindrospermopsin in drinking water. However, Humpage and Falconer (2003) suggested a guideline of 1.0 μg/L, similar to the one stablished for microcystins. Some countries, however, have legislated the maximum quantity of cylindrospermopsin allowed in drinking water, like Queensland region in Australia (1.0 μg/L), Brazil (15 μg/L), New Zealand (1.0 μg/L) (Burch, 2008; Washington State Department of Health, 2011).
In Portugal, there are still no reports of the presence of this cyanotoxin in freshwater systems, nor an established guideline. However, a previous study (Moreira et al., 2011), reported the presence of the pks gene in samples from Vela Lake, though, analysis by HPLC-PDA and LC-MS did not detect the presence of cylindrospermopsin in the water samples. Nevertheless, due to cylindrospermopsin’ characteristics, is important to continue the monitoring of this freshwater ecosystem for the presence of the genes implicated in cylindrospermopsin biosynthesis and its production by cyanobacteria.
1.2.3.
Anatoxin-a
Anatoxin-a is an alkaloid composed by a bicyclic secondary amine, being this way chemical and structurally analogue of acetylcholine, a natural neurotransmitter of the organisms (Figure 3) (Teixeira and Rosa, 2006; Yavasoglu et al., 2008). Due to its chemical structure, anatoxin-a is highly unstable in natural conditions, being easily converted in non-toxic products, like dihydroanatoxin-a and epoxyanatoxin-a (Osswald et al., 2007).
Figure 3. Chemical structure of anatoxin-a (adapted from van Apeldoorn et al., 2007).
Firstly reported in 1951 in the USA, anatoxin-a was the first cyanotoxin to be chemical and functionally characterized (Osswald et al., 2007; Ballot et al., 2010). With low molecular weight, it possesses a high solubility in water, being easily degraded by the microorganisms present in the water and in alkaline and/or exposed to direct light environments (Teixeira and Rosa, 2006; Osswald et al., 2007; Yavasoglu et al., 2008). However, anatoxin-a degradation process is independent of the presence of oxygen, concluding in this way that it is not a photo-degradation process, despite it depends on direct light and high pH of the environment to accomplish (Osswald et al., 2007).
Possessing an high geographical distribution, anatoxin-a is produced by phytoplanktonic and benthic species belonging to genera Anabaena, Aphanizomenon, Cylindrospermum, Oscillatoria, Microcystis, Raphidiopsis, Planktothrix, Artrospira, Nostoc and Phormidium. Its distribution, allied to its high toxicity and instability, as raised several questions about its consequences on environmental and public health (Osswald et al., 2007; Ballot et al., 2010; Yavasoglu et al., 2010; Žegura et al., 2011).
The presence of anatoxin-a in Portugal is still not reported, although previous studies (Osswald et al., 2007; 2009), demonstrated that Portuguese strains of anatoxin-a producing species, present in nine freshwater systems, produces the toxin when cultivated in laboratory. So, the potential occurrence of anatoxin-a in Portuguese waters must be considered.
Anatoxin-a is an acetylcholine cholinergic agonist and mimics acetylcholine’s mode of action at muscular neurotransmitters. It binds irreversibly to acetylcholine neuronal receptors, present in the neuromuscular junction, with higher affinity than acetylcholine itself (Teixeira and Rosa, 2006; Yavasoglu et al., 2008; Žegura et al., 2011). This connection induces the continuous stimulation of the muscle, due to the fact that anatoxin-a is not degraded by acetylcholinesterase, leading to muscular exhausting, the paralysis of the muscle and, in case of paralysis of respiratory and/or cardiac muscles, the death of the individual (Teixeira and Rosa, 2006; Žegura et al., 2011).
The lack of an available treatment for cases of intoxication by anatoxin-a has led to an increasing necessity of more studies about the structure and mode of action of this cyanotoxin (Žegura et al., 2011). Its chronic effects are unknown, as well as its genotoxic and carcinogenic potential (Teixeira and Rosa, 2006; Žegura et al., 2011). Also, guidelines regarding the presence of anatoxin-a in drinking water are practically inexistent in most countries, including Portugal. However, New Zealand established a value of 6.0 μg/L and Washington State Department of Health suggested, in 2008, a maximum quantity of 1.0 μg/L in drinking water, due to the potent action of anatoxin-a (Burch, 2008; Washington State Department of Health, 2008).
1.2.4.
Saxitoxin
Saxitoxins comprehend a group of alkaloid tetrahydro-purines which chemical and molecular structure varie according to the amino acids presents in R positions (Figure 4) (Sivonen and Jones, 1999; Llewellyn, 2006; Pearson et al., 2010). Its tricyclic
structure gives saxitoxin stability and resistance to extreme conditions, like temperature and pH (Llewellyn, 2006).
Figure 4. Chemical structure of saxitoxin (adapted from van Apeldoorn et al., 2007).
Possessing over 30 different isoforms, saxitoxins are produced by marine dinoflagellates from genera Alexandrium, Gymnodinium and Pyrodinium and by cyanobacteria from genera Anabaena, Aphanizomenon, Cylindrospermopsis, Lyngbya and Planktothrix (Sivonen and Jones, 1999; Landsberg, 2002; Llewellyn, 2006; Pearson et al., 2010; Perreault et al., 2011). The variations in the producing organisms, as well its geographical distribution, are essential factors in saxitoxin’ toxic profiles, while a potentially producing genus might not produce toxic isoforms of this cyanotoxin (Pearson et al., 2010).
Its high toxicity is highly harmful to organisms, wherein intoxications by contact with saxitoxins were already responsible for massive deaths of marine organisms, as well as humans (Pearson et al., 2010; Perreault et al., 2011). The high resistance by some organisms, like shellfish, and the ease of saxitoxin accumulation in tissues leads to an increase risk of occurrence of bioaccumulation processes which, in case of existing, affect directly all the organism in the several trophic levels of the food chain that exist in that system, creating, in this way, several environmental and public health issues (Pearson et al., 2010).
Along with the consumption of contaminated water, bioaccumulation of saxitoxins through the several trophic levels is, generally, the main source of human contact with this cyanotoxin. The vast consumption of aquatic organisms, from the several levels of
the food web, makes that the occurrence of intoxications by saxitoxins are still very common worldwide (Landsberg, 2002; Perreult et al., 2011).
At a human level, saxitoxins, as well as their derivatives, are the causal agents of PSP - Paralytic Shellfish Poisoning (Sivonen and Jones, 1999). This pathology characterizes itself by the blocking of muscular and nervous sodium channels, stopping this way the influx of sodium to the cells and restricting the signal transmitted between neurons. At a physiological and symptomatological level, this sodium channels block translates itself, at an initial stage, in facial numbness, vomits and diarrhea. In more acute cases, it can also cause muscular weakness, ataxia, motor incoordination, incoherence and, sometimes, respiratory insufficiency. When in lethal doses, this block causes cardiac and respiratory arrest, leading to the death of the individual (Landsberg, 2002; Pearson et al., 2010). Since its discovery, numerous fatal cases of saxitoxin intoxication have been reported. Despite the knowledge of its structure, mode of action, symptomatology, there is still no cure for saxitoxin intoxication (Pearson et al., 2010). Guideline values for saxitoxin are still not established by WHO, or by most of the countries. Exceptions are for New Zealand, Brazil and Australia, where the concentration of saxitoxin (expressed in SXT-equivalent) should not exceed 3.0 μg/L (Burch, 2008; Washington State Department of Health, 2011).
Saxitoxin presence in Portuguese freshwaters is still not reported, although there are reports of the presence of this cyanotoxin in coastal areas, especially in shellfish that inhabit those ecosystems (Pereira et al., 2004; Martins et al., 2005; Artigas et al., 2007). However, it is reported the presence of saxitoxin producing species of cyanobacteria in Portuguese freshwater systems and saxitoxin production in laboratory cultures (Ferreira et al., 2001).
1.3.
Methods for cyanotoxin research
Cyanotoxin detection was initially made chemically in the studied water samples. Morphologic identification of producing organisms showed to be ineffective in the detection of cyanotoxin-producing species. Due to the lack of morphologic differences between producing and non-producing organisms, it is impossible to perform an initial screening of cyanotoxin-producing strains (Bittencourt-Oliveira, 2003; Kumar et al., 2011).
The study, at a molecular level, of environmental samples containing cyanotoxins allows the quantification and identification of the producing strains, providing a water-monitoring program more sensitive and specific in relation to the established criteria for environmental control. Depending of the obtained sampling conditions, analysis for detection and quantification of cyanotoxins can be made using chemical, biochemical and molecular methods (Regueiras, 2009; Kumar et al., 2011).
1.3.1.
Chemical methods
Chemical methods are the most widely used methods to detect and quantify cyanotoxins (Moreira et al., 2014). Examples of chemical techniques are High Performance Liquid Chromatography (HPLC), Capillary Electrophoresis (CE), Nuclear Magnetic Resonance (NMR) and Mass Spectrometry (MS) (Msagati et al., 2006).
HPLC is most used method for cyanotoxin detection in environmental samples, along with a UV, PDA (Photodiode Array) and FLD (Fluorescence Derivatization) detectors (Moreira et al., 2014). It can also be coupled with a mass spectrometer (LC-MS) for a more sensitive detection of cyanotoxins and structure elucidation (Sangolkar et al., 2006). HPLC is a highly sensitive method, allowing the obtainment of qualitative and quantitative information of the cyanotoxins under study, through the analysis of two criteria: retention time and spectrum of absorption (Ouahid, 2008; Pearson and Neilan, 2008). However, despite these advantages, environmental samples have a long extraction process, because of the need to concentrate and purify the samples (Freitas, 2009). Other disadvantages of this method are the need of an expert in the field in order to conduct the analysis and interpret the obtained results; the high volume of sample needed when the toxin is in low concentrations; and the need of very expensive standards that sometimes are difficult to obtain (Rivasseau et al., 1999; Rapala et al., 2002; Mathys and Surholt, 2004; Sangolkar et al., 2006; Pearson and Neilan, 2008; Moreira et al., 2014). In comparison, ELISA is a more sensitive method than HPLC and LC-MS, with a lower LOD than HPLC and LC-MS; on the contrary, HPLC and LC-MS are more specific and selective techniques since it allows the differentiation between the several cyanotoxin isoforms (Merel et al., 2013).
Liquid chromatography coupled with mass spectrometry (LC-MS) is a method more sensitive than HPLC method and therefore is widely used in cyanotoxin detection (Sangolkar et al., 2006). Molecules from environmental samples are converted into ions which are subsequently detected and analyzed according to their mass charge
ratio and retention time, which limits the potential for interference in the procedure and increases the selectivity of the method (Sangolkar et al., 2006; Merel et al., 2013). The development of tandem mass spectrometry (MS/MS) allows the identification of the analyzed compounds through deduction of the amino acid sequence, over the fragmentation of a specific peptide (Sangolkar et al., 2006).
1.3.2.
Biochemical methods
The development of biochemical methods are associated with the biochemical properties possessed by cyanotoxins. Methods that use antibodies, like Enzyme-Linked Immunosorbent Assay (ELISA), Ligand-binding Assays and Enzyme Inhibition Assays, are the most commonly used in the detection and quantification of cyanotoxins (Moreira et al., 2014).
Immunological ELISA tests are characterized by the use of commercial kits with mono or polyclonal antibodies in its composition, making this technique a quick and inexpensive method for the quantification of the cyanotoxins present in samples (Rivasseau et al., 1999; Rapala et al., 2002; Mathys and Surholt, 2004; Sangolkar et al., 2006). The use of small amounts of samples, as well as its lower detection limit and its capacity to quantify samples with concentrations of toxin within the legal limits are advantages of this method when in comparison with other methods, such as HPLC (Metcalf and Codd, 2003). However, the high structural variation that occurs in cyanotoxins can cause cross-reactions between the antibodies and other variants of the toxin or other compounds present in the environmental matrix. In these cases, the results may not express, in the most accurate way, the concentration values of the studied toxin (Rapala et al., 2002; Sangolkar et al., 2006). Thus, and although more sensitive, ELISA tests are less selective than chemical methods, such as HPLC and LC-MS.
1.3.3.
Molecular methods
Highly specific methods, molecular techniques are very useful and sensitive tools that allow the detection of a reduced number of cells (Baker et al., 2002; Saker et al., 2007). These methods, especially PCR (Polymerase Chain Reaction), are increasingly common in the detection of cyanotoxin potentially-producing genera, due to its low cost, its easiness in use, their rapidness and their high sensitivity (Pearson and Neilan,
2008). When the aim of the analysis is to detect cyanotoxin potentially-producing genera, it must be employed genes that are directly involved in the toxin biosynthesis (Pearson and Neilan, 2008).
Comparing bioassays with mice, microscopy and HPLC with conventional PCR, it has been demonstrated that with this molecular technique is a more effective method in monitoring cyanotoxin potentially-producer genera in water samples, thus concluding that this method can be used in the improvement of the water quality management program on the diverse aquatic ecosystems (Baker et al., 2002). Saker et al., (2007) also tested the effectiveness of the molecular methods on the detection of cyanotoxin potentially-producer cyanobacteria in environmental samples by comparing molecular methods with microscopic observation and chemical techniques, such as ELISA and HPLC. However, the conventional PCR method is limited by the absence of quantitative information.
1.4.
Objectives
The high toxicity of cyanotoxins, as well as their impact in the environment and in the exposed organisms, creates the necessity of a specific monitoring program, designed for contaminated ecosystems, or systems with a record of regular presence of cyanobacterial blooms containing cyanotoxin potentially-producing genera. Following this necessity, the aims of this study are:
a) Determine the ecological status of the selected ecosystems through quantification of physical and chemical parameters;
b) Detection of the genes involved in microcystins, cylindrospermopsin, anatoxin-a and saxitoxin biosynthesis through molecular methods (PCR amplification);
c) Quantification of the cyanotoxins present in the screened freshwater systems through biochemical methods (ELISA quantification assays);
d) Application of chemical methods for the detection and quantification of cylindrospermopsin (HPLC-PDA and LC-MS);
e) Evaluation of the temporal and spatial dynamics of the detected cyanotoxins in all the freshwater systems studied.
2. Materials and Methods
2.1.
Study Area
2.1.1.
Torrão Reservoir (Tâmega River)
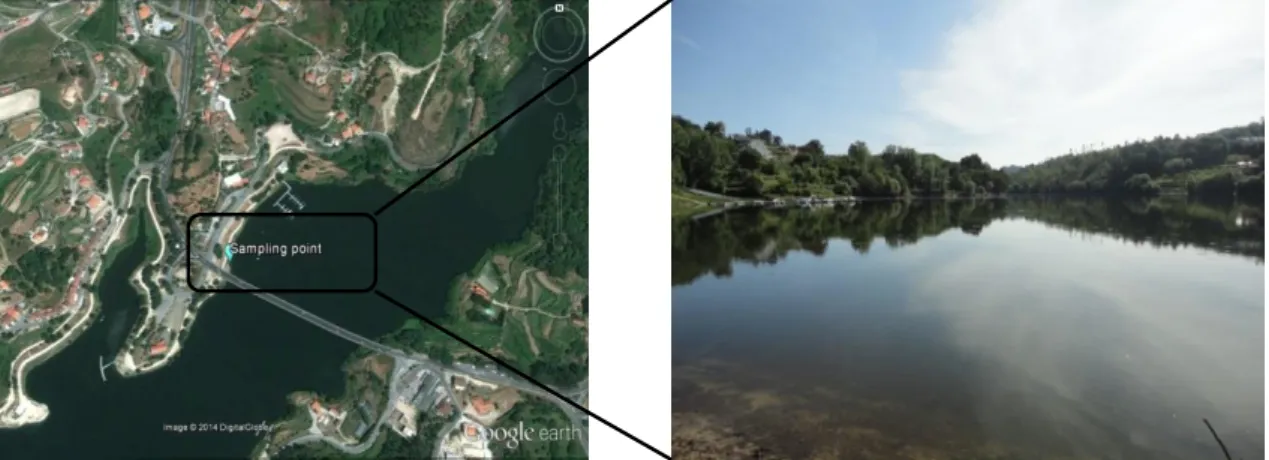
Created after the construction of Torrão’ hydroelectric central, in 1988, Torrão Reservoir (Figure 5) is, on the North region of Portugal, one of the main water sources for consumption and recreational activities (Oliva-Teles et al., 2008; Regueiras, 2009; Torres et al., 2011). Located on the Tâmega River (41°05'45.7"N, 8°15'15.4"W), the principal tributary of the Douro River in national territory, Torrão Reservoir is classified as an artificial semi-lentic freshwater system, mainly eutrophic, possessing a total water volume of 77 hm3 (Oliva-Teles et al., 2008; Regueiras, 2009). Given that the system has semi-lentic characteristics and the high eutrophication of the Tâmega River and its respective hydrographic basin (Regueiras, 2009), it has been reported an increase in the frequency of toxic cyanobacterial blooms, mainly from the species Microcystis aeruginosa and Aphanizomenon flos-aquae (Oliva-Teles et al., 2008). This increase has been registered mainly in warmer months, therefore being associated with the increase of the temperature during that period (Oliva-Teles et al., 2008).
Figure 5. Location of Torrão Reservoir (image obtained using Google Earth 7.1.2.2041 software) and sampling site.
2.1.2.
Parque Fluvial do Tâmega (Tâmega River)
Located on Tâmega River (41°11'45.9"N, 8°09'38.2"W), Parque Fluvial do Tâmega (Figure 6) is integrated in the reservoir created by Torrão hydroelectric central, situated about 14km downstream. Inaugurated in December of 2008, in Marco de Canaveses, Parque Fluvial do Tâmega is a recreational park, where it is allowed the practice of
aquatic activities, but people are not allowed to swim, due to the status of water. Like Torrão Reservoir, this system is an artificial semi-lentic freshwater system, classified as eutrophic, due to the hyper eutrophication of the river (Regueiras, 2009).
Figure 6. Location of Parque Fluvial do Tâmega (image obtained using Google Earth 7.1.2.2041 software) and sampling site.
2.1.3.
Parque da Cidade do Porto
With a total area of 85 ha, Parque da Cidade is the Portugal largest urban park, composed by grassy areas, wooded areas and 4 artificial lakes. Inaugurated in 1993, Parque da Cidade is located in the middle of city of Oporto and due to its proximity to Atlantic Ocean is a stopping point for several migratory birds (Morais, 2009). Given the proximity to the sea, Parque da Cidade flora is very diverse, with the presence of 74 tree species, 42 shrub species and 10 aquatic species (Morais, 2009). In terms of natural fauna, Parque da Cidade is inhabited by swans, wild ducks, geese, fishes, frogs, rabbits, among others. In terms of cyanobacteria species presence, a previous study (Morais et al., 2009) detected the presence of potentially-toxic cyanobacterial blooms, mainly from the genera Microcystis and Planktothrix. Water circulation between the lakes is made through small falls or by underground channeling. Furthermore, this water supplies the park irrigation system wherein this, in the past, was an agricultural field (Moreira, 1998; Morais, 2009).
Sampling sites of Parque da Cidade were chosen due to the connection between 3 of the 4 lakes that constituted that park (Figure 7). Situated at different highs, there is a natural water circulation from lake 1 (41°10'07.1"N, 8°40'20.5"W), in a higher position to lake 3 (41°10'01.5"N, 8°40'39.8"W), in a lower position passing, in the meantime, by lake 2 (41°10'04.5"N, 8°40'25.6"W) (Moreira, 1998; Morais, 2009).
Figure 7. Location of Parque da Cidade do Porto (image obtained using Google Earth 7.1.2.2041 software).Parque da Cidade sampling sites. a) Lake 1 (sampling site 1); b) Lake 2 (sampling site 2); c) Lake 3 (sampling site 3).
2.1.4.
Vela Lake
Located on the West coast of Portugal (40°16'23.9"N, 8°47'35.1"W), Vela Lake is characterized by being a natural lentic system of low depth (mean depth: 0.9m; maximum depth: 2.4m), with a floodable surface of 70ha and a total water volume of 70x104 cm3 (Figure 8) (Castro et al., 2005; Abrantes et al., 2006). Given its geographical position, close to the Atlantic Ocean, and its climate, influenced by this proximity, Vela Lake is considered a place with a high conservative interest level, being actually protected by the Rede Natura 2000 program (Abrantes et al., 2006). However, due to the fact that this freshwater system is surrounded, in part, by agricultural fields and areas for recreational activities, along with the sandy nature of the soil and the low depth of the lake, makes this ecosystem exposed to a high input of nutrients, leading to
the system eutrophication process (Castro et al., 2005; Abrantes et al., 2006). This freshwater system is characterized by the constant turbidity of the water and, on a biotic level, by frequent toxic cyanobacterial blooms, especially from Microcystis aeruginosa (Castro et al., 2005).
Figure 8. Location of Vela Lake (image obtained using Google Earth 7.1.2.2041 software) and sampling site.
2.1.5.
Mira Lake
Small lake on Portugal Central coast region (40°26'29.8"N, 8°45'07.5"W), Mira Lake is classified as a lentic system of low depth (mean depth: 2.8m; maximum depth: 3.1m), and is the result of the junction of two small streams that runs at the surface and feed the lake (Figure 9) (Gonçalves et al., 1996; Castro et al., 2005). Possessing a surrounding area composed essentially by agricultural fields, this lake is exposed to a high quantity of nutrients coming from the streams that feed the lake and that cross this fields (Castro et al., 2005). However, urban areas that are located in the North-West side of this freshwater system make that Mira Lake also is exposed to anthropogenic pressures resultant from recreational activities, as fishing and aquatic sports, as well as the affluents that result from urban wastes originated in that same areas (Gonçalves et al., 1996; Castro et al., 2005; Freitas, 2009). This way, and given the pressures suffered, Mira Lake is actually classified as an eutrophized freshwater system (Castro et al., 2005). At a biotic level, this freshwater system has a low cover of macrophytes (Castro et al., 2005) however, according to Vasconcelos et al. (1993) this system has frequent reports of cyanobacterial blooms, mostly from Microcystis aeruginosa.
Figure 9. Location of Mira Lake (image obtained using Google Earth 7.1.2.2041 software) and sampling site.
2.2.
Sample collection and treatment
Sample collection was performed from 2012 to 2013, monthly, from May to September in 2012 and from May to October in 2013. This period was chosen according to previous studies regarding ideal conditions for cyanobacterial blooms and cyanotoxin production (Vasconcelos, 1994; Regueiras, 2009).
In all the sampling sites, pH of the water was measured, using a WTW Multiline P3 meter (WTW, Germany). Additionally, atmospheric temperature values were required to IPMA, the Portuguese Institute for Sea and Atmosphere.
So, for temperature data from Torrão Reservoir and Parque Fluvial do Tâmega, it was provided data from Luzim weather station (41°09’N, 8°14’W); for temperature values for Parque da Cidade, data were provided from Porto/Pedras Rubras weather station (41°14’N, 8°39’W); for data from Vela Lake, temperature values from Figueira da Foz weather station (40°09’N, 8°51’W) were provided and for Mira Lake, temperature data were provided from Dunas de Mira weather station (40°25’N, 8°44’W).
Collected water volumes were between 2500 mL and 5000 mL according to the sampling site. Larger sampling sites (Torrão Reservoir, Parque Fluvial do Tâmega, Mira and Vela Lakes) required larger volumes to be collected while smaller sampling sites (Parque da Cidade Lakes) require smaller volumes to be collected. Water samples were collected using plastic bottles previously sterilized and kept under refrigerated conditions until arrival at the laboratory. Simultaneously, 15 mL of water for
ELISA quantification assays were collected at each site using sterilized falcon tubes that were also transported to the laboratory under the same refrigerated conditions.
2.3.
Molecular analysis
2.3.1.
DNA extraction
Collected water samples were processed within a period of 24 hours after their collection. The samples were filtered, with a system of vacuum filtration, using sterile Munktell MGC micro-glass fiber paper filters, with a porosity of 1.2 μm and a diameter of 47mm. After filtration, the water was discarded and the filters were stored at -20°C until posterior molecular analysis. For DNA extraction the filters content was scraped with a sterile blade and placed into a sterile Eppendorf tube.
Genomic DNA from the samples was extracted with PureLink™ Genomic DNA Mini Kit (Invitrogen, CA, USA) extraction kit, according to the manufacturer’s protocol for Gram-negative bacteria, with some changes in reagents volumes. Due to high quantity of biomass collected from the filters, digestion buffer and proteinase K volumes were triplicated, to submerge the total of the sample during cellular lysis process. For this proceeding, it was used a centrifuge Eppendorf Centrifuge 5415R and a thermomixer plate Eppendorf Thermomixer compact. For the elution step, it was established a volume of 50μL of elution solution for each DNA sample.
The presence and integrity of total genomic DNA were confirmed using 1,0% agarose gel electrophoresis (Invitrogen UltraPure™ Agarose - Invitrogen, CA, USA) at 1%, stained with a solution of ethidium bromide (10mg/mL - BioRad, CA, USA), in a 1x Acetate EDTA buffer (Invitrogen UltraPure™ 10x TAE Buffer – 400mM Tris-Acetate, 10mM EDTA, pH 8.3±0.10). For electrophoresis, it was applied a constant voltage of 100V, during 30 min. In gel wells, 10μL of each DNA sample, along with 1μL of 1x gel loading buffer (Nucleic acid sample loading buffer 5x, BioRad – 50mM Trs-HCL, pH 8, 25% Glicerol, 5mM EDTA, 0.2% Bromophenol Blue and 0.2% Xylene FF) were loaded. Total genomic DNA was visualized and photographed with a transilluminator CSL-MICRODOC System, under UV light, coupled with a Cannon PowerShot G9 camera system.
2.3.2.
PCR amplification
For this experiment, the PCR amplifications were made using Promega GoTaq® Flexi DNA Polymerase (Promega, WI, USA) reagents and in all the PCR reactions was used a final volume of 20µL. Each reaction contained 4µL of 5x Green GoTaq® Flexi Buffer, 2µL of 25mM MgCl2 solution, 2µL of Primer forward, 2µL of Primer reverse, 1µL
of 2.5 mM dNTP’s mix, 0.5µL of BSA (Bovine Serum Albumin) (10mg/mL), 0.1µL of GoTaq® DNA Polymerase (5u/µL) and 1µL of DNA. The reactions occurred on one of these thermocyclers: Biometra Professional Thermocycler (Biometra, Germany) and BioRad MyCicler™ Thermal Cycler (BioRad, CA, USA).
To confirm the presence of cyanobacterial DNA in all the extracted samples, it was performed the amplification of the 16S rRNA gene, specific for the presence of cyanobacterial DNA, through the use of the set of primers 27F/809R (Table 1). Amplification program included an initial denaturation step of 92°C for 2 min, followed by 35 cycles with one cycle consisting of a DNA denaturation step at 92°C for 20s; an annealing step at 50°C for 30s and an extension step at 72°C for 60s.
PCR products were stored at -4°C until electrophoresis. In agarose gel electrophoresis it was used the same conditions as were for the visualization of the total genomic DNA. DNA ladder used was 1kb Plus DNA Ladder (fragments from 100bp to 12kb) (Invitrogen, CA, USA).
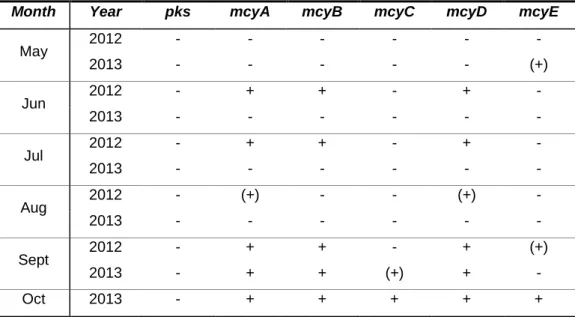
After confirmation of the positive results obtained with 16S rRNA amplification, fragments of the genes implied in cyanotoxin synthesis were amplified. For the analysis of the fragments corresponding to microcystin synthesis the primer sets for the mcy gene cluster mcyA, mcyB, mcyC, mcyD, mcyE and mcyG were used (Table 1). In the amplification of mcyA gene cluster, it was used the following program: an initial denaturation step at 95°C for 2 min, followed by 35 cycles with one cycle consisting of a denaturation step at 95°C for 90s; an annealing step at 56°C for 30s and an extension step at 72°C for 50s. For amplification of gene clusters mcyB, mcyC, mcyD, mcyE and mcyG, the program used included an initial denaturation step at 94°C for 5 min and 35 cycles consisting in 3 steps: a denaturation step at 95°C for 60s; an annealing step at 52°C for 30s and an extension step at 72°C for 60s. A positive control used in the amplifications of the mcy gene markers was previously extracted from a pure culture of a Microcystis aeruginosa strain LEGE 00063 and as a negative control was used sterile water.
Table 1. Primer sets used in the PCR amplifications.
For identification of the genes responsible for cylindrospermopsin biosynthesis, the primer sets M13/M14 (ps – Peptide Synthesis), M4/M5 (pks – Polyketide Synthase), K18/M4 (pks) and AMT Fw/AMT Rev (AMT - Aminomethyltransferase) were used
Gene Primer Primer sequence 5’-3’ Fragment Reference
16S rRNA 27F AGAGTTTGATCCTGGCTCAG 780 Neilan et al., 1997 809R GCTTCGGCACGGCTCGGGTCGATA Jungblut et al., 2005
mcyA CD1F AAAATTAAAAGCCGTATCAAA 297 Hsbergues et al., 2003
CD1R AAAAGTGTTTTATTAGCGGCTCAT
mcyB 2156-F ATCACTTCAATCTAACGACT 955 Mikalsen et al. 2003
3111-R AGTTGCTGCTGTAAGAAA
mcyC PSCF1 GCAACATCCCAAGAGCAAAG 674 Ouahid et al. 2005
PSCR1 CCGACAACATCACAAAGGC
mcyD PKDF1 GACGCTCAAATGATGAAAC 647 Ouahid et al., 2005
PKDR1 GCAACCGATAAAAACTCCC
mcyE PKEF1 CGCAAACCCGATTTACAG 755 Ouahid et al., 2005
PKER1 CCCCTACCATCTTCATCTTC
mcyG PKGF1 ACTCTCAAGTTATCCTCCCTC 425 Ouahid et al., 2005
PKGR1 AATCGCTAAAACGCCACC
AMT AMT Fw ATTGTAAATAGCTGGAATGAGTGG 1105 Kellmann et al., 2006 AMT Rev TTAGGGAAGTAATCTTCACAG
pks K18 CCTCGCACATAGCCATTTGC 422 Fergusson et al., 2003 M4 GAAGCTCTGGAATCCGGTAA Schembri et al., 2001
pks M4 GAAGCTCTGGAATCCGGTAA 650 Schembri et al., 2001 M5 AATCCTTACGGGATCCGGTGC ps M13 GGCAAATTGTGATAGCCACGAGC 597 Schembri et al., 2001 M14 GATGGAACATCGCTCACTGGTG anaC anaC-genF TCTGGTATTCAGTCCCCTCTAT 366 Rantala-Yilmen et al., 2011 anaC-genR CCCAATAGCCTGTCATCAA Anabaena anaC anaC-anabF GCCCGATATTGAAACAAGT 263 Rantala-Yilmen et al., 2011 anaC-anabR CACCCTCTGGAGATTGTTTA sxt sxtI 682F GGATCTCAAAGAAGATGGCA 195 Lopes et al., 2006 sxtI 877R GCCAAACGCAGTACCACTT
(Table 1). The amplification scheme used for M13/M14, M4/M5 and K18/M4 primer sets was: an initial denaturation step at 95°C for 2 min, followed by 35 cycles, in which one cycle consists of a denaturation step at 95°C for 90s; an annealing step at 55°C for 30s and an extension step at 72°C for 50s. Amplification of AMT primer set followed this scheme: an initial denaturation step at 94 °C for 3 min, followed by 30 cycles, consisting in 3 steps: a denaturation step at 94°C for 10s; an annealing step at 50°C for 20s and an extension step at 72°C for 60s. As a positive control for the PCR amplifications of ps, pks and AMT gene markers, an extract from a pure culture of a Cylindrospermopsis raciborskii stain LEGE 97047 was used and sterile water was used as a negative control.
Detection of genes involved in anatoxin-a synthesis was made through the amplification of anaC gene. In this amplification, the primer sets anaC-gen, for general amplification, and anaC-anab, specific for the genus Anabaena were used (Table 1). Amplification scheme for this 2 primer sets consisted of an initial denaturation step at 94°C for 2 min and 35 cycles, in which one cycle consists in 3 steps: a denaturation step at 94°C for 30s; an annealing step at 58°C for 30s for anaC-gen primers and at 60°C for 30s for anaC-anab primers; and an extension step at 72 °C for 30s. An extract from a pure culture of an Anabaena sp. strain LEGE X-002 was used as a positive control and sterile water was used as a negative control for both primer sets.
For detection of the genes implicated in saxitoxin biosynthesis, sxtI 682F/877R primers were used for PCR amplification. The amplification protocol used for this primer set included an initial denaturation step at 94 °C for 3 min, followed by 35 cycles of denaturation step at 94 °C for 10s, an annealing step at 52 °C for 20s and an extension step at 72 °C for 60s. As a positive control an extract from a pure culture of an Aphanizomenon gracile strain LMECYA 040 was used and as a negative control was used sterile water.
The presence of all the amplified fragments was confirmed with an agarose gel electrophoresis at 1.5%, in the same conditions applied in the visualization of the total genomic DNA. In gel wells, it was loaded 10μL of PCR amplification product.
2.4.
Immunological assays (ELISA tests)
2.4.1.
Sample preparation
Samples (15 mL of water on sterile falcons) that were stored at -20 °C after sampling were defrosted. Afterwards they were sonicated, on maximum power (60Hz) during 5 min (on ice), using an ultrasound processor (Vibra Cell™ – Sonics & Materials Inc., Danbury, CT, USA.). For anatoxin-a tests, samples were treated under minimum light conditions, giving the molecule an increased stability. Later, 1.5mL of the sonicated sample was filtered using 0.45μm Whatman™ filters. Until the realization of all the ELISA tests, the samples were stored at -20 °C.
2.4.2.
ELISA quantification assays
ELISA quantification assays were done through the use of available commercial kits for the detection of the four cyanotoxins under this study: microcystins, cylindrospermopsin, anatoxin-a and saxitoxin. All the samples that were given positive results in the molecular analysis were used for quantification with this assay. The analysis of the obtained results was made using Microsoft™ Office Excel, performing the calculations provided by manufacters.
Microcystins
Microcystins quantification was performed using Microcystins/Nodularins ADDA ELISA kit (Microtiter Plate) (Abraxis, PA, USA). This test is based on the recognition of microcystins, nodularins and their isoforms with the use of specific antibodies. With this test, it is impossible to determine which microcystin congener is being produced so the obtained values are expressed as the total quantity of microcystin-LR equivalent present in the water sample.
The calibration for this test was made using standards at 0.15, 0.40, 1.0, 2.0, 5.0 μg/L levels and with a control at 0.75 ± 0.185 μg/L. The protocol was performed according to the manufacturer’s protocol using duplicated replicates. Microcystins present in the samples will compete with a Microcystin-protein analogue present in the plate for the binding sites of the antibodies present in the solution. Then, and after wash, it is added a second antibody-HRP label to the plate, which will again compete