Cyber Physical System applied in poultry production
Vitor Vaz da Silvaab,aDepartment of Engineering of Electronics, Telecommunication and Computers, ISEL/IPL - Instituto Superior de Engenharia de Lisboa, Portugal
bCTS-Uninova, Portugal vsilva @ deetc.isel.ipl.pt
Abstract — a use case of poultry counting on a production line
in Portugal is presented as a first step for Industry 4.0 application. Along the poultry production line there are several transformation and translation steps in which the fowls are subjected to, and their quantity in the line may change; some are removed or fall out and others are recovered and inserted in precise places of the line. Those changes can be used as an indicator of the status of the production line at that may influence the improvement of its efficiency. This paper presents a working solution of five wireless devices along a poultry production line and the complete system where data is stored locally for maintenance and supervisor decisions, and also data is stored at a remote database for management purposes which can be accessed by a mobile application.
Keywords: IoT, Industry 4.0, poultry, production line, Portugal
I.INTRODUCTION
Also known by ‘smart industry’, ‘intelligent industry’, ‘smart factory’ or ‘smart manufacturing’, the Industry 4.0 is related to the Industrial Internet, and since 2016 the Industrial Internet Consortium (IIC) and Industry 4.0 platform, “Plattform Industrie 4.0” [1].
The Portuguese strategy to develop industry in the digital area was launched in January 2017 as “Indústria 4.0”. It’s aim is to put Portugal at the forefront of the 4th Industrial Revolution by focusing on 3 axes: digitalisation, innovation and training [2]. The European Commission Document, Digital Transformation Monitor, Country: Portugal Indústria 4.0, dated May 2017 states: “Concentrated on identifying the real needs of the Portuguese industry, with a particular focus on SMEs as drivers of change, 120 Portuguese companies participated in the design of the strategy. During the next 4 years 60 public and private funded measures will be implemented. The measures are divided in 6 strategic pillars: human capital qualification; technological cooperation; start-up i4.0; financing and investment incentive; inter-nationalisation; and standards and regulation.” [2].
Portuguese government released its strategy by 2017.01.30 [3]. The financial budget is of 2.26 billion euros through Portugal 2020 programme of 4 years. An instrument “Vale
Indústria 4.0” was created that offers 7,500 euros to 1500 SME (Small and Medium Enterprises) that make a disruptive change on their model of business by contracting sites for electronic commerce or software for fabric management. The European Commission expects that the results’ in Portugal “Impact over 50,000 companies and train 200,000 workers on digital competences” [2].
The Internet of Things (IoT) is a generic term for all devices that can be connected to the internet and are enabled to sense or act upon the physical world [4,5]. It is shaping the development of technologies in the ICT (Information Communication Technology) domain [6]. A specific IoT is the Industrial IoT (IIoT), a cyber-physical system (CPS) in which real and virtual worlds merge as a cyber-physical production system (CPPS), where a secure framework is necessary [6,7].
The project presented in this paper began by the end of 2016 and the present installation has been running uninterruptedly since 2017.10.09. The place of installation is a poultry production plant in Portugal but the exact place cannot be divulged. It was installed as a prototype.
The motivation that led to this solution relates to the production plant in which it was installed. Poultry arrives in boxes defined by their weight and not by the number of fowls. The result of the production is not only the weight but the number of fowls or eventually in sets of parts. During the production process, poultry has to be removed from the line due to quality control or they fall out because of the mechanical handling process. The poultry removed is weighted and eventually counted. The clients usually expect a number of fowls within an average weight value. (e.g.: 5000 poultry with approximately 1.5 Kg each). To know the number of fowls in specific points of the plant line is essential for the maintenance and the number of poultry in and out of the system is important for the management.
Although this counting could eventually be made by the infrastructure that is already in the plant by adding equipment to its system, that solution could become very expensive. This document reflects the state of the art of this type of poultry production in Portugal where poultry counting is made by devices off the plant’s automation and control. It is an add-on system that does not interfere with the production plant but by acting as an observer, it can produce valuable indicators for management and maintenance decisions.
Several attempts by other parties to count the fowls at this production plant failed. The only knowledge the author was aware of the difficulties encountered by those parties came from conversations with the workers that were involved in those previous projects. That led to a rough design of solutions in which video cameras, acoustic sensors and lasers were also considered; mechanical counting which involved touching the poultry was set aside due to hygienic reasons. The acoustic sensors were used in this project as a first approach mainly because of the environment, and then they were set aside because of several reasons; there were four sensors at each counting point and at that time the algorithm could not distinguish completely one fowl from the other due to overlapping when the fowls were too big. A single laser option was then implemented and it gave better results. To count the poultry and determine the line speed, two optical sensors were then chosen as the best solution.
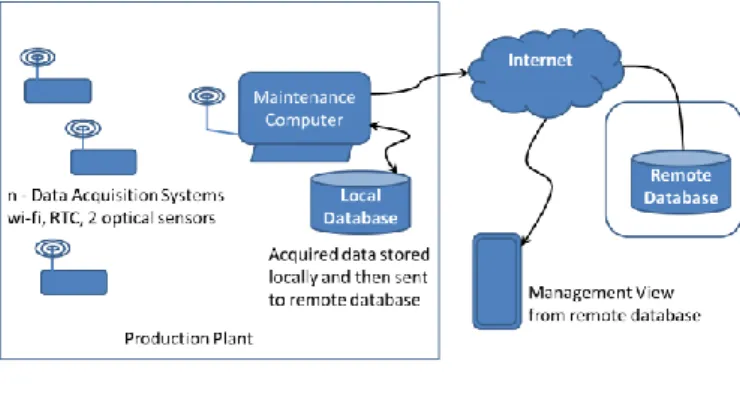
The proposed solution’s system diagram can be seen in Figure 1.
Figure 1 – System diagram
The project shown in Figure 1 consists of several cyber physical devices that are connected to an intranet structure.
Devices send the data to a computer that gathers and stores it in a local database. A user interface at that computer shows relevant information for production line supervisor and maintenance decisions. That same computer also sends data to be stored on a remote database. The management has access to the remote database for results and graphical views.
This introduction precedes the following organization of this paper: in section II a description of the poultry production line where the pilot installation is working, the hardware components, sensors and microcontroller modules, presented in section III CPS Infrastructure, sequenced by the CPS Logical level in section IV. Details of Data in graphical form and its analysis are found in section V, Results and Discussion. The paper ends with Conclusions and future expectations, acknowledgment to the poultry facility and the people involved and references related to this work.
II.POULTRY PRODUCTION
The poultry production line is composed by several different machinery that handles each fowl in sequence and individually. The poultry is hanged by the legs on hooks. All hooks are similar in form and dimensions, and are equally spaced on the same chain. There is a closed loop chain that
runs around a set of machinery. Whenever necessary to transport poultry from one closed loop chain to another, special machinery called transporter does the interface between those two closed loop chains. The hooks may differ in spacing and form on different closed loop chains. Closed loop chains can differ very much from each other in length, from hundreds of meters to a few kilometres. On Figure 2 are examples of the hooks used in this use case.
a) b) c)
Figure 2 – Poultry hooks; distance between legs x distance between consecutive hooks a) 95 x 60 mm, b) 95 x 30 mm, c) 105 x 30 mm To fit the whole chain in the production space the chain has turning points with a considerable radius to redirect the chain and hooks. At those places the hooks may oscillate as they also do when leaving machinery after being processed by it. The hooks shown in Figure 2 have two kinds of markings; the one on the top is where the sensor detects the hook presence and the ones at the bottom are where the legs are supposed to be present. The hooks are positioned side by side on all of the closed loops chains (other production lines can have different hooks and can be positioned one in front of the other).
The chain height from the floor may differ along the production process, as it has to be at eye level for hook uploading or extraction, and above a certain height so that a clear space for people or tall objects to go underneath, or even to be used as a temporary buffer space with the chain spiralling up or down for example for cooling purposes.
Chain line velocity can change along production time, a mean value for this use case is around 8500 bph (birds per hour). To maintain a continuous flow, the chain speed and hook phase is synchronized by the transporter on both chains. Failure can occur on the transportation process and it may increase with the production chain speed; the fowl may fall or may hang on the hook only by one of the legs. Some of the fallen poultry can be hanged up again by workers on the empty hooks, so that the sequential process for that poultry is executed. Some poultry which is considered unfit by quality control can be withdrawn from the hooks or not hanged at all; they are considered as rejected.
Poultry can be fed into the system from different production sources. To distinguish one source from another, called a set, a gap of 10 or more empty hooks is ensured for that purpose. When removing poultry due to quality control rejection, a gap can be formed that will be identified as a set marking. Although it does not affect the production line
accountancy it will influence the automatic set counting, but not the total count of poultry.
III.CPSINFRASTRUCTURE
The infrastructure can be described as two main components: the sensors, which are specific to the environment and can be changed by similar ones as long as they have the same interface, and the microcontroller hardware module, that can also be changed by similar ones as it happened during the development phase.
A. Sensors
Environment can be very harsh for sensors as they must withstand not only the reality of what they are sensing as also the washing process that occurs when the place where they sense has to be cleaned very frequently. Sensors may have a sparse living period; environmental damage, lose calibration, increase error or any other change that may affect its reading. Photoelectric diffuse-reflective sensors were chosen. These types of sensor illuminate the target with a light beam and read the reflected light. The output is an on/off signal that indicates the success of the reflected intensity. They can be set at a distance from two to eighty centimetres. To ensure that no physical contact is made between the poultry and the sensor, the sensors are placed around 25 cm apart. The light beam is harmless if viewed unintentionally. As almost any point between and away from machinery can be set as a place for the sensors, the best places are away from the turning points or other oscillating areas and above the workers height. Due to the type of sensor, the transparent surface which the light beams transverse must be free of unwanted obstacles. Degradation of that surface occurs with the environmental conditions as humidity and temperature fluctuations and also the chemicals used for the environmental cleaning and washing procedures. Figure 3 shows two different sensors used.
a) b)
Figure 3 – Photo reflective sensor a) Visible, b) Infrared
Two different diffused photo reflective sensors were used and shown in Figure 3, a) is a visible red light [9] and b) near infrared light [10]. Both have a plastic casing which did withstand the environment. The diffused visible light does give a hint of where the target is, and the infrared is invisible to the eye which makes it more difficult for good positioning. The positioning can be verified by placing a small obstacle on the place where the target should be. LEDs on the sensor and on the device, which is presented further down, indicate the presence of the obstacle in the sensors view. The sensors close a circuit when the target is present. The following specification is common for both sensors presented: The supply voltage is in the 10 to 30 Volt range, and the
maximum load current is 100 mA. A 12 V power supply is used for the sensors. The sensor output is configured as a NPN which means that it must have a pull up resistor. The sensor output is equal to the power supply voltage (0 mA) when there is no object detected and it has a low voltage (about 0.5 V) when the object is present sinking at most 100 mA. The device needs two sensors to work with, and any combination of the sensors presented can be used, or any other sensor that works as the specification described above.
The sensors are placed on the same vertical line and detect objects on the marks shown in Figure 2.
B. Microcontroller module
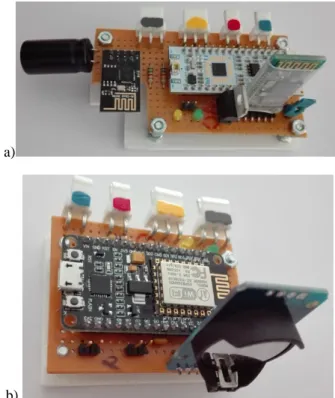
In the production line plant there is different machinery that uses wireless communication for their functioning, and there are several routers for communication purposes. The area where the sensors were set is sufficiently small for Bluetooth to be used. That setup was used in the beginning so as not to interfere with the wi-fi communication infrastructure. After proof of concept, communication was changed to use the wi-fi infrastructure. The prototype devices built and used are shown in Figure 4.
a)
b)
Figure 4 – Prototype devices a) with both Bluetooth and wi-fi b) with wi-fi and RTC (Real Time Clock) module
The first prototype with Bluetooth is presented in Figure 4a) and it is based on a ultra-low-power with FPU ARM Cortex-M4 MCU 80 MHz with 256 Kbytes Flash [11]. The software uses the Mbed OS-5 system and is programmed in C++ [12]. It has a Bluetooth HC-05 module. At first the Bluetooth seemed to be a good idea because all devices were within range, and the wi-fi system was dedicated to the already existing communicating modules of the plant. It ensured that this solutions’ bandwidth would not interfere with the existing communications. The counting was verified and it worked for some time till a decision to include another
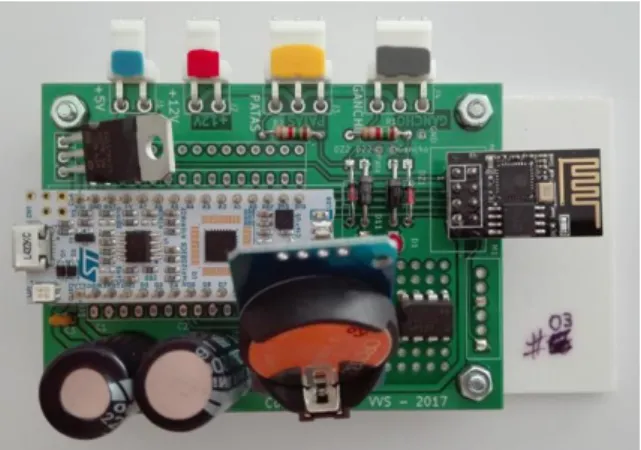
sensor outside the defined range occurred. Instead of extending the range with the Bluetooth solution the wi-fi option was considered and a router was installed for the use of these devices. So a wi-fi ESP8266-E01[13] module was added to the and used instead of the Bluetooth. An improved prototype was built and shown in Figure 4b). This is based on the ESP8266-E12 which has the wi-fi module and memory for code and data, which makes it a more attractive solution. Also a RTC DS3231 (real time clock) was added (even though the RTC function could be implemented within the processor) [14]. The systems’ software for this latter prototype was the Arduino IDE (Integrated Development Environment). The wi-fi library though was not stable enough and due to that reason the ESP8266-E12 was set aside for this project. A PCB was built and the final prototype is shown in Figure 5. It consists on the Nucleo L432KC (CPU), the ESP8266-E01 (wi-fi) and DS3231 (RTC) modules. Communication between the CPU and wi-fi module is done with a serial UART at 115200 bps, and the communication between the CPU and the RTC is done through an I2C bus. The software is downloaded through the
USB connection. The configuration is fixed on the present installation, but a serial interface using the USB can be used to configure the module. At this stage, OTA (Over The Air) configuration or software download is not available.
Figure 5 – Final prototype and in use at the installation.
Shown in Figure 5 are the external connections, from left to right: the blue is a 5 V input, the red a 12 V input, the yellow is the connection to the legs sensor and the grey the connection to the hook sensor. The 5 and 12 V power supplies are connected to the UPS (uninterrupted power supply) of the plant; otherwise a local battery could hold the system functionality for at least a day.
IV.CPSLOGICAL LEVEL
Communications on the plant can fail due to several situations as excessive traffic, inadequate configuration, new equipment installed, change of infrastructure and maintenance procedures, and many others. Due to a possible lack of communication, the devices must store the values read from the sensors. With this in mind the device software is structured as shown in Figure 6.
Each device can communicate by wi-fi through UDP (User Datagram Protocol) and TCP (Transmission Control
Protocol) sockets. The hook flow is sent by UDP to the Maintenance Computer (MC) viewing programme by every nth hook.
Figure 6 – Device program structure
For a configured n=40 and with a chain velocity of 9600 bph, there will be a frame every 15 seconds. That frame is for visualization purposes at the MC, and as it is sent over UDP means that there is no communication recovery if the frame is not received. The device identifies a set, (interval of more than 10 empty hooks) and restarts the counting for a new set. The set boundary values are stored in local flash memory (set begin and set end) with its associated timestamp. Whenever possible, a complete set data is sent to the MC through a TCP socket. The TCP ensures that there is data recovery if a communication error occurs. The set values are stored in a local database by the MC computer as shown in Figure 7.
Figure 7 – Maintenance Computer (MC) View Programme structure All frames sent by the device have a timestamp from the RTC. Received data by the MC is stored in a SQLite database. Access to previous data can be retrieved from that database and displayed at the MC. Data from the local database is then sent to a remote database for storage and Management purposes. The main reason for a local database instead of writing the received device data to the remote database is twofold. One that there may be communication difficulties between the plant and the remote database, and the other is that maintenance can have access to data whenever it is necessary. With this solution there is no data flow from the remote database back to the plant.
The remote database is at a web server as displayed in Figure 8.
Figure 8 – Web server programme structure
The web server and its database have two main purposes: to store data from the MC, and eventually other plants under the same management, and also to access the database from the Management View (MV) Programme. The Command Interface written in PHP (Hypertext Preprocessor), in Figure 8, has different functions that only select data from the database and present it to the user in HTML (HyperText Markup Language). Access to the command interface is for authorized users only.
The system has parameters that can be changed by a configuration program only available to the Maintenance officer, for example to add more devices to the production plant, replacing a faulty device by another or removing it.
V.RESULTS AND DISCUSSION
Data is produced almost continuously each production day. There are five devices installed at the production plant and for each hour in full production with a mean of 8000 bph assuming two sets per hour produces in total about 80K bytes of data. This means that one complete 8 hour shift will produce 640K a day, 15M a month and about 180 Mbytes a year. SQLite database’s total capacity of 140 Tera bytes would be capable of holding more than 800 thousand years of data. To do a backup of the SQLite database is very easy, it is a file and a copy can be made to an adequate type of media. The remote database backup would be controlled by the system administrator.
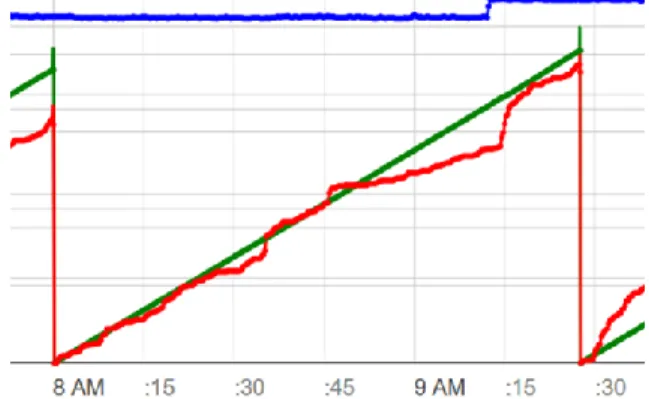
Data representation is made at the MC and MV platforms. Shown in Figure 9 is a detail of a sensors data in graph form.
Figure 9 – Sample of a graphic from a device’s data
A graphic using sensor data is displayed in Figure 9. Time resolution of the graphic is 15 seconds. The blue signal at the top is the mean chain speed. It shows a change in speed from 8600 to 8400 bph. The artefact that is clearly noted around every 11 minutes is the result of the chain having a joint that closes it as a continuous loop. The hook sensor detects a variation but the algorithm behaves correctly ignoring the sensed artefact as its lack can be seen on the count and fault signals. The lower red line indicates the number of empty hooks. The green signal indicates the continuous counting of the poultry. It seems to be a straight line because the number of faults is negligible compared to the total number of fowls; the worst case would be one less the maximum gap between
sets (9 in this case) that is why the green line seems unaffected. When there is a continuous count sequence of 10 or more empty hooks (red spikes) a new set is identified. As it can be seen on Figure 9, there are three complete sets.
Showing data as a graph and in a way that other similar graphs may be compared to can help understand how the production line is working. This kind of analysis is described with simple examples shown using parts of a graph in the figures from Figure 9 to Figure 11.
An increase in chain speed (from 8200 to 8600 bph) as shown in Figure 10 by the top blue line may have caused the increase on the number of faults, as the device whose data is shown on that figure is situated about two minutes down the production line and after a transfer point between two closed loop chains. This kind of observation, if it does correlate to the instantaneous chain speed, may help the Supervisor of the production line, for example to gradually increase the speed in several steps of 100 instead of a single 400 bph increase. This is an advantage to know and analyse the state of the line. This kind of analysis could be made by a machine learning system; an entity to be considered in a future version of this system, where it would easily fit along the data stream.
Figure 10 – An increase in chain speed (top blue line) may have caused the increase in faults (red) about two minutes down the chain. Changing the chain speed is very frequent along a day (as shown by the top blue signal line on Figure 11) and it does not necessarily mean a variation in faults (loss of poultry).
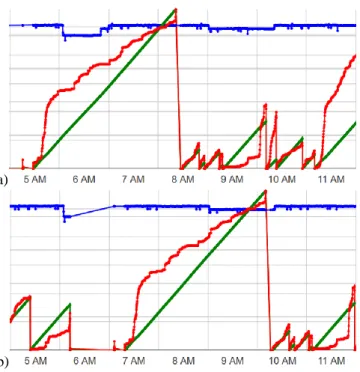
As it can be seen by comparing the faults (red line) between both graphs of Figure 11 that shows two devices that are a considerable distance apart (several kilometres within the cooling system) where the same hook is sampled again 105 minutes after on the next device. The similarity between both Figure 11 a) and b) indicate that there were no faults inside the cooling system. Observing the blue signal on both figures, and using the red signals on both as a guide, it is possible to find some artefacts that are on the same place, regardless of the chain speed. These artefacts are due to the hooks that, although being of the same type, do have wearing differences among them, and could be an indicator to the maintenance for a closer inspection or replacement. A similar situation is displayed in Figure 9, where the artefact shows up around every 10 minutes; it is probably due to the junction of the closed loop chain of that section.
system. The cooling system is a continuous chain loop of several kilometres that takes about 105 minutes to complete a cooling cycle, between both devices, at about 8600 bph.
a)
b)
Figure 11 – Data form a device a) before and b) after the cooling system By counting the poultry and faults at both ends of the cooling system and observing that the difference value is 0 is an indication of the good functioning of the devices and sensors and also that no poultry fell inside the cooling system.
At the end of the production day an Excel file is automatically produced only with the necessary results for the accountant. It also allows a date range to be chosen so that monthly or yearly results can be obtained.
VI.CONCLUSIONS
The outcome is a pilot project in poultry industry that proved the applicability and efficiency of an IoT-based system and provided interesting insights (via data analytics) to improve production and maintenance alerts. It has been in continuous operation with 5 devices every day for the past 10 months at the time of this writing. One sensor had to be substituted due to its casing. As the project is on its whole a prototype the locations in the plant where the devices and sensors were placed are not completely fixed and the sensors may move due to cleaning or other vibrating sources. Cleaning and maintenance is necessary for its efficient performance.
To improve the installation, sensors with metallic casing should be used. The sensors should also be within the visible spectrum and focused on the target so that a visible light line can be clear which will help positioning the sensor and aid maintenance. Automatic warning of sensor malfunction can also improve its attention to maintenance.
the basic requirements of the IoT elements [14,15].
Knowing the state of the production line by devices that are similar in functionality helps to understand where to improve and where the challenging points are. This data, in a future version, could be correlated and analysed by machine learning algorithms to determine the quality of the chain lines and support decisions in several of the production levels.
ACKNOWLEDGMENT
I am very grateful for being challenged by the poultry factory for this project, to create and develop a solution, and would also like to thank the Director and Maintenance officer with whom I worked close by and other workers that aided the installation and use the system daily.
REFERENCES
[1] C. Finance, “Challenges and solutions for the digital transformation and use of exponential technologies,” Deloitte, 2015.
[2] E. Commission, “Digital Transformation Monitor Country : Portugal ‘Indústria 4.0,’” no. May, 2017.
[3] República Portuguesea - XXI Governo Constitucional, “Governo lança estratégia para a Indústria 4.0.” [Online]. Available:
https://www.portugal.gov.pt/pt/gc21/comunicacao/noticia# 20170130-mecon-industria-4. [Accessed: 24-May-2018]. [4] L. Da Xu, W. He, and S. Li, “Internet of things in
industries: A survey,” IEEE Transactions on Industrial Informatics. 2014.
[5] J. Wan et al., “Software-Defined Industrial Internet of Things in the Context of Industry 4.0,” IEEE Sens. J., 2016.
[6] D. Miorandi, S. Sicari, F. De Pellegrini, and I. Chlamtac, “Internet of things: Vision, applications and research challenges,” Ad Hoc Networks. 2012.
[7] N. Cam-Winget, A.-R. Sadeghi, and Y. Jin, “Invited - Can IoT be secured,” in Proceedings of the 53rd Annual Design Automation Conference on - DAC ’16, 2016.
[8] L. Wang, M. Törngren, and M. Onori, “Current status and advancement of cyber-physical systems in manufacturing,” J. Manuf. Syst., 2015.
[9] Omron, “E3F1.” [Online]. Available:
https://assets.omron.eu/downloads/datasheet/en/v1/e94e_e3 f1_photoelectric_sensor,_compact_m18_housing_datasheet _en.pdf. [Accessed: 04-Jun-2018].
[10] Cytron Technologies, “E18-D80NK - User’s Manual,” 2012. [Online]. Available:
http://synacorp.my/v2/en/index.php?controller=attachment &id_attachment=506. [Accessed: 04-Jun-2018].
[11] STMicroelectronics, “Nucleo - L432KC.” [Online]. Available:
http://www.st.com/en/microcontrollers/stm32l432kc.html. [Accessed: 04-Jun-2018].
[12] Mbed, “Mbed OS 5.” [Online]. Available: https://os.mbed.com/. [Accessed: 04-Jun-2018]. [13] Espressif, “ESP8266-E01.” [Online]. Available:
www microchip.ua/wireless/esp01.pdf. [Accessed: 04-Jun-2018].
[14] Maxim-Integrated, “RTC - DS3231 Extremely Accurate I2C-Integrated RTC/TCXO/Crystal.” [Online]. Available:
[15] A. Knud and L. Lueth, “IoT basics : Getting started with the Internet of Things,” IoT Anal., 2015.
[16] J. Lee, B. Bagheri, and H. A. Kao, “A Cyber-Physical Systems architecture for Industry 4.0-based manufacturing systems,” Manuf. Lett., 2015.