Equity Market
Integration in the Euro
Area
JOSÉ JOÃO CONSTANTINO OLIVEIRA DOLORES
PH.D. THESIS IN BUSINESS AND MANAGEMENT STUDIES – SPECIALIZATION IN FINANCE
SUPERVISED BY
PROF. DOUTORA ANA PAULA SERRA
i
José João Constantino Oliveira Dolores was born on 22nd August 1986 in Santa
Marta de Penaguião, Portugal. In 2004, he was admitted to the Faculty of Economics of the University of Porto where he graduated in Economics in 2008. Afterwards, he was admitted to Católica Porto Business School where he obtained his MSc degree in Finance in 2011 and simultaneously, during this period, started his professional experience as guest assistant, teaching workshops in the “International Financial Economics” course and “Money and Financial Markets” course, both from the Economics and Management bachelor degrees.
João was admitted as a student in the Doctoral Program in Business and Management Studies with specialization in finance at the Faculty of Economics of the University of Porto in the end of 2010 and presented his thesis project in 2012.
João initiated his non-academic experience in 2011 as a Financial Analyst in Sonae Treasury and Finance department, Corporate Finance team. Since then, his professional experience is mainly focused on negotiating and contracting banking and market loans, on the preparation of financial reporting and monitoring the future funding needs.
ii
This work wouldn’t have been possible without the support of several different people across this long and challenging journey.
First of all, I would like to express my gratitude to my supervisor Prof. Ana Paula Serra for believing in me and my research and for never give up despite all the obstacles and limitations faced. This journey would not have been possible without her careful guidance, advices, vision, constructive comments and the countless hours of reviews and dedication. Her wide knowledge and experience also contributed to the enhancement of my financial knowledge.
My second acknowledgment must go to all comments and advices received during the several academic conferences attended and annual reviews procedures. This guidance, encouragement and advice was fundamental to enhance our work and to put it on track in order to reach its end.
Finally, but not less important, my gratitude to my family for their unlimited support, permanent love and encouragement that also helped make this possible. A special thanks to my Mom for the unconditional support, love and patient and Rita for never giving up, believing that this difficult step in our journey was possible and for her endless protection, love and motivation.
iii
This thesis proposes a multi approach to financial market integration through the perspective of investors and their portfolios. Financial integration has been one of the main goals of the European community after the Treaty of Rome. Financial market integration is a critical aspect of financial integration. Therefore, it is important to assess how the level of financial market integration has evolved in recent years.
Our research aims to investigate the behavior of investment funds in order to better understand the level and drivers of financial market integration in Europe and how it evolved through time in recent years since the euro introduction.
We start by proposing a new return-based approach to measure the degree of financial market integration. We examine the geographic investment style of equity investment funds that invested in the euro area over time. Specifically, we use a methodology based on the style analysis model proposed by Sharpe (1992) to measure the exposure of funds to euro and non-euro equity market benchmarks over time.
We also analyze the evolution of the allocation strategy of European equity investment funds, by examining their portfolio holdings. Considering the home (and euro) bias as proxy of financial market integration, we propose a model that accounts for the main drivers of the allocation bias over time and across funds. Finally, we investigate cross-border corporate ownership of European equity investment funds.
Results support the evidence reported by previous studies that financial market integration improved after the euro introduction followed by a partial setback just after the outbreak of the last financial crisis. Our results suggest a lower degree of integration in European equity markets outside the euro area. Yet the evidence also supports different levels of integration within the euro area. The results hold both for the return-based and the holdings-based approaches.
iv
Esta tese propõe uma abordagem multi-metodológica à integração dos mercados financeiros através da perspetiva dos investidores e das suas carteiras. A integração financeira tem sido um dos principais objetivos da comunidade Europeia após o Tratado de Roma. A integração dos mercados financeiros é um aspeto crítico da integração financeira. Assim, é importante aferir como tem evoluído o nível de integração dos mercados financeiros nos últimos anos.
A nossa investigação visa o comportamento dos fundos de investimento com o propósito de melhor perceber o nível e os determinantes da integração dos mercados financeiros na Europa e como esta tem evoluído, nos últimos anos, após a introdução do euro.
Iniciamos propondo uma nova abordagem com um modelo de retornos que mede o grau de integração dos mercados financeiros. Analisamos o estilo de investimento geográfico de fundos de investimentos em ações que investem na área euro ao longo do tempo. Em concreto, seguimos uma metodologia baseada no modelo de análise de estudo estilo proposta por Sharpe (1992) para medir a exposição dos fundos a benchmarks de ações euro e não euro ao longo do tempo.
Adicionalmente, analisamos a evolução da estratégia de alocação de fundos de investimento europeus de ações, através das suas carteiras. Considerando o enviesamento doméstico (e euro) como proxy da integração dos mercados financeiros, propomos um modelo que considera os principais determinantes dos enviesamentos e da alocação através do tempo e fundos. Por último, investigamos a detenção transfronteiriça de fundos de investimento europeus em ações.
Os resultados suportam a evidência, já reportada pelos estudos anteriores, de que a integração dos mercados financeiros melhorou após a introdução do euro, seguido por um revés parcial logo após a eclosão da última crise financeira. Os nossos resultados sugerem um menor nível de integração financeira nos mercados acionistas externos à área euro. Contudo, a evidência também sustenta a existência de níveis distintos de integração
vi
1. INTRODUCTION ... 1
1.1 Motivation and Importance ... 1
1.2 Literature Review ... 9
1.3 Purpose, Contribution and Overview of the Results ... 15
2. A NEW APPROACH TO MEASURE FINANCIAL MARKET INTEGRATION ... 18
2.1 Introduction ... 18
2.2 Data, Methodology and Variables ... 20
2.2.1 Sample Description ... 20
2.2.2 Methodology ... 22
2.2.3 Model Specification and Variables Definition ... 23
2.3 Preliminary Results... 26
2.3.1 Summary Statistics ... 26
2.3.2 Correlation between Geographic Benchmarks ... 29
2.4 Model Results and Analysis ... 31
2.4.1 Exposure to Euro and Non-Euro Factors ... 31
2.4.2 Home bias ... 38
2.4.3 Robustness Tests ... 46
2.5 Summary and Main Conclusions ... 48
3. EUROPEAN INVESTMENT FUNDS EQUITY HOLDINGS AND FINANCIAL MARKET INTEGRATION ... 49
3.1 Introduction ... 49
3.2 Data, Methodology and Variables ... 53
3.2.1 Data and Sample ... 53
3.2.2 Methodology ... 55
3.2.3 Model Specification and Variables Definition ... 56
vii
3.4 Empirical Results and Analysis ... 67
3.4.1 Home Bias ... 67
3.4.2 Euro Bias ... 69
3.4.3 Industry Analysis ... 71
3.4.4 Robustness Tests ... 72
3.5 Summary and Main Conclusions ... 74
4. THE CORPORATE OWNERSHIP LEVEL OF EUROPEAN INVESTMENTS FUNDS AND FINANCIAL MARKET INTEGRATION ... 75
4.1 Introduction ... 75
4.2 Data, Methodology and Variables ... 79
4.2.1 Sample Description ... 79
4.2.2 Methodology ... 82
4.2.3 Model Specification and Variables Definition ... 84
4.3 Preliminary Results ... 87
4.3.1 Summary Statistics – Corporate ownership of European funds ... 87
4.3.1.1 Corporate ownership over time ... 87
4.3.1.2 Corporate Ownership: Investment Destination ... 90
4.3.2 Summary Statistics – Explanatory Variables ... 98
4.3.3 Correlation ... 100
4.4 Empirical Results and Analysis ... 101
4.4.1 Ownership Model – Full Sample and Euro and Non Euro Area Funds . 101 4.4.1.1 Excluding Home Stocks ... 103
4.4.2 Ownership in Euro area stocks ... 105
4.4.3 Robustness Tests ... 106
4.5 Summary and Main Conclusions ... 107
5. CONCLUSION ... 109
viii
Table 1.1 - Weight of EMU Equities in Selected Countries’ Portfolios by Country/Region
... 7
Table 1.2 - Weight of Cross-border Equity in 2001 ... 8
Table 1.3 - Weight of Cross-border Equity in 2017 ... 8
Table 2.1 - Mutual Funds by Domicile Country ... 22
Table 2.2 - Variable Definition ... 25
Table 2.3 - RNAV by Domicile Country ... 27
Table 2.4 - RNAVL by Currency ... 28
Table 2.5 - RNAV by Sub-period ... 29
Table 2.6 - Univariate Analysis ... 29
Table 2.7 - Correlation between Benchmark Factor Returns ... 30
Table 2.8 - Style Analysis - Based Model ... 32
Table 2.9 - Style Analysis with Euro Foreign Exchange Rate Factor... 34
Table 2.10 - Style Analysis for the Mutual Funds based Inside/Outside the Euro Area 36 Table 2.11 - Home Bias Test ... 39
Table 2.12 - Home Bias Test for Euro Area Countries ... 41
Table 2.13 - Home Bias Test for Mutual Funds based in the UK ... 44
Table 2.14 - Home Bias Test for Mutual Funds based in the US ... 45
Table 2.15 - Ridge Regression ... 47
Table 3.1 - Mutual Funds by Domicile Country and Region ... 54
Table 3.2 - Variable Definition ... 57
Table 3.3 - DIFHOME (Actual minus Benchmark domestic holdings) by Fund Domicile Country ... 60
Table 3.4 - DIFEUROAREA (Actual minus Benchmark Euro area holdings) by Domicile Country ... 61
Table 3.5 - DIFEURO AREA EXCL. HOME (Actual minus Benchmark euro area holdings excluding Home) by Domicile Country ... 62
ix
Table 3.7 - Location Effects (Actual minus Benchmark holdings) ... 64
Table 3.8 - Industry Effects (Actual minus Benchmark holdings) ... 64
Table 3.9 - Summary Statistics ... 65
Table 3.10 - Correlation Matrix ... 66
Table 3.11 - Home Bias Results (Model 3.3) ... 68
Table 3.12 - Euro Bias Results (Model 3.3) ... 70
Table 3.13 - Robustness Test ... 73
Table 4.1 - Mutual Funds by Domicile Country and Region ... 81
Table 4.2 - Ownership Clusters Description ... 83
Table 4.3 - Ownership model - Variable Definition ... 87
Table 4.4 - Amount allocated by Domicile and Region – Average for the period between June 1997 and June 2011 for 834 funds ... 94
Table 4.5 - Ownership by Domicile and Region – Average for the period between June 1997 and June 2011 for 834 funds ... 96
Table 4.6 - Ownership Differences between Euro area and non-Euro area funds ... 97
Table 4.7 - Ownership split by TNA ... 97
Table 4.8 - Home Stocks Ownership split by TNA ... 98
Table 4.9 - Euro Area Stocks Ownership split by TNA ... 98
Table 4.10 - Summary Statistics for Explanatory Variables – Average for the period between March 2003 and June 2011 ... 99
Table 4.11 - Correlation between Variables – Average for the period between March 2003 and June 2011 ... 100
Table 4.12 - Total Ownership – Regression estimates ... 102
Table 4.13 - Total Ownership - subsample without Home Stocks ... 104
Table 4.14 - Euro Area Stocks Ownership ... 105
x
Figure 1.1 - Price-based and Quantity-Based Financial Market Integration Composite
Indicators ... 4
Figure 1.2 - Cross-border Equity Investment ... 6
Figure 2.1 - Style Analysis - Based Model ... 33
Figure 2.2 - Style Analysis: Funds based Inside/Outside the Euro Area ... 37
Figure 2.3 - Home Bias Test ... 39
Figure 2.4 - Home Bias: Euro Area Countries ... 42
Figure 2.5 - Home Bias: Funds based in the UK ... 44
Figure 2.6 - Home Bias: Funds based in the United States ... 45
Figure 2.7 - Variance Inflation Factor ... 46
xi ADR American Depositary Receipts
CAPM Capital Asset Pricing Model
CPIS Coordinated Portfolio Investment Survey
EA Euro Area
ECB European Central Bank
EGLS Estimated Generalized Least Squares
EMU European Monetary Union
FB Foreign Bias
GDP Gross Domestic Product
HB Home Bias
ICAPM International Capital Asset Pricing Model
IMF International Monetary Fund
NAV Net Asset Value
OLS Ordinary Least Squares
QO Quadratic Optimization
RBSA Return-Based Style Analysis
TNA Total Net Assets
UK United Kingdom
US United States
USD United States Dollars
VaR Value at Risk
VIF Variance Inflation Factor
1
1. INTRODUCTION
The aim of this thesis is to contribute to a better understanding of financial market integration in Europe. To understand the dynamics of financial market integration in recent times, we study the behavior European equity investment funds by examining their portfolio returns and their domestic and cross-border holdings and corporate ownership preferences.
This chapter introduces the topic of our research. Section 1.1 presents the motivation and importance of the topic and document the behavior of cross-border flows over the period 2001-2017. Section 1.2 provides a brief but comprehensive review of the related literature. We summon up the seminal studies, and the approaches proposed therein to measure financial market integration, from an asset pricing or an holdings’ perspective. In particular, we review the studies on home bias. Section 1.3 presents the purpose and the contribution of the research and an overview of our results.
1.1 Motivation and Importance
Economic and financial integration is one of the policy targets underlying the construction of the European project. The first step was taken in 1957 with the Treaty of Rome which established the creation of the common market as a central objective, only possible through the elimination of the barriers to capital movements (Wojcik, 2002).
Financial integration is critical for the future of European countries and regions: increasing capital flows across countries lead to higher cross-border holdings of financial assets broadening the investor base and therefore improving international risk sharing. At the same time, international capital flows raise accounting, disclosure, and corporate governance standards. Ultimately, financial integration enhances the efficiency of the financial system in capital allocation and therefore economic growth (Babecky et al., 2013, Wojcik, 2002). Notwithstanding, some authors provide evidence of negative impacts of the increase in financial integration, particularly in times of financial instability
2
(Mendoza et al., 2009, Babecky et al., 2013). The intensification process of globalization increases the interconnection between markets, increasing the sensitivity of domestic markets to global shocks, financial crises are no longer restricted to regional borders and contagion across markets may lead to greater financial instability. Furthermore, there could be insufficient access to funding due to capital concentration, resulting in inappropriate allocation of capital (Babecky et al., 2013).
Despite all the acknowledged benefits and importance given to capital market integration, several warnings have been raised in Europe. The first was the report that has emerged from the Committee of Wise Men, set up by the European Commission in the beginning of 2001, commonly known as Lamfalussy report (Wojcik, 2002). The report essentially called for more reforms at a regulatory basis but the lack of consensus about the level of integration that had been reached was evident. In part, this could be justified by the fact that, in practice and in the literature, there are very different ways to define and measure financial market integration.
Since the establishment of the euro area, several studies have assessed the impact of the monetary union on the integration of the capital markets. Examples are Fratzscher (2002), Guiso et al. (2004), Kim et al. (2006), Bartram et al. (2007), Cappiello et al. (2010), De Santis (2010) and Haselmann and Herwartz (2010). Regardless of the approach and measure used to proxy financial market integration, the evidence is rather consensual and suggests a positive impact of the introduction of the euro. Along with the euro introduction, the removal of formal restrictions to capital flows and the creation of common trading platforms and market infrastructures boosted liquidity and facilitated the financial integration process and cross-border portfolio flows (Adam et al., 2002, De Santis and Gérard, 2009). Yet, all these factors seem to produce portfolio allocations biased in favor of euro assets. To fully benefit from international diversification, investors would rather increase their holdings in non-domestic euro area assets (De Santis and Gérard, 2009, Vermeulen, 2013, Baele et al., 2004). Grossman and Leblond (2011) also conclude that there is increased financial integration in the euro area, but the effects appear to be weaker than initially expected, due mainly to the significant differences across member countries in terms of institutional structures, in which corporate
3
governance rules and practices may play a major role. These differences seem to deter cross-border holdings and international risk sharing.
Later, in 2008, the European Central Bank (ECB) issued additional warnings about integration in Europe. Although recognizing a considerable progress over the previous decade, mainly driven by the introduction of the euro, the ECB mentioned that the level of integration was far from the ideal. The ECB reported high level of segmentation in the infrastructures of the European securities markets, namely in equity markets.
All those warnings about the effects of incomplete financial integration have proved to be important over the last two decades. Europe and in particular the euro area, suffered several structural changes of which the introduction of the common currency and the great financial crisis1 are the most important (Baele et al., 2004, Bremus and Fratzscher, 2015). As stated by Kalemli-Ozcan (2016), worse than the level of segmentation is the asymmetry between European countries which leads to irregular reaction to shocks. The lack of bank and fiscal union increases the vulnerability of European countries to adverse shocks (Kalemli-Ozcan, 2016). The 2016 report from the European Central Bank (2016) shows that the financial and sovereign debt crises led to substantial financial fragmentation, a process that has not been reverted so far. This lack of integration, along with a common currency and monetary policy, is itself a cause of structural issues inside the euro area increasing the negative effects of shocks and establishing a barrier to growth and financial efficiency (Gal, 2015). As demonstrated by the warnings issued in the previously mentioned studies, the introduction of a common currency was not, for itself, a sufficient integration tool (Gal, 2015).
Due to the importance of financial market integration for the euro area, the ECB has been disclosing a set of indicators proxying financial integration and that are accompanied, since 2007, by an annual progress report on financial integration. The ECB constructs two composite indicators, a price-based and a quantity-based indicator, allowing a continuous monitoring of financial integration. The price-based financial
1 All mentions to financial crisis on this thesis reports to the 2007-08 global financial crisis which started
with the subprime crisis at the end of 2007 and then developed into a global crisis with Lehman Brothers default on September 2008.
4
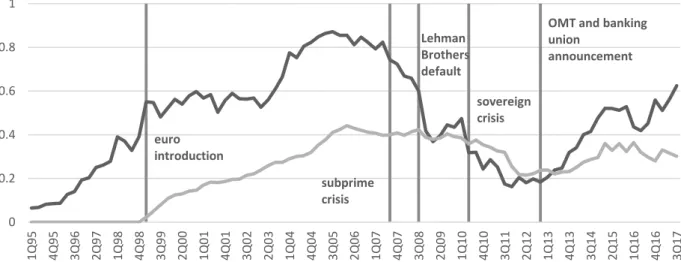
market integration indicator is computed using a selection of ten indicators that cover the main capital markets: money, bond, equity and banking markets. The quantity-based financial market integration is computed from a portfolio perspective, based on cross-border holdings. The composite indicators range from zero (full segmentation) to one (full integration) and are used as guidance for the ECB initiatives and policy definition. As shown in Figure 1.1, the last report of the European Central Bank (2018), provides an extensive overview of the financial market integration development since 1Q95.
Figure 1.1 - Price-based and Quantity-Based Financial Market Integration Composite Indicators Source: European Central Bank (2018)
Figure 1.1 highlights the relevance of the warnings issued over the last decades and already mentioned. After a strong reinforcement of financial integration is clear after the euro introduction in 1999, there is a setback during the period of the most recent financial crisis. The first negative impact occurs after the subprime crisis at the end of 2007 but the Lehman Brothers default on September 2008 precipitated the financial market integration to levels similar to that observed before the euro introduction. In 2012, in response to the financial crisis, the ECB announced the Banking Union and Outright Monetary Transactions (OMT). As shown in Figure 1.1, since then, there is an upward impact on financial market integration.
euro introduction subprime crisis Lehman Brothers default sovereign crisis
OMT and banking union announcement 0 0.2 0.4 0.6 0.8 1 1Q 95 4Q 95 3Q 96 2Q 97 1Q 98 4Q 98 3Q 99 2Q 00 1Q 01 4Q 01 3Q 02 2Q 03 1Q 04 4Q 04 3Q 05 2Q 06 1Q 07 4Q 07 3Q 08 2Q 09 1Q 10 4Q 10 3Q 11 2Q 12 1Q 13 4Q 13 3Q 14 2Q 15 1Q 16 4Q 16 3Q 17
Price-based Financial Integration Composite Indicator Quantity-based Financial Integration Composite Indicator
5
One of the main motivations of our study is to better understand the dynamics of financial market integration in recent times and how those fluctuations were reflected on equity investors’ cross border holdings.
Due to the changes in financial market integration level over the last decades, the ECB has established the goals of risk reduction and improvement of cross-country risk sharing. Along with that, ECB is also looking to complete the banking union and reinforce the capital market union as key initiatives to strengthen the level of financial integration in future years. All initiatives mentioned are strictly connected, as capital market union will improve cross-border financial risk sharing, leading to smother effects of economic cycles. Furthermore, capital market union will only be possible with more efficient and resilient market infrastructures which are important facilitators of cross-border flows.
Considering that financial integration is associated with the intensification of cross-border flows, a first macro scrutiny is possible through the dataset provided by the International Monetary Fund (IMF), Coordinated Portfolio Investment Survey (CPIS). CPIS is a voluntary data collection that gathers information of cross-border holdings of equities and debt securities. A first experimental survey was conducted in 1997, yet only a limited number of countries responded, so any conclusion based on this year should take that into account as mentioned, e.g., by Galstyan and Lane (2010). Since 2001, IMF reported this data uninterruptedly.
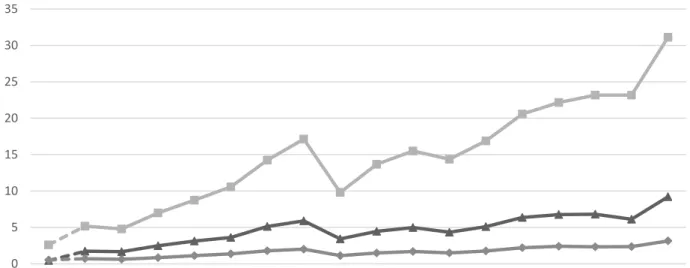
As mentioned before, the euro introduction had a positive impact on cross-border flows and thereafter plausibly on financial market integration as shown in Figure 1.2.
6 Figure 1.2 - Cross-border Equity Investment
Source: International Monetary Fund (2018)
Since 2001, the world cross-border flows increased in an expressive average annual rate superior to 30% from USD 5 trillion to more than USD 31 trillion. That is even more remarkable, considering the clear setback in the financial crisis period with a decrease of over 40% between 2007 and 2008. It took almost 6 years to reach the 2007 levels. The cross-border investment originated in the euro area countries shows an increase slightly above average, with better figures in the first year after the euro introduction.
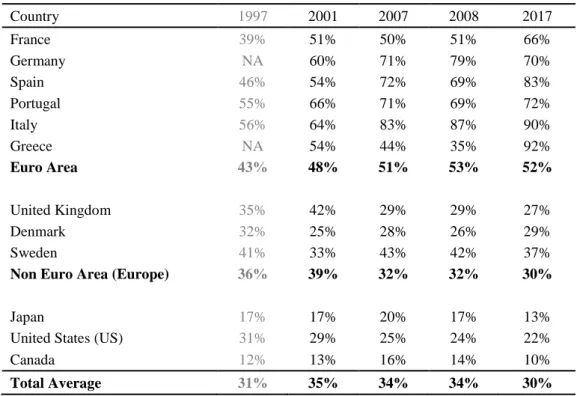
Despite the expressive increase of cross-border flows, on average, the weight of EMU equities in European countries’ portfolios has stayed relatively stable over the period 2001-2017 as shown in Table 1.1. Yet, for many countries, e.g., Spain, Italy or Greece, there was a relevant increase:
0 5 10 15 20 25 30 35 1997 2001 2002 2003 2004 2005 2006 2007 2008 2009 2010 2011 2012 2013 2014 2015 2016 2017 Total EMU Europe exEMU
7 Country 1997 2001 2007 2008 2017 France 39% 51% 50% 51% 66% Germany NA 60% 71% 79% 70% Spain 46% 54% 72% 69% 83% Portugal 55% 66% 71% 69% 72% Italy 56% 64% 83% 87% 90% Greece NA 54% 44% 35% 92% Euro Area 43% 48% 51% 53% 52% United Kingdom 35% 42% 29% 29% 27% Denmark 32% 25% 28% 26% 29% Sweden 41% 33% 43% 42% 37%
Non Euro Area (Europe) 36% 39% 32% 32% 30%
Japan 17% 17% 20% 17% 13%
United States (US) 31% 29% 25% 24% 22%
Canada 12% 13% 16% 14% 10%
Total Average 31% 35% 34% 34% 30%
Table 1.1 - Weight of EMU Equities in Selected Countries’ Portfolios by Country/Region Source: International Monetary Fund (2018)
Considering the amount invested in foreign assets, EMU equities represent on average 30% of that amount. Yet there are opposite behaviors for investors based inside the Euro Area and investors based in other European countries. Those based inside the Euro Area increase their investment in equities from other EMU countries since 1997, to a level as high as 90%, as it is the case of Italy and Greece in 2017. Investors based in other European countries reduced the weight of EMU equities over the period to levels close to 30%, close to the level observed for investors based outside Europe, e.g., investors based in the United States (US). This different behavior for investors based inside and outside the EMU could be interpreted as a first sign of imperfect financial integration even inside Europe. In countries outside Europe, the behavior is relatively stable, slightly decreasing over the period.
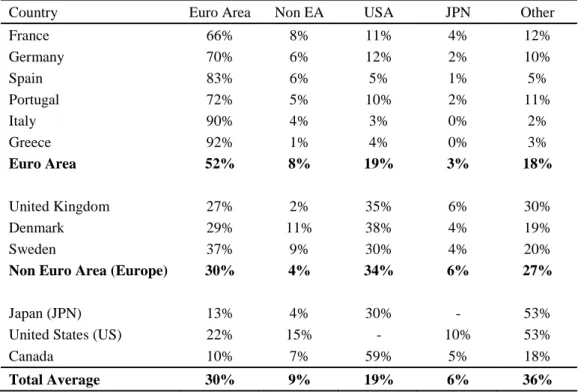
Table 1.2 and Table 1.3 show the structure of the different country portfolios, with the weight of cross-border equity holdings:
8 2001
Country Euro Area Non EA USA JPN Other
France 51% 14% 21% 4% 11% Germany 60% 13% 18% 2% 8% Spain 54% 19% 15% 6% 6% Portugal 66% 7% 13% 1% 13% Italy 64% 7% 16% 4% 8% Greece 54% 19% 20% 1% 6% Euro Area 48% 13% 23% 4% 12% United Kingdom 42% 4% 23% 9% 22% Denmark 25% 24% 31% 5% 15% Sweden 33% 16% 37% 5% 9%
Non Euro Area (Europe) 39% 7% 26% 8% 20%
Japan (JPN) 17% 14% 54% - 15%
United States (US) 29% 24% - 11% 37%
Canada 13% 11% 58% 6% 11%
Total Average 35% 16% 20% 6% 23%
Table 1.2 - Weight of Cross-border Equity in 2001 Source: International Monetary Fund (2018)
2017
Country Euro Area Non EA USA JPN Other
France 66% 8% 11% 4% 12% Germany 70% 6% 12% 2% 10% Spain 83% 6% 5% 1% 5% Portugal 72% 5% 10% 2% 11% Italy 90% 4% 3% 0% 2% Greece 92% 1% 4% 0% 3% Euro Area 52% 8% 19% 3% 18% United Kingdom 27% 2% 35% 6% 30% Denmark 29% 11% 38% 4% 19% Sweden 37% 9% 30% 4% 20%
Non Euro Area (Europe) 30% 4% 34% 6% 27%
Japan (JPN) 13% 4% 30% - 53%
United States (US) 22% 15% - 10% 53%
Canada 10% 7% 59% 5% 18%
Total Average 30% 9% 19% 6% 36%
Table 1.3 - Weight of Cross-border Equity in 2017 Source: International Monetary Fund (2018)
9
Investors based inside the Euro Area expand their weight on EMU equities by reducing their exposure especially to European (non-euro area) equities but also to US and Japanese equities. Considering that the euro introduction might have reduced the diversification gains inside the euro area, the final diversification benefits are controversial. On the other hand, investors based in other European countries (non-euro area) reinforced their exposure to US equities.
These figures show, in a macro perspective, that investors have material different portfolio allocations and allocation shifts depending on their location. These results suggest imperfect integration for these countries.
From an asset perspective, the relative weight of European equities has decreased substantially since 2001. For US and Japanese investors, the weight of European equities decreased, on average, 15 percentage points (pp) between 2001 and 2017. This apparently decrease of attractiveness of European equities is in part justified by the decrease of the weight of these equities in the world market capitalization, around 5 pp between 2001 and 2017 (World Bank).
1.2 Literature Review
Financial Market Integration is defined, as in most previous studies, using the “The Law of One Price” principle that states that: (i) two assets that have identical risk and return should be priced identically; and that (ii) two economic agents with identical utility functions should have similar portfolio allocations (Babecky et al., 2013, Baele et al., 2004, Adam et al., 2002).
From an asset pricing perspective, in a full financial markets integration scenario, returns would be generated by a single asset pricing rule and would be influenced only by global systematic risk factors (see, e.g., Adler and Dumas (1983), Errunza and Losq (1985) and Flood and Rose (2005) among others). However, direct barriers to free capital mobility prevent full financial market integration. Even within the same currency area, the existence of indirect barriers, such as tax and legal matters or accounting and auditing differences, impact the level of integration (Adam et al., 2002, Hartmann et al., 2003).
10
From an investor’s perspective, we should find a homogeneous allocation across investors domiciled in different countries. Yet, previous literature is quite consensual about the over preference for domestic assets, i.e., for stocks of companies based in the same country of the investor (Balta and Delgado, 2009, Schoenmaker and Bosch, 2008, Baele et al., 2007, Levy and Levy, 2014, Chan et al., 2009). That over preference for home assets, typically known as Home Bias (HB), is indicative of some degree of segmentation. Balta and Delgado (2009), e.g., use HB as a proxy of integration, and document increased levels of integration in the euro area over the last 20 to 25 years, even if heterogeneous across countries. Their evidence suggests further that the policies applied since the Lamfalussy report had different impacts in the euro area countries.
Cooper et al. (2013) characterized HB as the strongest and more persistence empirical phenomenon in finance that has puzzled academics for decades. Investors hold more domestic equities than any optimal choice theory could ever justify (Cooper et al., 2013). Cooper et al. (2013) report that on average, the gap between the share of domestic equities and the weight of that country in the world market portfolio is about 75 percentage points.
HB is not the only geographic investment phenomenon described by previous literature. Portes and Rey (2005) show that investors do not only overinvest in home stocks but also overinvest in markets that are geographically close to their domestic markets. This preference for local stocks was initially described and denominated “local bias” by Coval and Moskowitz (1999). Additionally, another phenomenon is also commonly considered: Foreign Bias (FB) to describe the consequent relative underweight in stocks issued in markets more distant to home (Cooper et al., 2018).
The over preference for domestic assets is irrational according to the finance theory. Investors lose the benefits of international diversification, which would allow them to maximize return for a determined level of risk (Cooper and Kaplanis, 1986, French and Poterba, 1991, Schoenmaker and Bosch, 2008, Balta and Delgado, 2009). Essentially, finance theory assumes that the opportunity cost of under-diversification is
11
clearly superior to any benefit that could be driven by concentrating the portfolio in domestic equity market (Goetzmann and Kumar, 2008, Cooper et al., 2013)2.
However, some extant literature states that this position ignores the possibility of international diversification at home. Errunza et al. (1999) show that it is possible to exploit diversification opportunities at home through the investment in domestically traded multinationals, closed-end country funds and American depositary Receipts (ADRs). Investors could mimic foreign market indices and achieve a portfolio that is internationally efficient using those domestic instruments (Errunza et al., 1999, Cooper et al., 2013).
The typical approach to measure HB is to compare the actual allocation with the optimal portfolio weight (Cooper et al., 2013). However, choosing the correct benchmark for the optimal portfolio could be challenging. Most of the previous literature follows the approach of determining the benchmark weights through an asset pricing model. The model commonly used is the CAPM or its international version (ICAPM) proposed by Solnik (1974) and Sercu (1980) (Cooper et al., 2013). Both models assume identical investment opportunities and that there are no transaction costs or taxes, so all investors should hold the world market portfolio. In this portfolio, the weight of each asset is equal to the relative share of the country in the world market capitalization (Cooper et al., 2013). After choosing the benchmarks, the simplest and more intuitive way to measure HB is the one followed by, e.g., Cooper and Kaplanis (1986) or Brealey et al. (1999) in which HB is given by the difference between actual and optimal allocation. Other and more complex approaches to measure HB emerged in more recent years. It is also worth highlighting the log-ratio scaled approach, used by Chan et al. (2005) and Lau et al. (2010), which enables to smooth larger biases, or the more recent measure advocated by Cooper et al. (2013) who proposes a logistic transformation of standardized bias to reduce the worst forms of heteroscedasticity. Finally, recovering the two related phenomena of Home and Foreign Bias other approaches, which focus on distance and gravity models, emerged relating HB to distance (Portes and Rey, 2005, Cooper et al., 2018, Floreani and Habib, 2018).
2 Nevertheless, according to distance models, investors may not take advantage of that diversification
12
Despite all the different proposals to measure HB, one outcome is common: the evidence is a high level of HB. Several studies try to understand this puzzle and suggest many arguments that could, at least in part, justify it. The arguments stressed by previous literature can be grouped in five main categories: (i) measurement issues; (ii) explicit costs and barriers; (iii) information asymmetries; (iv) corporate governance/transparency and agency differences; and (v) investor preferences (Balta and Delgado, 2009, Schoenmaker and Bosch, 2008, Dahlquist and Robertsson, 2001, Cooper et al., 2013, Levy and Levy, 2014, Mishra, 2015).
The first set concentrates some arguments/doubts about the necessity of hedging for home-country specific risks and investment abroad in order to achieve international diversification. Investors have typically larger exposure to domestic risks such as inflation, real exchange rate and risks from non-tradable goods (Cooper et al., 2013). So, investing in domestic stocks could be merely a way to hedge those risks. As shown by Friend et al. (1976), domestic stocks could be a good solution to hedge inflation risk. On the other hand, as exposed by Errunza et al. (1999) and others, international diversification may be achieved through domestic holdings. All that attained by avoiding international barriers to investment and higher transactions costs.
Explicit costs and barriers are the second group of arguments and one of the earliest explanations to the HB phenomenon (Cooper et al., 2013). Those early studies pointed out a few arguments that could justify the over preference for domestic assets: (i) higher transaction costs for foreigners; (ii) withholding taxes; (iii) restrictions on foreign equity holdings; (iv) risk of expropriation and (v) control of capital flows (Black, 1974, Stulz, 1981, Errunza and Losq, 1985). The consensus about those arguments has never been achieved and a few studies show some contradictory facts. Additionally, some of these barriers could be true in the 80’s but have been dismantled since then. Bekaert and Harvey (1995) pointed out that when looking at emerging markets, other barriers could be more relevant. In this case, (i) poor credit ratings; (ii) high and variable inflation; (iii) exchange controls; (iv) poor regulatory and accounting standards and (v) lack of country funds and cross-listed securities might play a major rule.
Information asymmetries is one of the most prevalent arguments raised by previous literature and follows a simple premise; investors prefer domestic stocks because
13
they perceive them as less risky (Cooper et al., 2013). That perception arises as investors claim to know and understand better the business practices and economic environment. Additionally, this information asymmetry could also be translated into extra costs in order to treat, translate and interpret information disclosed in a foreign language (Grinblatt and Keloharju, 2001). Investing in foreign stocks may lead to increased costs due to different cultures, religions or habits which could reduce the attractiveness to invest abroad (Grinblatt and Keloharju, 2001). The previous studies that focused their study on information asymmetries used frequently proxies to measure it also controlling for other factors such as transaction costs. Based on those studies, the proxies used could be classified in three classes of proximity measures: (i) geographical proximity; (ii) cultural proximity and (iii) economic proximity (Ahearne et al., 2004, Sarkissian, 2004, Chan et al., 2005, Portes and Rey, 2005, Lane and Milesi-Ferretti, 2008, Bekaert and Wang, 2009, Cooper et al., 2018). More recent studies show that even a very small perception of information advantage leads the investor to overinvest severely in domestic assets (Van Nieuwerburgh and Veldkamp, 2009, Andrade and Chhaochharia, 2010). However, if that information advantage is real, we should assume that investors would select their stocks better and consequently show higher returns on their investments. The previous empirical evidence is far from consensual and some studies, e.g., Grinblatt and Keloharju (2001) and Huang and Shiu (2009) proved that foreign investors have higher returns than domestic investors and Seasholes and Zhu (2010) show that portfolios of local stocks do not have outperform global portfolios. In contrast, Malloy (2005) and Bae et al. (2008) show that local analysts outperform foreign analysts. Lastly, Bailey et al. (2006) also show that cross-listings contribute to decrease information asymmetries.
The fourth category of arguments is partially linked to information asymmetry. The main drivers of HB are informal barriers such as lack of transparency, complexity and corporate governance issues at a company level and political risk at a country level (Cooper et al., 2013). At a company level typically, the corporate governance issues could emerge when companies are controlled by an insider shareholder and have limited free float and non-trivial likelihood of private benefits extraction (Shleifer and Vishny, 1997, Dahlquist et al., 2003, Stulz, 2005, Giannetti and Simonov, 2006). As mentioned by Gelos and Wei (2005) both corporate governance and transparency influence international portfolios holdings. Foreigners are less attracted by companies based in countries with
14
less reliable financial and legal systems, with poor disclosure rules and with ownership structures that are conducive to governance problems (Gelos and Wei, 2005, Cooper et al., 2013). Along with the conflict between insiders and outsiders, there is an extra agency problem, the risk of expropriation (Stulz, 2005). This extra problem also affects international portfolio holdings in three ways: (i) countries with poor governance are conducive to the existence of controlling shareholders; (ii) smaller countries show more exposure to foreign investors and simultaneously investors based in these small countries need to invest abroad; and lastly (iii) countries with higher risk of expropriation have a lower fraction of wealth held by foreigners (Cooper et al., 2013).
Scrutinized the rational explanations for the persistence of HB, a last and with increasing importance category of drivers for HB is based on behavioral finance theory. Psychological factors such as overconfidence, over optimism, familiarity, and patriotism are used to explain investors’ behavior (Fox and Tversky, 1995, Tversky and Kahneman, 1991, M. Barber and Odean, 2001, Karlsson and Norden, 2007, Cooper et al., 2013, Solnik and Zuo, 2017). Previous studies demonstrate that investors miscalculate their competence on judging foreign stocks and their overconfidence, leading to an overinvestment in domestic assets based on the perception of information advantage (French and Poterba, 1991, Kilka and Weber, 2000, Dahlquist and Robertsson, 2001, Strong and Xu, 2003, Dorn and Huberman, 2005, Schoenmaker and Bosch, 2008, Balta and Delgado, 2009, Levy and Levy, 2014, Mishra, 2015). However, as mentioned by Strong and Xu (2003) optimism alone does not seem to be sufficient to justify the high level of HB documented.
More common behaviors such as “familiarity bias” or “friendship bias” have also been stressed (Merton, 1987, Huberman, 2001, Berkel, 2004). Huberman (2001) argues that investors prefer to hold stocks from familiar companies, which means domestic ones, and so investing in foreign assets generates a sense of discomfort and fear. Kang and Stulz (1997) reinforce this idea, showing that foreigners prefer large companies which could reflect a familiarity effect. This behavioral trait is somehow linked to the previously mentioned rational argument of information asymmetry: large companies are more well-known and more liquid than smaller companies and it is easier to gather information about those companies, resulting in lower transaction costs (Kang and Stulz, 1997). More
15
recently another behavioral trait pointed out as a possible driver of HB is patriotism. Morse and Shive (2011) show in countries with higher patriotism level, home bias is more prevalent. Finally, some studies linked HB to a lack of investor sophistication (Goetzmann and Kumar, 2008, Grinblatt and Keloharju, 2001, Karlsson and Norden, 2007).
Other studies have used different approaches to measure financial market integration. For example, Wojcik (2002) analyzes cross-border corporate holdings. Pungulescu (2013) looks at a battery of credit, bond and stock market indicators, as well as indicators based on household and firm decisions. Bekaert et al. (2013) look at industry valuation multiple differentials across markets.
1.3 Purpose, Contribution and Overview of the Results
We aim to improve our understanding of financial market integration by examining the portfolios of institutional investors.
In chapter 2, we propose a new approach to measure financial market integration estimating geographical portfolio shifts during the last decades. We adapt the style investment model proposed by Sharpe (1988, 1992). We replace the original the style asset classes by geographic benchmarks.
We contribute to the literature from a methodological standpoint, by proposing a new approach to measure financial market integration. We adapt a well-established model, used for different purposes, which is easier to apply and not so demanding in terms of data requirements and computational procedures. We show that our approach, although less demanding on data, is as robust as the previous approaches proposed by the existing literature.
We further contribute to the literature by providing an extensive study of financial market integration in Europe and employing both return-based and holdings-based approaches to evaluate financial integration over time and across countries. We assess how financial market integration has evolved since the euro currency introduction in 1999 and how the integration process was affected by the recent financial crisis. Finally our
16
study is among the first studies to explore and test the corporate insider theory implications for financial market integration.
In chapter 2, we use a new return-based approach with a sample of 2,880 investment funds investing in Europe from March 1999 to December 2013. Our findings show a clear preference for euro area stocks which become less evident after the euro introduction due to the increase of the relative importance of other non-euro factors. That pattern suffered a setback with the advent of the financial crisis, with the euro area factor regaining importance. Those findings reinforce the conclusions of previous studies that claim an intensification of the financial integration following the euro introduction, especially inside the euro area. However, we also find a reversion of the level achieved caused by the financial crisis. Additionally, when we split our dataset by fund location, we find different reactions and behaviors which also suggest partial financial segmentation, even inside the euro area.
In chapters 3 and 4, we examine the portfolio holdings of a sample of European mutual funds. By looking at institutional investors’ portfolio holdings, we gain a better understanding of the geographical shifts on their allocation strategy and investment destinations, as well as of corporate ownership decisions.
In chapter 3, we use an holdings-based approach to evaluate financial market integration. Assuming that home bias is a good proxy of financial market integration, we evaluate the role of the several arguments that have been put forward to explain home bias over time and across funds located in different European countries. We propose a specification model that accounts for the determinants of home bias. We evaluate the impact of the euro introduction, and of the global financial crisis. Our sample includes the holdings of more than 1,000 investment funds, domiciled in 16 different European countries, from 2Q97 to 2Q11. Home (euro) bias is estimated by the difference between actual and ICAPM optimal allocations. Our results are consistent with the evidence presented in chapter 2. Home bias has been decreasing since the euro introduction. Moreover, we find that home bias is lower inside the euro area suggesting different levels of integration in Europe. However, even inside the euro area, the level of integration is not equally shared by all members, with funds based in Portugal, Italy, Greece and Spain showing higher excess exposure to domestic assets. Inside the euro area, the euro
17
introduction seems to have shifted investors’ preferences from domestic assets (home bias) to euro area assets (euro bias). The financial crisis has led to a setback, with an increase on the level of home bias. There is also evidence of a decrease in the financial stocks’ holdings, especially in those countries where the phenomenon of home bias is more pronounced, counterbalanced by an increase in investment in health care and energy stocks.
Finally, in chapter 4 we refocus the analysis and examine portfolio holdings from a corporate ownership perspective. We look at domestic and foreign corporate ownership levels and explore to what extent cross-border corporate ownership levels reflect financial market integration. We propose a specification model to evaluate the role of corporate insider theory implications and other control variables to explain the time series and cross-sectional variability of corporate ownership levels given by the holdings of a large sample of European investment funds. Our findings are consistent with the corporate insider theory but there are a few inconsistent results in particular when we rerun our model for different subsamples of funds and holdings. Overall results suggest imperfect integration but are not conclusive.
All in all, the evidence we gathered from our multi-perspective analysis has given us a better understanding of the financial integration process in the euro area. Results support that financial market integration clearly improved after the euro introduction followed by a partial setback just after the outbreak of the last financial crisis. Over the last decade, within the euro area, the home bias phenomenon has been reduced and replaced by euro bias in portfolio allocation. Our results suggest a lower degree of integration in European equity markets outside the euro area. The evidence also supports different levels of integration within the euro area.
The remaining of this thesis is structured in four chapters that include the three above mentioned essays and a concluding chapter that highlights the main research results, points out the major shortcomings and presents some suggestions for future work.
18
2. A NEW APPROACH TO MEASURE FINANCIAL
MARKET INTEGRATION
2.1 Introduction
Considering the state of the art regarding the measurement of financial market integration, in this study, we propose an easier and intuitive way to measure financial market integration. The main contributions of the essay are to propose and empirically evaluate a new approach to measure integration focusing on geographical portfolio style shifts of equity investment funds. The idea of using portfolio holdings and the relative weights of home and foreign assets as an indirect measure of financial integration, was initially suggested by Adam et al. (2002). We follow their suggestion but instead of using portfolio holdings, we estimate the exposure of portfolio NAV returns to several geographic stock market benchmarks. As described by Dor et al. (2002) and Dor et al. (2008), using a Return Style Based Analysis (RBSA) approach should not bias our results due to the equivalence of both approaches (the return based and the holdings-based). Additionally, although the RBSA approach is easier to implement and interpret, there are some constraints: this approach relies on the correct specification of the benchmarks, it is difficult to draw conclusions concerning the future and, lastly, it is slow in detecting style changes (Dor et al., 2002, Maier and Scholz, 2018). In short, the advantage of our approach is the easiest application of the methodology, which is based on a very well accepted model. Furthermore, style analysis allows us to picture time varying integration with easily accessed data.
Given that institutional investors, particularly investment funds, are the main players in today’s major capital markets in terms of equity holdings, we focus on equity investment funds. According to the Investment Company Institute (2015) and the International Investment Funds Association (2016), by the end of 2016 there were more than 80 thousand investment funds managing over USD 37 trillion of assets, of which USD 16 trillion were invested in stocks. This importance is also noticed by previous literature such as Faias et al. (2017) or Huang (2015). Despite their importance and their
19
professional management, mutual fund managers also display behavioral biases and, this way, could be representative of all investors (Pool et al., 2012).
We focus on investment equity funds that invest mostly in the euro area. We also analyze a longer period of time when compared to previous studies. We assess how the process of stock market integration has evolved since the euro currency introduction in 1999 and whether or not integration was affected by the recent financial crisis.
In our study, we use the Lipper data set by Thomson Reuters that includes equity funds invested mostly in the euro area. After excluding offshore, small and highly concentrated funds, our sample consists of 2,880 funds from March 1999 to December 2013. We have adapted the style investment model proposed by Sharpe (1988, 1992) to estimate the geographic allocation of investment fund portfolios.
Our findings indicate an increasing importance of the euro area benchmark factor over time, which is in line with the evidence reported in previous studies. However, the level of importance is clearly time-varying showing a gradual decrease sometime after the introduction of the euro. This decrease accompanies an increase in the relative importance of the stock market factors outside the euro area, particularly regarding to Europe non-euro and to the US/Canada factors3. With the advent of the financial crisis4, we observe that the euro area factor regains a large part of its initial importance when compared to other factors, and is mirrored by the decrease in the exposure to the stock market benchmark outside the euro area, in particular the exposure to the US benchmark factor. This “euro bias” phenomenon is in line with the findings of Balli et al. (2010).
We performed several model variations, mostly to test the effects of currency factors and/or the domicile of the fund. The results are robust except for the subsample of funds domiciled outside the euro area which confirms the prominence and increasing exposure to the euro factor. The decrease in financial integration following the financial crisis is similar to funds based inside and outside the euro area but, thereafter, we find no evidence of a reversion to the pre-crisis level of exposure to the euro area factor. In the
3 The Europe non-euro factor excludes all the European countries that belong to the euro area. 4 We establish the advent of the crisis as the Lehman Brothers’ bankruptcy in September 2008.
20
case of non-euro area funds, the evidence suggests that there is a different level of integration inside and outside the euro area.
In order to validate the finding of excessive exposure to home or euro area factors, we construct a different specification for the style investment model. We simply redefine the independent variables/factors used, considering now only three factors: a benchmark for home, for the euro area and for the rest of the world. We find evidence that reinforces the idea that the financial crisis increased the phenomenon of home (euro) bias. Nevertheless, we also find that the impact differs across countries, even inside the euro area, suggesting different levels of financial integration.
The remainder of the chapter is organized as follows: Section 2.2 describes the data and the methodology, Section 2.3 presents our main results and Section 2.4 presents the main conclusions and final remarks.
2.2 Data, Methodology and Variables
2.2.1 Sample Description
We use the Lipper investment fund dataset from Thomson Reuters, the selection obtained included funds that invest in average more than 70% in stocks based in the euro area between March 1999 and December 20135. We collect fund data, on a monthly basis,
regarding the actual status6, the domicile, currency, Net Asset Values (NAV) and Total
Net Assets (TNA). Based on this information, we computed NAV returns in euros (RNAV) and in the denomination currency of the fund (RNAVL), as well as the number of shares/units of each fund.
We identified a total of 7,274 funds, but many of these funds had missing information, extreme values for TNA, unusual number of shares and other potential
5 The dataset obtained, for which we did not previously make any pre selection, does not provide
information related to the countries/regions of investment. We selected a subsample and through the public information available on Morningstar, Inc website we analyzed the allocation strategy of each fund. On average, the funds in the subsample invested 73.6% of the NAV in stocks based in the euro area, reaching 86.9% when considering all the European Stocks. The maximum allocation in stocks based in the euro area was around 99% and the minimum around 50%. The remaining was invested in stocks based outside Europe.
21
problems. For example, 130 funds had less than 100 shares and 200 funds had a TNA below 10,000 euros, with very limited liquidity and, in some instances, owned only by a single investor. In addition, 75% of the funds were domiciled in only four countries.
Following previous studies that used the Lipper dataset, in which those issues had also been identified, we eliminate funds that met the criteria suggested in Ferreira et al. (2012, 2013). We first eliminated funds with ten or less shares and with TNA less than ten thousand euros. Secondly, to identify funds that most probably were not actively managed, we removed those funds with domicile in a country that had less than ten funds registered in the Lipper dataset. Finally, and to avoid bias generated by funds that might have been created for tax management or other legal purposes, we eliminated all funds domiciled in offshores7. The final sample includes a total of 2,880 funds.
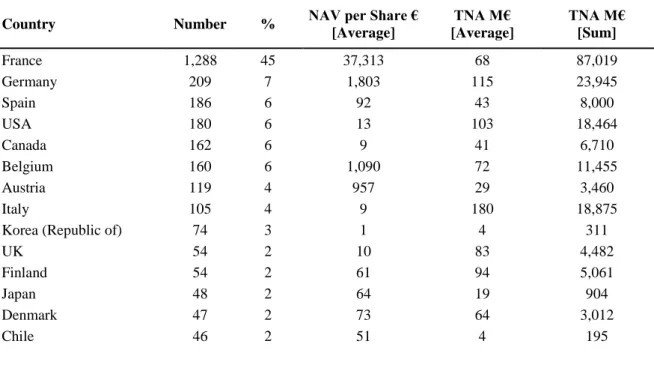
Table 2.1 presents the summary statistics for the sample funds. 45% are based in France and over 65% are based in four countries. These funds manage assets over 199 billion euros while the average fund manages close to 70 million euros. Across countries, there are wide differences in terms of the number of funds, size and value of assets under management.
Country Number % NAV per Share € [Average] TNA M€ [Average] TNA M€ [Sum] France 1,288 45 37,313 68 87,019 Germany 209 7 1,803 115 23,945 Spain 186 6 92 43 8,000 USA 180 6 13 103 18,464 Canada 162 6 9 41 6,710 Belgium 160 6 1,090 72 11,455 Austria 119 4 957 29 3,460 Italy 105 4 9 180 18,875
Korea (Republic of) 74 3 1 4 311
UK 54 2 10 83 4,482 Finland 54 2 61 94 5,061 Japan 48 2 64 19 904 Denmark 47 2 73 64 3,012 Chile 46 2 51 4 195
7 We follow the criteria by IMF Monetary and Exchange Affairs Department (2000) to define offshore
22
Country Number % NAV per Share € [Average] TNA M€ [Average] TNA M€ [Sum] Australia 37 1 6 10 358 Sweden 33 1 25 128 4,238 Portugal 20 1 12 34 677 Norway 12 0 92 78 941 Saudi Arabia 12 0 60 39 472 Argentina 12 0 0 1 14 Greece 11 0 10 43 476 Poland 11 0 47 14 157 Total 2,880 100 16,932 69 199,224
Table 2.1 - Mutual Funds by Domicile Country
Our sample composition is in line with the figures reported by the European Fund and Asset Management Association at the end of 2013. Excluding the funds domiciled in offshores, France is clearly the country with the most funds and, consequently, a higher concentration of Total Net Assets, Germany and Spain follow.
2.2.2 Methodology
Considering that our purpose is to understand financial integration on the basis of investment fund portfolio allocation, we use a model that allows estimating the allocation preferences of fund managers over time, and in particular, a model that analyzes fund exposure to the euro and non-euro area stocks. We use the widely adopted Style Analysis model of Sharpe (1988, 1992), that we have adapted to capture geographic style exposure and exposure shifts.
Sharpe’s model (1992) was devised to classify funds a priori defined restricted asset classes. The model uses quadratic programming to find the exposures of a fund NAV returns to the returns of a set benchmark asset classes (Sharpe, 1988). The model is indeed a generic factor model:
23
where (𝑅𝑖𝑡) is the periodic investment return, (𝐹𝑗𝑡) is the value of the jth factor (j=1 to
N), 𝛽𝑖𝑗 is the sensitivity of fund i to factor j, ℯ𝑖𝑡 is the residual (Atkinson and Choi, 2001).
The main objective is to find the best asset allocations 𝛽𝑖𝑗 to the asset classes restricted to a total exposure of 100% (sum of 𝛽𝑖𝑗). This allocation/style (set of asset class exposure) is reached by minimizing the sum of residual squared (∑ 𝑒𝑖𝑡2) with all constraints in equation (2.2):
∑ 𝑒𝑖𝑡2 = [𝑅
𝑖𝑡 − (𝛽𝑖1𝐹1𝑡+ 𝛽𝑖2𝐹2𝑡+ ⋯ + 𝛽𝑖𝑁𝐹𝑁𝑡)]2 (2.2)
Indeed, this technique is similar to Ordinary Least Squares (OLS) estimation. The objective is identical; to minimize the sum of residual squared. However, in the quadratic programming some constraints are imposed on the exposure coefficients for which OLS could not be so flexible.
2.2.3 Model Specification and Variables Definition
In our base model specification below RNAV are the NAV returns of the investment funds. The independent variables are four geographic benchmark factors.
𝑅𝑁𝐴𝑉𝑖𝑡 = 𝛽𝑖1𝐸𝑀𝑈𝑡+ 𝛽𝑖2𝐸𝑈𝑅𝑂𝑃𝐸𝑋𝐸𝑀𝑈𝑡+ 𝛽𝑖3𝑈𝑆𝐶𝐴𝑡+ 𝛽𝑖4𝑃𝐴𝐶𝐼𝐹𝑡+ ℯ𝑖𝑡 (2.3)
As in the original Sharpe model (1992), RNAV is given by:
𝑅𝑁𝐴𝑉𝑡= ln (𝑁𝐴𝑉𝑡 𝑁𝐴𝑉 𝑡−1
24
NAVs are expressed in euros. Yet, a significant part of funds presented on the database are not domiciled in the euro area8. Thus, in order to understand the currency impact, we also calculated the returns in local currencies (RNAVL).
While in the original Sharpe model (1992) the independent variables represent different asset classes, in our model the independent variables represent stock market benchmark indices of different geographic regions9. The selection of these variables is
expected to follow the attributes presented by Sharpe (1992): exclusive; exhaustive and not correlated. Due to the exclusivity attribute, and considering that we intend to analyze the euro area, we select factors that clearly separate assets based in the euro area and those in European countries that do not belong to the euro area. As referred to by Agudo and Gimeno (2005), two assets cannot belong to different factors at the same time.
In our specification model in (2.3) we use four factors. The first factor selected is a benchmark of the euro area (EMU). The second factor is a benchmark of the other European markets that do not belong to the euro area (Europe exEMU).
To evaluate the exposure to markets outside Europe, we consider two geographic factors based on a preliminary analysis of the sample funds domiciled therein. These include the US and Canada (USCA), representing almost 12% of funds in the database, and Japan and Australia (PACIF) with almost 3%.
The benchmark factors are proxies of the correspondent region or country stock market returns and were selected based on the previous literature. We use MSCI indices as in, e.g., Carrieri et al. (2007), Hau (2011) and Boubakri and Guillaumin (2011). For the euro area, we selected MSCI EMU; for other European stock markets excluding equities based in the euro area, we selected MSCI Europe ex-EMU; for the US and Canada, we selected MSCI North America; and, for Japan and Australia, we selected MSCI Pacific.
To assess the robustness of our results, we test some variants of the base model. Since the major impact of a common currency area is the elimination of currency risk, we
8 Circa 25% of the funds in our sample were not domiciled in the euro area. The US dollar is the second
most important currency with 7% of the total funds in the sample.
9 A first attempt of rearranging the Sharpe model to understand the geographic exposures has already been
25
consider an alternative specification with a control variable given by the changes in the effective foreign exchange rate of the euro. This exchange rate is calculated by the European Central Bank (2013), accounting for the relative weight of the euro area commercial partners and the respective bilateral exchange rate. We include the exchange rate of euro as control variable, without imposing any limitation on the estimated procedure as we have done for the other factors, allowing us to extract the effect of the exchange rate that could influence the exposure to non-euro benchmarks in the base model.
𝑅𝑁𝐴𝑉𝑖𝑡 = 𝛽𝑖1𝐸𝑀𝑈𝑡+ 𝛽𝑖2𝐸𝑈𝑅𝑂𝑃𝐸𝑋𝐸𝑀𝑈𝑡+ 𝛽𝑖3𝑈𝑆𝐶𝐴𝑡+ 𝛽𝑖4𝑃𝐴𝐶𝐼𝐹𝑡 +𝛽𝑖5𝐹𝑋_𝐸𝑢𝑟𝑜𝑡+ ℯ𝑖𝑡 (2.5)
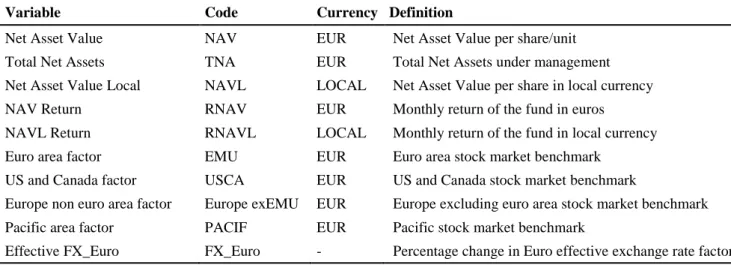
Table 2.2 defines the variables used in the empirical tests. Variable Code Currency Definition
Net Asset Value NAV EUR Net Asset Value per share/unit
Total Net Assets TNA EUR Total Net Assets under management
Net Asset Value Local NAVL LOCAL Net Asset Value per share in local currency
NAV Return RNAV EUR Monthly return of the fund in euros
NAVL Return RNAVL LOCAL Monthly return of the fund in local currency
Euro area factor EMU EUR Euro area stock market benchmark
US and Canada factor USCA EUR US and Canada stock market benchmark
Europe non euro area factor Europe exEMU EUR Europe excluding euro area stock market benchmark
Pacific area factor PACIF EUR Pacific stock market benchmark
Effective FX_Euro FX_Euro - Percentage change in Euro effective exchange rate factor
26
As described in Section 2.2.2, Sharpe’s model (1992) uses quadratic optimization as estimation method. Yet, this methodology does not enable to test statistical inference. So, in order to reinforce the robustness of our results, we also use other estimation procedures to determine the exposures of fund NAV returns to the returns of a set benchmark asset classes. Given that the Quadratic Optimization (QO) is equivalent to Ordinary Least Squares (OLS) estimation10 with constrained parameters, we estimate the parameters in this way.
For that, we impose two constraints. The first is a no leverage constraint, which allows us to closely approximate the return of the fund to a portfolio that reflects similar weights in terms of geographical exposure. The second is a no short sales constraint.
Despite equivalent results, as Sharpe’s model (1992) uses quadratic optimization, we decided to present both results.
2.3 Preliminary Results
2.3.1 Summary Statistics
Table 2.3 shows the summary statistics for the NAV returns measured in euros (RNAV) on a cross section perspective, Table 2.4 shows the summary statistics for NAV returns in local currency (RNAVL) and Table 2.5 shows the summary statistics for the NAV returns measured in euros (RNAV) on a times series perspective.
Recovering the discrepancies across countries in terms of the number of funds, size and value of assets under management referred to in Section 2.2.1, Table 2.3, we find that the RNAV also varies widely across countries, but for the countries in the euro area with the highest number of funds domiciled, we find similarities. France, Germany, Spain, and Belgium show an average RNAV of around 0.03%. In contrast, we find the average RNAV for funds domiciled outside Europe, the USA, Canada, Korea, and Japan showing an average negative return. These findings are strengthened when we compose those statistics for funds domiciled inside and outside the euro area.