shaping of bacterial
communities and
functional gene
diversity in the
extreme
Transantarctic
Mountains
Joana Séneca Cardoso da Silva
Dissertação de Mestrado apresentada àFaculdade de Ciências da Universidade do Porto em Biodiversidade, Genética e Evolução
2013/2014
Orientadora
Catarina Maria Pinto Mora Pinto de Magalhães
PhD, Investigadora no Centro Interdisciplinar de Investigação Marinha e Ambiental (CIIMAR)
Co-orientador
Stephen Craig CaryTodas as correções determinadas pelo júri, e só essas, foram efetuadas. O Presidente do Júri,
O presente trabalho foi desenvolvido no Centro Interdisciplinar de Investigação Marinha e Ambiental (CIIMAR), sob a orientação científica da Doutora Catarina Maria Pinto Mora Pinto de Magalhães e do Doutor Stephen C. Cary
Dissertation for applying to a Master’s degree in Biodiversity, Genetics and Evolution, submitted to the Faculty of Sciences of the University of Porto.
The present work was developed at the Interdisciplinary Center for Marine and Environmental Research (CIIMAR)
under the scientific supervision of Doutora Catarina Maria Pinto Mora Pinto de Magalhães and Doctor Stephen C. Cary.
“Somewhere, something incredible is waiting to be known”
Agradecimentos
Antes de mais,
Um grande obrigada à minha orientadora, Doutora Catarina Magalhães, pelo constante apoio, disponibilidade e entusiasmo com que me recebeu e orientou ao longo deste ano. Um agradecimento também ao Prof. Dr. Anthony Danko por ter tão amavelmente disponibilizado os equipamentos necessários, na FEUP.
Aos meus colegas EcoBioTec, em particular ao Hugo Ribeiro pelos ensinamentos iniciais e momentos de companheirismo (e por me tirar as amostras dos mais variados equipamentos, durante o seu turno da noite). À imprescindível Maria Monteiro que aturou e partilhou as minhas frustrações, sem nunca abrir mão. À Paula Salgado, pela boa disposição constante e apoio, profissional e pessoalmente. À Ana Paula Mucha e à Sandra Ramos pela ajuda e conhecimento nas tarefas laboratoriais do dia-a-dia. Aos meus colegas de mestrado neste laboratório Joana, Marisa e Nuno, pelo apoio e momentos de convívo.
À turma MBGE 2012/2013 por todos os momentos, trocas de opinião, esclarecimento de pequenas dúvidas aparentemente óbvias e ridículas, e apoio mútuo, que foram absolutamente imprescindívels para a conclusão deste trabalho. Um particular obrigado à Marina por ter sido a minha dupla na maioria dos relatórios, por compreender o dilema do computador lento, e por ter estado sempre disponível para debater dúvidas existenciais. Yes, we made it!
A todos os meus amigos e colegas que directa ou indirectamente, estando longe ou perto, me ajudaram ao longo deste ano.
Ao César por estar sempre, sempre disposto a ouvir-me.
Um grande obrigada também dedicado à minha família pelo apoio incondicional. Em particular à minha mãe, por ser (e ter sido sempre) o meu principal ponto de apoio.
Agradeço também à Fundação Portuguesa de Tecnologia (FCT) pelo financiamento do projecto NITROEXTREM (PTDC/MAR/112723/2009– FCOMP-01-0124-FEDER-015422), à equipa NZTABS/ICTAR, e ao Programa Polar Português.
Resumo
As regiões livres de gelo na Antártida representam apenas 0.3 % de toda a área do continente, e estão distribuídas de forma heterogénea. As extremas condições ambientais existentes nestas localizações moldaram ecossistemas caracterizados por uma estrutura trófica simples, nos quais os microrganismos são dominantes e enfrentam severas condições, como uma baixíssima disponibilidade de água e nutrientes, temperaturas baixas, ciclos de congelamento/descongelamento, longos períodos de escuridão no Inverno, e exposição a altos níveis de radiação ultravioleta no Verão. Nestes ecossistemas extremos, a diversidade microbiana geral e funcional permanece largamente desconhecida.
Este estudo faz parte de um programa multidisciplinar liderado pela Nova Zelândia (NZTABS), cujo foco primário é a caracterização da diversidade microbiana nos vales secos da Antártica. Na expedição K020 ao Vale Vitória em Janeiro de 2013 amostrou-se uma área correspondente a 300 km2. Foram recolhidas amostras de solo, e as condições ambientais
de cada ponto de amostragem (total 86) foram registadas in situ (metadata). As comunidades microbianas destes locais foram também caracterizadas ao nível da actividade, abundância e diversidade, através da medição dos níveis de ATP, através da coloração por DAPI, e também pelo método de análise da região intergénica bacteriana 16S-23S DNA (ARISA). Relações entre os parâmetros ambientais e biológicos recolhidos nas 86 estações de amostragem revelaram que a diversidade, abundância e actividade das comunidades microbianas do Vale Vitória estão sujeitas a uma forte estruturação espacial, resultante da heterogeneidade dos parâmetros físico-químicos que caracterizam estes ambientes. De entre as variáveis ambientais analisadas, e de acordo com estudos prévios nestas áreas, a disponibilidade de água foi identificada como um dos principais factores limitantes à distribuição das comunidades microbianas.
De modo a compreender com maior detalhe de que forma a disponibilidade de água afecta as comunidades microbianas nestes ambientes extremos, foram realizadas amostragens ao longo de um transecto com um gradiente de disponibilidade de água no Vale Vitoria. Dos seis pontos do transecto foi extraído DNA e o gene 16S rRNA foi pirosequenciado usando a tecnologia da Roche (454). Métricas de diversidade (alfa e beta) foram produzidas para cada ponto de amostragem e contrastadas com os parâmetros ambientais recolhidos nos locais. Os resultados revelaram uma clara mudança nas comunidades microbianas existentes, nomeadamente uma substituição notória entre os filos Proteobacteria e Actinobacteria, à medida que os solos iam ficando mais secos. Adicionalmente, o local com maior número de OTUs correspondeu à frequência máxima de membros do filo Bacteroidetes
e também ao local com maiores percentagens de carbono orgânico e conductividade. Membros do filo Cianobacteria diminuíram a sua frequência à medida que os solos se tornaram mais secos, o que possivelmente se reflectiu na redução da frequência de outros grupos taxonómicos, visto que as Cianobactérias são reconhecidas como principais fontes de azoto fixado nestes ecossistemas, e a existência e bio-disponibilidade deste elemento tem sido apontada como um factor preponderante na abundância de microrganismos.
Em paralelo, este estudo também teve como objectivo avaliar a distribuição e afinidades filogenéticas de um grupo de microorganismos em particular, com um papel relevante no ciclo do azoto. Partindo do facto do Vale Vitória ter sido recentemente amostrado, a existência de bactérias (AOB) e arqueias (AOA) oxidadoras de amoníaco foi avaliada numa vasta gama de ecossistemas terrestres da Antártida, baseado em técnicas tradicionais de análise de DNA (extracção, amplificação, clonagem, sequenciação). Os locais amostrados foram os vales Miers, Beacon, Upper Wright, Battleship Promontory, e a região do glaciar Darwin-Hatherton, perto das Montanhas Darwin. O gene funcional amoA que codifica a sub-unidade alfa da enzima ammonia-monooxigenase foi o marcador de estudo, e os resultados revelaram uma baixa diversidade genética, com apenas 6 e 5 OTUs identificadas para AOB e AOA respectivamente com o clustering cut-off mais alto, e apenas 2 e 3 OTUs identificadas com o clustering cut-off mais baixo. As OTUs de AOA estão afiliadas com o grupo terrestre 1.1b, ao passo que as OTUs de AOB se encontram separadas em dois grupos, estando um afiliado com o género Nitrosomonas, e o com o género Nitrosospira. Tanto para AOA como para AOB parece existir uma OTU cosmopolita, que é mais abundante e tem afiliações com clones ambientais provenientes de uma vasta gama de ecossistemas. Os nossos resultados demonstram uma distribuição dispersa de AOA e AOB ao longo das Montanhas Transantárticas e reforçam o potencial dos processos de nitrificação em regular a funcionalidade microbiana nestes ambientes extremos.
Palavras-chave: Antártida, Vales Secos, Diversidade microbiana, Diversidade funcional,16s rRNA, amoA, nitrificação, tecnologias de nova sequenciação.
Abstract
Ice free regions in Antarctica account for approximately 0.3% of the continental area and are patchily distributed. The extreme environmental conditions of these soil ecosystems have shaped a low diversity and simple trophic structure in which microorganisms face severe conditions including low water and nutrient availability, cold temperatures, freeze-thaw cycles, long periods of darkness in winter, and exposure to high levels of ultraviolet radiation in summer. In these areas, the diversity of microorganisms involved in key biogeochemical processes such as the nitrogen cycle is still largely unknown.
This study is integrated in a multidisciplinary research team based in New Zealand (NZTABS) that focuses primarily on the microbial diversity of the Antarctic Dry Valleys. Given this, the K020 expedition to Victoria Valley in January 2013 sampled an area of approximately 300 km2. Soil samples were collected, along with the corresponding
metadata and subjected to automated ribosomal intergenic spacer analysis (ARISA), to characterize the abundance and richness of the existing microbial communities in the whole valley. Relationships between environmental and microbial data from a total of 86 stations revealed that diversity, abundance and activity of the Victoria Valley’s bacterial communities are subjected to strong spatial structuring due to the extreme heterogeneity in soil geochemical properties, being water availability identified as a main environmental constrain.
In order to understand how water availability in these environments may affect bacterial diversity and phylogeny, soils from a transect with increasing distance from a water source were also sampled and the 16S rRNA gene was amplified and sequenced using Roche’s 454 pyrosequencing technology. Alpha and beta diversity metrics were computed and compared with measures of environmental variables which were also collected on site. Results revealed a clear shift in the microbial communities across the transect with a water availability gradient, namely a notorious replacement of members of the Proteobacteria phyla by members of the Actinobacteria phyla, as the soils became drier. Additionally, the sampling point with most unknown OTUs corresponded to the place with the highest values of conductivity and organic carbon production, along with the highest frequencies of members of phylum Bacteroidetes. Also, members of the Cyanobacteria phyla decreased their frequencies as the soils became drier, which likely caused a decrease in the frequencies of occurrence of other taxonomic groups, given the fact that Cyanobacteria are known to be the major nitrogen fixators in the Dry Valleys
and the bio-availability of this chemical element has proved to influence the abundance of other microorganisms.
In parallel, this study also aimed to assess the distribution and phylogenetic affinities of a particular group of microorganisms with a prominent role in the nitrogen cycle. Taking advantage of the recently sampled Victoria Valley, the existence of ammonia-oxidizing bacteria (AOB) and archaea (AOA) was assessed in a high range of Antarctic soil environments, based on standard DNA molecular approaches (extraction, amplification, cloning and sequencing). We established relationships between the broad scale environmental gradients of the sampled locations and the relative diversity of ammonia oxidizing microbial communities. In addition to Victoria Valley, the Miers Valley, Beacon Valley, Upper Wright Valley, Battleship Promontory, and the Darwin-Hatherton Glacier region of the Darwin Mountains were the chosen sampling sites, from which DNA was extracted, amplified, cloned and sequenced.
The gene coding for ammonia-monooxygenase (amoA) was the functional marker chosen and results revealed generally low AOB and AOA amoA gene diversity, with only 6 and 5 identified OTUs with the highest clustering cut-off, and, and 2 and 3 OTUs respectively with the lowest clustering cut-off. AOA OTUs were affiliated with the soil group 1.1b, along with culturable representatives of the genus Nitrososphaera. AOB OTUs were separated into two clusters, one affiliated with the genus Nitrosomonas, and another one affiliated with the genus Nitrosospira. In both groups of microorganisms there seems to exist a cosmopolitan OTU, which is the most abundant and has close affiliations with environmental clones from a wide range of environments. The observations reported in this study demonstrating a highly dispersed distribution of AOA and AOB within the Transantarctic Mountains reinforce the potential of nitrification processes in driving microbial functionality of these extreme ecosystems.
Key words: Antarctica, Dry Valleys, Microbial diversity, Functional diversity, 16S rRNA, amoA, nitrification, next-generation sequencing technologies.
Table of contents
Agradecimentos
i
Resumo
iii
Abstract
v
Table of contents
vii
List of papers
xi
List of figures
xii
List of tables
xiv
List of abbreviations
xv
Introductory Review
1
1. Environmental Microbiology 1
2. Soil Microbiology 3
3. Methods to assess soil microbial diversity 4 4. Microbial life at the extremes 8
4.1 Cold adapted organisms 8
4.2 Antarctica 9
4.3 Ice-free areas in continental Antarctica 11
4.4 The McMurdo Dry Valleys: the coldest and driest deserts on Earth 12 4.5 Microbial diversity studies in the Dry Valleys 13
Chapter 1: The influence of water availability in bacterial community structure:
Victoria Valley as a case study
16
I.
Background
16
1.Victoria Valley: a geologic perspective 16
II.
Goals
18
III.
Material and Methods
19
1.Sampling 19 2.Physico-chemical parameters 20 3.Biological parameters 20 4.DNA extraction 21 5.ARISA analysis 22 6.NGS analysis 23
6.1. DNA quality control 23
6.2. Pyrosequencing methodology 23 6.3 Bioinformatic analysis 24 6.3.1. Alpha-diversity metrics 25 6.3.2. Beta-diversity metrics 25 7.Alternative pipelines 25 7.1.SILVA NGS 26 7.2.Metabiodiverse 26
IV.
Results
28
1.Biological and geochemical attributes of Victoria Valley 28
2.Transect 30
2.1 Geochemical characterization 30
2.2 Bioinformatic analysis 31
2.2.1. Alpha diversity analysis 33
2.2.2 Beta-diversity analysis 35
2.4 Detailed Bacterial taxonomic analysis 36
V.
Discussion
39
1. Environmental characterization vs microbial communities in Victoria Valley 39 2. Water availability vs bacterial diversity 41 3. NGS bioinformatic analysis 44
VI.
Conclusions
48
Chapter 2. Diversity of ammonia-oxidizing microorganisms in the
Transantarctic Mountains
50
I.
Background
50
1.Nitrogen cycle 50
2.Diversity of ammonia-oxidizing microorganisms 52 3.Nitrogen biogeochemistry in the Transantarctic Mountains 54
II.
Goals
56
III.
Material and methods
57
1.Sample collection and site description 57
2.DNA extraction 58
3.PCR amplification of Archaeal and Bacterial amoA gene 60 4.Cloning and RFLP profiling 60 5.Phylogenetic and statistical analysis 61
IV.
Results
62
1.Archaeal amoA 62
2.Bacterial amoA 67
V.
Discussion
71
VII.
Conclusions
77
References
79
Supplementary information
96
Appendix 1. General QIIME workflow 96 Appendix 2. Class- based taxonomy on QIIME 97 Appendix 3. Order-based taxonomy on QIIME 101 Appendix 4. Family-based taxonomy on QIIME 107 Appendix 5. Genera-based taxonomy on QIIME 116 Appendix 6. Metabiodiverse Taxonomy Results 128 Appendix 7. SILVAngs Taxonomy Results 130
List of papers
The elaboration of this dissertation benefited from the following submitted scientific publications and additional conference presentations with a relevant contribution:
1) Monteiro, M., Séneca, J., Magalhães., C.: The history of aerobic ammonia oxidizers: from the first discoveries to today. Journal of Microbiology 2014, 52 (7), pp. 537-547
2) Magalhães, M., Machado, A. Monteiro, M. Séneca, J., Charles, L., Cary, C.S.: Environmental constraints on the distribution of key nitrogen genes in the extreme Transantarctic Mountains. Submitted to Frontiers in Microbiology
3) J. Séneca, M. Monteiro, H. Ribeiro, L. Charles, S. C. Cary and C. Magalhães: "Phylogenetic diversity of ammonia-oxidizing microorganisms in the extreme Transantarctic Mountains" - 6ª Conferência Portuguesa de Ciências Polares - October 31st 2014 Porto, Portugal. (Oral)
4) J. Séneca, M. Monteiro, H. Ribeiro, L. Charles, S. C. Cary and C. Magalhães:"Antarctic Dry Valleys: geochemical soil properties and microbial communities" - IJUP 2014 (Seventh Meeting of Junior Researchers of the University of Porto) - February 12th
2014, Porto Portugal. (Oral)
5) J. Séneca: "Diversity and abundance of Bacteria vs Archaea nitrifiers in the extreme Dry Valleys of the Transantarctic Mountains" - IV Workshop APECS Portugal - How
To Be a Polar Scientist for Dummies. October, 31th 2013. Anfiteatro Verde, Faculdade
de Ciências e Tecnologia, Piso 1, Edifício 8, Faro. (Oral)
6) J. Séneca, M. Monteiro, H. Ribeiro, L. Charles, S. C. Cary and C. Magalhães "NITROEXTREM: 2013 Antarctic Field Campaign to the Dry Valleys" - 5ª Conferência
List of figures
Figure 1. Maximum likelihood phylogenetic inference of the Bacteria and Archaea domains.
... 1
Figure 2. Schematic representation of a general workflow to assess microbial diversity in soils. ... 5
Figure 3. Ice-free regions in the Antarctic continent. ... 11
Figure 4. Phylogenetic diversity of bacterial 16S rRNA gene in different ecosystems. 13 Figure 5. Location of the Victoria Valley System, Antarctica, showing the site of the bench-like features in the eastern Victoria Valley. ... 17
Figure 6. Location of the 86 sampling sites from which soil samples were collected in the K020 Antarctic field campaign. ... 19
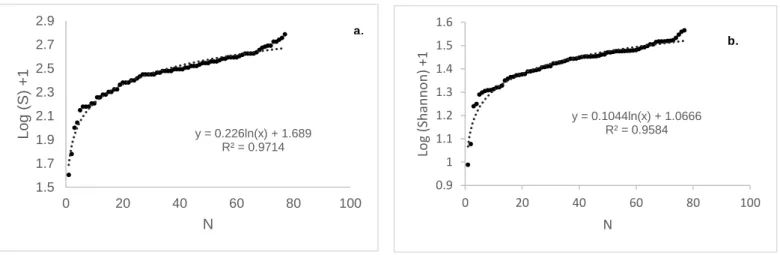
Figure 7. Graphical representations of species richness S and species diversity H’. .. 28
Figure 8. Spatial representation of water activity, conductivity and pH across the 86 sampling sites of Victoria Valley. ... 29
Figure 9. Variation of soil characteristics across the transect. ... 30
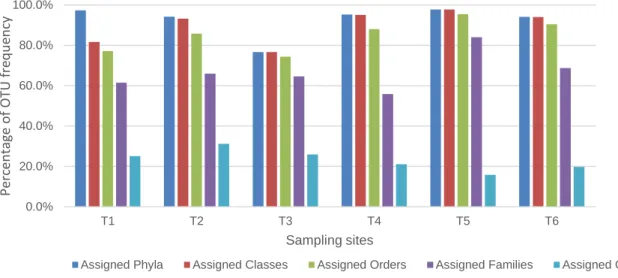
Figure 10. Graphical comparison of OTU attributions per sampling site, per pipeline. 32 Figure 11. Percentage of OTU assignments per taxonomic group using QIIME. ... 32
Figure 12. Rarefaction curves for different alpha diversity metrics for each sampling site. ... 33
Figure 13. Jackknifed PCoA plot using the unweighted UniFrac distance metric. ... 35
Figure 14. Unweighted UniFrac UPGMA tree. ... 36
Figure 15. Relative abundance of phyla-affiliated OTUs per sampling point. ... 37
Figure 17. Key processes of nitrification by both Archaea (AOA) and Bacteria (AOB) 52 Figure 18. Map of Antarctica, emphasizing ice-free regions. ... 57
Figure 19. Number of retrieved archaeal OTUs with different clustering cut-offs, per location. ... 61
Figure 20. Unrooted amoA-based phylogenetic tree of ammonia-oxidizing Archaea with a 95% clustering cut-off. ... 64
Figure 21.Unrooted amoA-based phylogenetic tree of ammonia-oxidizing Archaea with an 85% clustering cut-off. ... 65 Figure 22. Number of retrieved bacterial OTUs with different clustering cut-offs, per location. ... 66
Figure 23. Unrooted amoA-based phylogenetic tree of ammonia-oxidizing Bacteria with a 96% clustering cut-off. ... 68
Figure 24.Unrooted amoA-based phylogenetic tree of ammonia-oxidizing Bacteria with a 80% clustering cut-off. ... 69
List of tables
Table 1: Descriptive statistics for both biological and environmental variables collected in Victoria Valley (N=77). . ... 29
Table 2: Correlation matrix. ... 30
Table 3: Number of available sequences after initial quality filtering, per sample, per pipeline. ... 31 Table 4: Number of unique OTUs per sampling site, per pipeline, after clustering ... 31
List of abbreviations
®
16S rRNA /SSU rRNA AMO amoA AOA AOB ARISA ATP Aw BLAST bp CTAB DAPI DDBJ DGGE DNA dNTP’s e.g. EMP ENA FU GG H’ HAO/hao IC ICTAR ITS mM M.y. N NCBI NGS Registered trademark
16S ribosomal RNA / Small subunit of ribosomal RNA Ammonia monooxygenase
Gene coding for the αsub-unit of the ammonia-monooxygenase Ammonia-oxidizing Archaea
Ammonia-oxidizing Bacteria
automated approach for ribosomal intergenic spacer analysis adenosine triphosphate
Water activity
Basic Local Alignment Tool base pair(s)
bromide-polyvinylprrolidone-b-mercaptoethanol 4',6-diamidino-2-phenylindole
DNA Databank of Japan
Denaturing gradient gel electrophoresis Deoxyribonucleic acid
Deoxynucleotide Triphosphates
exempli gratia
Earth Microbiome Project European Nucleotide Archive Fluorescence Units
GreenGenes
Shannon-Wiener diversity index Hydroxilamine oxidoreductase Inorganic Carbon
International Centre of Terrestrial Antarctic Research Internal Transcribed Spacer
Milimolar Million year Nitrogen
National Center for Biotechnology Information Next Generation Sequencing
nifH NJ NZTABS ºC OC ºE ºN ºS OSD OTU ºW PAR PcoA PCR RDP RNA rpoB S TC TM T-RFLP UPGMA USA UV v. vs WGS84 μL RLU µS
Gene coding for nitrogenase Neighbour-Joining
New Zealand Terrestrial Antarctic Biocomplexity Survey Celsius degrees
Organic Carbon Degrees East Degrees North Degrees South Ocean Sampling Day Operational Taxonomic Unit Degrees West
Photosynthetically active radiation Principal Coordinate Analysis Polymerase Chain Reaction Ribosomal Database Project Ribonucleic acid
Gene coding for the β-subunit of RNA polymerase Species Richness
Total Carbon Trademark
Terminal Restriction Length Fragment Polymorphism Unweighted Pair Group Method with Arithmetic Mean United States of America
Ultra-violet radiation Version
versus
World Geodetic System 1984 Microliter
Relative Light Unit Microsiemens
Introductory Review
1. Environmental Microbiology
Microorganisms are recognized as the most ubiquitous and widespread living group on Earth, inhabiting all ecosystems of our planet. They are known to play a major role on Earth’s biogeochemical cycles, plant nutrition, symbiotic relationships and primary production. Multiple studies have come to the conclusion that the majority of known microorganisms cannot be cultured by standard techniques, and that this uncultured fraction (approximately 99%) included diverse organisms, distantly related to the cultured ones (Torsvik et al. 1990; Riesenfeld et al. 2004). Hence, the existing pure cultures are not representative of the existing biodiversity, and even though there has been a boost in the application of culture independent
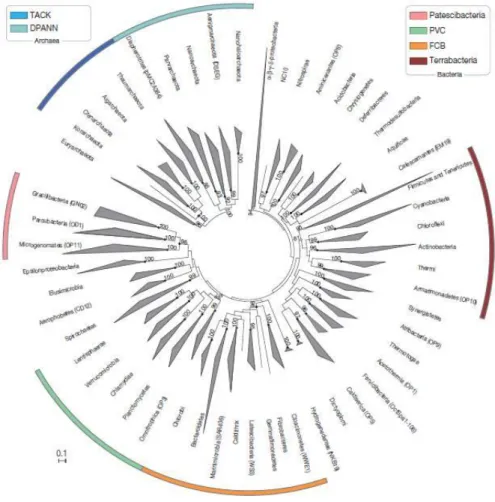
Figure 1. Maximum likelihood phylogenetic inference of the Bacteria and Archaea domains. This tree is based on up to 38 marker genes and collapsed at the phylum level. Superphyla (TACK, DPANN, FCB, PVC, Terrabacteria, and Patescibacteria) are highlighted with color ranges. Adapted from Rinke et al. (2013)
methods to the field of environmental microbiology, a high percentage of the genetic diversity, community composition, relative abundance, and distribution of microorganisms remain under sampled, and uncharacterized (Handelsman 2004; Riesenfeld et al. 2004; Sogin et al. 2006). Naturally, culture independent studies boosted after the discovery of the DNA structure (Watson & Crick 1953), the genetic code (Nirenberg et al. 1966) and the quick development of pioneering sequencing techniques (Sanger & Coulson 1975; Sanger et al. 1977). By focusing on natural communities, the studies of Pace and colleagues represented a turning point in the way we see the microbial world (Olsen et al. 1986; Pace 1997). Not only there was an acknowledgement that the main diversity of life was microbial, but Pace and colleagues managed to distribute microbial diversity into three primary domains (Archaea, Bacteria and Eukarya), based in the extraordinary works of Woese and colleagues regarding the potential of the 16S rRNA gene to encode evolutionary signatures (Woese & Fox 1977; Woese et al. 1990; Pace 1997).
Regarding prokaryotes, recent studies have shown that there are at least 50 bacterial phyla, and half of them are composed entirely of uncultured bacteria (Schloss & Handelsman 2004). The same situation applies to Archaea, with five recognized phyla and large amounts of unclassified environmental sequences (Gribaldo & Brochier 2009; Brochier-Armanet et al. 2011) (Fig. 1). Hence, the quest for the prokaryotic tree of life is still running and represents a fundamental question in microbiology (Gribaldo & Brochier 2009). The tree of life allows a clearer understanding of the deepest events in the history of Life on Earth by pointing out the evolution of microbial diversity over geological time, and with this, the emergence of important metabolic capacities which shaped early ecosystems (Delsuc et al. 2005; Pace et al. 2012).
Consequently, the reconstruction of the prokaryotic tree of life enables the unfolding of the evolutionary history of particular cellular processes (metabolic pathways) or systems (macromolecular complexes), by analyzing their components and thus represents an important and promising branch in phylogenomics (Delsuc et al. 2005).
2. Soil Microbiology
The analysis of microbial populations in natural habitats is one of the cornerstones of current research regarding the functioning of natural ecosystems, and soils represent no exception. The high variability of the soil’s physicochemical properties, namely age, depth, mineral and organic elements, enables it to harbor most of the still uncharacterized microbial diversity (Torsvik & Øvreås 2002; Mocali & Benedetti 2010; Fierer et al. 2012; Janssen & Prosser 2013). Additionally, there are no straight relationships between soil’s heterogeneity, biochemistry, spatial and temporal variability, and the existing microbial communities, since they are randomly spread, following nutrient gradients, moisture contents and pH (among others), showing a “hot-spot” or patchy distribution that makes representative sampling more difficult (Nunan et al. 2002). Also, the complexity of the existing microbial communities and their biotic and abiotic interactions is not fully understood, and varies among ecosystems (Leininger et al. 2006; Jia & Conrad 2009; Magalhães et al. 2009; Daebeler et al. 2012; Ladau et al. 2013).
The prokaryotic community in soils, like in any other environment, is composed of two domains - Eubacteria and Archaea – which present different abundance and diversity levels, depending on local soil characteristics (Torsvik et al. 1990; Torsvik & Øvreås 2002). Because of this, it is not possible to precisely point out one prominent ubiquitous taxon common to every soil on Earth.
Prokaryotes in soils are also responsible for mediating important pathways in most of the Earth’s major biogeochemical cycles such as the nitrogen (Nicol & Schleper 2006; Hayatsu et al. 2008), carbon (Baker et al. 2013), and the sulfur and phosphorus cycles (Falkowski et al. 2008). In addition, they are also responsible for maintaining soil aggregation (Chotte 2005). Moreover, most soil microorganisms in bulk soil are in a dormant state, but readily burst into activity when water or easily decomposable substrates become available, which is followed by a succession of microfaunal predators such as protozoa, promoting an interplay between rates of nutrient cycling and a strong enhancement on the availability of mineral nutrients to plants (Scheu et al. 2005).
Similarly to other environments, culture-dependent methods presented a major drawback in the estimation of microbial diversity and abundance, a phenomenon known as the Great Plate Count Anomaly (Hugenholtz 2002). Hence, and with advances in molecular techniques, microbiologists realized that the “snapshot” produced by the application of culture-independent methods provided a much more realistic framework of the molecular make-up of
whole complex soil communities, as well of specific microorganisms and genes therein (van Elsas & Boersma 2011)
3. Methods to assess soil microbial diversity
Microbial diversity describes complexity and variability at different levels of biological organization. It encompasses genetic variability within taxa (species), their number (richness), relative abundance (eveness) and functional groups (guilds) in communities (Torsvik & Øvreås 2002). The species concept is a recurrent controversial issue that is common to many biological disciplines. The prokaryotic species concept has been developed in parallel to the design of molecular techniques that allowed the retrieval of more accurate information than the one previously retrieved from morphological and physiological data. However, taxonomists and microbiologists have not reached a consensus relatively to what is considered a prokaryotic species, since traits as different as ways of obtaining energy (heterotrophy vs autotrophy, among others), trophic roles, and different DNA sequence identity clustering thresholds have to be considered (Konstantinidis et al. 2006; Fierer et al. 2007; Schloss & Westcott 2011). Nevertheless, the present working hypothesis for the prokaryotic species concept is that microorganisms belonging to the same species are a cluster of strains which are more related in terms of sequence identity and gene content, among themselves, than to strains outside the cluster (Konstantinidis et al. 2006; Chan et al. 2012; Cordero & Polz 2014). In addition to the species concept, the prokaryotic “ecotype” concept is defined as a strain or a group of strains that show some level of ecological distinctiveness, even though they belong to the same species (Konstantinidis et al. 2006; Rocha 2008).
The vast majority of current molecular analysis from soil is preceded by direct DNA/RNA extractions ( Zuckerkandl & Pauling 1965; Torsvik et al. 1990). Key issues regarding this method are that it is highly reproducible and provides easy access to genes of extant soil microbial communities. However, the chemical integrity and purity of soil DNA can bias and/or limit further downstream analysis such as polymerase chain reaction (PCR).
A major step forwards regarding the study of soil microbiota via DNA (and/or RNA) has been the development of direct PCR amplification of target genes, such as the 16S rRNA (Wilson et al. 1990) and rpoB (Dahllöf et al. 2000) genes, and functional gene markers such as amoA and nifH (Rotthauwe et al. 1997; Jung et al. 2011). Despite being the molecular technique of choice, PCR amplification of soil DNA can be hampered by soil intrinsic enzymatic inhibitors. In addition, the perceived diversity is prone to differential amplification,
so called “rare biosphere” (van Elsas & Boersma 2011). This can be overcome by using group specific primers that target low-abundance microorganisms. Combined with nested or semi-nested techniques, this approach helps to provide greater insights regarding the ecology of the target groups, as they reduce the complexity of the target community (van Elsas & Boersma 2011; Burke et al. 2011)
When working with environmental samples, community fingerprinting techniques such as denaturing gradient gel elecrectrophoresis (DGGE), terminal restriction fragment length polymorphism (T-RFLP), and automated approach for ribosomal intergenic spacer analysis (ARISA) work as a proxy for bacterial community composition and are useful in order to have a preliminary idea of microbial sample composition (Smalla et al. 2007). DGGE is a technique that was implemented in the early nineties, and is based on the mobility of nucleic acids in a denaturing gel of acrylamide. It relies on the profiles of double stranded PCR products (Muyzer et al. 1993). Hence, sequences are separated according to their GC % (Muyzer et al. 1993). T-RFLP (Liu & Marsh 1997) and ARISA (Fisher & Triplett 1999) are community fingerprinting techniques based on the PCR amplification of target genes using fluorescently labeled primers. The resulting output is an electropherogram showing a series of peaks relating fragment length with fluorescence intensity (which reflect the abundance of certain taxa), and
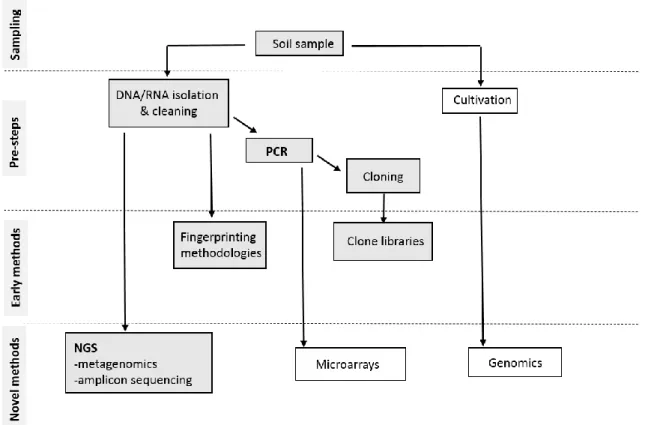
Figure 2. Schematic representation of a general workflow to assess microbial diversity in soils. Grey boxes represent steps used in this project. Modified from Elsas and Boersma (2011).
from them, with the appropriate statistical tools, several diversity indexes can be calculated (Boon et al. 2002; Culman et al. 2009).
The rRNA genes have, since the end of the 70’s, become the molecular marker of choice, when it comes to infer phylogenetic relationships at different levels, among different taxonomic levels (Zuckerkandl & Pauling 1965; Ward et al. 1990; Weisburg et al. 1991). They are greatly involved in the protein-synthetizing process within the cell, and tend to show a high level of conservation among all organisms, regarding structure, functionality, and nucleotide sequence. In addition, there is no evidence of horizontal gene transfer between contemporaneous organisms, and therefore, relationships between rRNAs reflect evolutionary relationships between the organisms (Olsen et al. 1986). Regarding prokaryotes, the 5S rRNA and the 16S rRNA genes have been used to assess diversity at different levels (Olsen et al. 1986; Riesenfeld et al. 2004). However, given the fact that the 16S rRNA gene sequence is longer, this marker is preferable over the 5S rRNA gene when it comes to inferring phylogenetic relationships, especially with the development of DNA cloning/sequencing techniques that enable the use of the total 16S gene sequence, instead of partial sequences (Olsen et al. 1986). Nevertheless, it has some pitfalls and among them is the fact that it exists in more than one copy in certain microbial taxa, which leads to an overestimation of the existing microorganisms (Vos et al. 2012; Poretsky et al. 2014). Therefore, 16S RNA-based community analysis should be carefully performed and the use of single copy genes such as
rpoB should be used instead or as a complementary tool (Farrelly 1995; Dahllöf et al. 2000;
Case et al. 2007). This approach, however, is still limited since the amount of 16S RNA gene sequences in public repositories is huge, when compared with any other gene (Maidak et al. 1996; Cole & Tiedje 2014).
Regardless of the potential of the 16S rRNA gene, its use as a standalone fingerprint tool has been progressively replaced (Riesenfeld et al. 2004). The use of high throughput shotgun sequencing of environmental samples – metagenomics – has enabled the recovery of massive amounts of genetic data present in a given habitat, providing clues regarding the functional capacity of a given community, rather than just its phylogenetic composition. When compared with the use of the 16S rRNA gene, the analysis of full genomes by metagenomic approaches enables researchers to go one step forward towards the understanding of microbial functionality in different ecosystems (Walker et al. 2010; Fierer et al. 2012; Lebedeva et al. 2013). 16S rRNA gene profiling using next-generation sequencing (NGS) techniques is often used as a preliminary step before metagenomic analysis and is useful to determine the
a preferential sequencing technology (Roche 454/Illumina/Ion Torrent), and the amount of sequencing necessary (Klindworth et al. 2013; Poretsky et al. 2014; Mori et al. 2014).
Roche 454 was the first commercially successful next generation system and uses pyrosequencing technology, that is, it relies on the detection of pyrophosphatase released during nucleotide incorporation, instead of using traditional dideoxynucleotides (ddNTPs). DNA with 454-specific adapters is denatured into single strand and captured by amplification beads that precede emulsion PCR (Parameswaran et al. 2007). Then, in a picotiter plate, the dNTPs are sequentially incorporated and different amounts of pyrophosphate are released, resulting from the incorporation of different nucleotides. Visible light is produced, registered, and a pyrogram profile is generated (Liu et al. 2012).
Other sequencing technologies exist, namely Illumina and Ion Torrent that use different sequencing chemistry settings and workflows (Parameswaran et al. 2007; Liu et al. 2012). Additionally, single-cell metagenomics has received considerable attention in recent years, being considered the 2013 method of the year by the Nature Publishing Group (Nature Methods, 2014). This technique makes rare cells more accessible to analysis, provided that methods are available to isolate and/or enrich these cells from their heterogeneous environments, which is still a major challenge.
The use of sequencing technologies is evolving at an unprecedented rate. A decade ago, the sequencing cost of a raw megabase of DNA rounded $1K, and that cost has now decreased more than 10 fold (Segata et al. 2013; Wetterstrand 2014) which has resulted in more and more researchers using metagenomics as a potential answer to their biological questions. However, other areas must also follow up these advances, namely Bioinformatics. As an example, while the amount of data/sequences generated has increased 5000 fold, the computational speed has only increased 10-fold, which results in a high increase in the time needed to analyze full datasets (Stein 2010). Additionally, means to store data (and associated metadata) must also be generated and be of easy access. Large sequence repositories already exist and are expanding, namely ENA (European Nucleotide Archive) (Leinonen et al. 2011), NCBI (National Center for Biotechnology Information) (Geer et al. 2010), and DDBJ (DNA Databank of Japan) (Tateno & Fukami-Kobayashi 1998). These databases are expected to store data from ambitious massive worldwide sampling surveys such as the Earth Microbiome Project (EMP) and the Ocean Sampling Day (OSD) and to conveniently make it available to multidisciplinary teams throughout the globe, in order to produce a global Gene Atlas describing microbial diversity, protein and environmental models for each biome (Gilbert et al. 2014; www.microb3.eu/osd)
In conclusion, the advent of new sequencing methods has proved to enable a paradigm shift in the field of microbial ecology, unravelling crucial information regarding the genetic features and ecosystem role of countless microorganisms in all of the Earth’s microbiomes. The dual realization that there are still so many unknown microorganisms out there and that researchers now have the tools to discover and characterize them represents a turning point in microbiology studies, opening new doors of exciting research.
4. Microbial life at the extremes
4.1 Cold adapted organisms
The term “extreme” is relative and is always compared to what is considered “normal”. An extreme environmental condition is defined as a condition that goes beyond acceptable ranges that have been observed throughout time, in a given region/ecosystem. Extreme environments include high gradients of temperature, pH, nutrient and water availability, levels of radiation, heavy metals, and toxic compounds (Satyanarayana et al. 2005). Organisms that can thrive in these harsh conditions are named “extremophiles” and the majority of them are included in the microbial world (Morita 1975; Schafer 2004)
About 85% of the biosphere is permanently exposed to temperatures below 5 ºC. These habitats extend from the Arctic to the Antarctic and their major fraction is represented by deep sea, snow, permafrost, sea ice and glaciers (Margesin & Miteva 2011).
Psycrophiles are true extremophiles, as they are mostly adapted to low temperatures (have an optimum growth temperature < 15ºC and can grow at or below 0ºC) but are also found in environments with other constrains, as is the case of microorganisms that inhabit deep ocean environments, in which pressure levels are very high (Morita 1975; Feller & Gerday 2003). In order to thrive in such harsh conditions, psychrophilic organisms have to overcome some physiologic problems related with the environment they live in, namely at the cell membrane level. At low temperatures, enzymes become rigid and solute concentrations may increase to toxic levels. Additionally, once the water freezes, ice crystals may pierce the membrane. Hence, psychrophilic membranes contain higher levels of unsaturated lipids, when compared with their mesophilic counterparts, in order to balance membrane fluidity (Feller & Gerday 2003; Rampelotto 2010). Psychrophiles also produce cold-adapted enzymes that are characterized by a lower core hydrophobicity, fewer ionic and electrostatic interactions, a
modification in residue composition (particularly a substitution of proline by glycine, and smaller arginine/lysine ratios), fewer interdomain/subunit interactions and aromatic interactions (Deming 2002; Rampelotto 2010). In addition, anti-freeze proteins have been identified, preventing cell membrane piercing by ice crystals (Feller & Gerday 2003). These factors contribute to a higher thermo stability necessary to withstand the existing low temperatures.
Major biotechnological advances are emerging from the study of physchrophiles, with direct applications at the industrial, health and environmental levels (Rothschild & Mancinelli 2001; Cavicchioli & Siddiqui 2002). Also, regarding the fields of biology and evolution, they provide a great ecological framework to address issues such as the origin of life, and the molecular mechanisms of cold adaptation (Cowan, 1997).
4.2 Antarctica
Antarctica was the last continent to be discovered, and is thought to have been spotted for the first time in 1820 by Nathaniel Palmer, though earlier descriptions that date to Ptolomy (1st century AD) had been made of a southern cold land – Terra Australis. Etymologically, the
word Antarctica comes from the greek “antarktiké”, that means “opposite to the Arctic” and was formally attributed to the continent around 1890 by the Scottish cartographer John George Bartholomew.
It is often viewed as one of the Earth’s last great frontiers; the combination of extreme conditions with periods of complete or near darkness provides inhospitable conditions to the existence of life (Convey et al. 2008). Being the largest reservoir of fresh water on Earth (90%), with an area of 13.6 million km2, a mean elevation of 3000 m above sea level, average winds
of 80 km/h, an annual precipitation of less than 5 cm, and temperature ranges from -40 to -50 ºC, Antarctica is a continent of extremes (Bockheim 1997; Cowan 2014). The existence of such extremes means that the influence of the Antarctic region on both climate and oceans extends not only to its immediate area, but also into mid-latitude global systems. In fact, Antarctica plays a remarkable role in the global environmental system in terms of climate, global heat balance, oceanic circulation and marine nutrient cycling. Spatial and temporal variation in these systems is crucially important not only to human understanding of how the planet currently functions, but also to predict future changes (Doran et al. 2002).
Historically, Antarctica emerged from the disintegration of the Gondwana supercontinent in the Cretaceous (~ 120 M.y. ago) and became fully isolated around ~33.7 M.y., when it separated from South America (Clarke et al. 2005). Understanding the geology of Antarctica is hampered by the lack of rocky outcrops, which are thought to account for less
than 0.3 % of the continental area (Cowan 2014). However, nowadays three regions can easily be distinguished in continental Antarctica: East Antarctica is generally above sea level, with a very thick ice-sheet cover. It has an active volcano – Mount Erebus – and one of the world’s biggest lakes – Lake Vostok – whose waters have been isolated from air and light, under the pressure of the ice-sheet cover, therefore providing a good setting for the discovery of new forms of microbial life, as it has recently been proved (Shtarkman et al. 2013). East Antarctica is a stable, ancient shield of Precambrian metamorphic and igneous rocks, formed mostly between 3800 and 500 M.y ago (Harley 1988). Younger folded sediments of Upper Proterozoic-Lower Palaezoic age are exposed in the fold belts that border the Precambrian metamorphic shield (Talarico & Kleinschmidt 2008). West Antarctica is lower than the East part, comprising areas that are below sea level. It also presents a more heterogeneous topography and is dominated by Mesozoic and Cenozoic rocks. Separating these two parts, there are the Transantarctic Mountains, which are one of the Earth’s major mountains. They reach 4000 meters in height, 100-200 km in width and extend for some 3500 km across the continent, between the Ross and Weddell seas (Cary et al. 2010).
Due to its remoteness and glaciation, Antarctica is one of the Earth’s most pristine environments, and provides essential data for the construction of a global baseline against which to monitor climate-related changes that may affect global processes. Particularly regarding recent climate changes, Antarctica has been pointed as the continent where these changes will be (and already are) first felt (Doran et al. 2002; Talarico & Kleinschmidt 2008) and therefore there is an increasing need to understand the dynamics of Antarctic ecosystems to predict future climate change scenarios and to properly account for their conservation (Seybold et al. 2009; di Prisco et al. 2012).
4.3 Ice-free areas in continental Antarctica
Approximately 99.7% of continental Antarctica is permanently covered by the Antarctic Ice sheet throughout the year and the few remaining areas that are ice-free are patchily distributed across the continent (Fig. 3) (Hopkins et al. 2006). Antarctic terrestrial ecosystems are different from other polar ecosystems (namely the Arctic), in the sense that they are colder, drier, lower in nutrient availability, and often alkaline, since soils accumulate salts from rare precipitation events and weathering, due to extreme aridity (Cary et al. 2010; Margesin & Miteva 2011). These environmental conditions have shaped soil ecosystems of low diversity and simple trophic structure (Pointing et al. 2009; Fierer et al. 2012). With the exception of the Antarctic Peninsula and some sub-Antarctic islands, biodiversity is mostly restricted to invertebrates, protozoa, fungi, Bacteria and Archaea. Hence, Antarctic soil communities are mostly microbial and their structure seems mainly influenced by abiotic factors, due to the few existing biotic interactions (Hogg et al. 2006).
Figure 3. Ice-free regions in the Antarctic continent: Ice-free regions account for approximately 0.3% of the whole continent (Bottos et al. 2014)
4.4 The McMurdo Dry Valleys: the coldest and driest deserts on Earth
The Dry Valleys of Antarctica are a mosaic of glacier, ice-covered lakes, ephemeral streams and arid soils (Wall 2005; Barrett et al. 2006a). They are a series of generally west-to-east oriented, glacially curved valleys located between the Polar Plateau and the Ross Sea, in Southern Victoria Land. They are primarily ice-free because the glacial flow from the East Antarctic Ice Sheet is obstructed by the Transantarctic Mountains. The Dry Valleys are characterized by even steeper environmental gradients than continental Antarctica. They have an average mean temperature that ranges from -15 to -30. Arid soils are, however, subjected to large temperature fluctuations, namely during the austral summer, where temperatures can go up to 0 ºC (and liquid water is potentially available) and largely decrease at the end of the day. Temperature fluctuations of > 20 ºC are not uncommon, leading to multiple freeze-thaw cycles in the same day. In winter, minimum average temperatures range between 40 and -60 ºC (Zeglin et al. 2009; Cary et al. 2010).
Precipitation levels in the Dry Valleys are very low, presenting levels of < 10 cm2/year
and are mostly in the form of snow, which never reaches the soil due to rapid sublimation. This quick evaporation is driven by the very low relative humidity of the katabatic winds that come from the Polar Plateau (Chwedorzewska 2009). Additionally, mineral soils are also very dry, with mass water content below 2%, which is equivalent to the water content of many hot deserts. This effect is synergistically affected by the existing high levels of salinity that are the result of a continued aerosol deposition and very low leaching rates (Niederberger et al. 2008). In addition to the aforementioned constraints, factors such as low organic carbon content (from 0.0 to 0.43%) high incidence of radiation (namely UVB) and photosynthetically active radiation (PAR), absence of soil structure and cohesion, soil age and other geochemical properties also impose strong limitations on the survival, prevalence and distribution of soil biota (Sokol et al. 2013).
The trophic simplicity of these extreme environments provides a particularly good framework to infer relationships not only between intrinsic soil features, but also regarding the role of environmental parameters in shaping the distribution of the microbial communities (Mocali & Benedetti 2010).
4.5 Microbial diversity studies in the Dry Valleys
Early cultivation-based methodologies have successfully isolated and described many bacterial strains in Antarctica
(Darling & Siple 1940; Flint & Stout 1960). However, as mentioned previously, these
methods highly
underrepresented the existing microbial diversity (Smith et al. 2006). As a result, Antarctic soils were initially classified as “hostile” and “unable to sustain life”. The application of
culture-independent methods
(Brambilla et al. 2001; Wall et al. 2006; Cowan 2009; Cary et al. 2010) proved that Antarctic mineral soils, and particularly the Dry Valleys, harbor a
considerable amount of
microbial diversity, when
compared to what was initially thought and to what was observed in other environments (Cary et al. 2010) (Fig. 4). However, even though these cold desert ecosystem harbor a
much higher diversity than originally expected, microbial diversity is far lower in average than the one found in other biome types (Fierer et al. 2012).
A number of detailed phylogenetic surveys of Antarctic soils have been published recently (Aislabie et al. 2006; Smith et al. 2006; Yergeau et al. 2007b; Wood et al. 2008; Babalola et al. 2009; Pointing et al. 2009; Lee et al. 2012; Richter et al. 2014) and the most striking and consistent observation is that a substantial proportion of retrieved 16S rRNA gene sequences did not show high homology to the sequences of cultivable organisms, suggesting
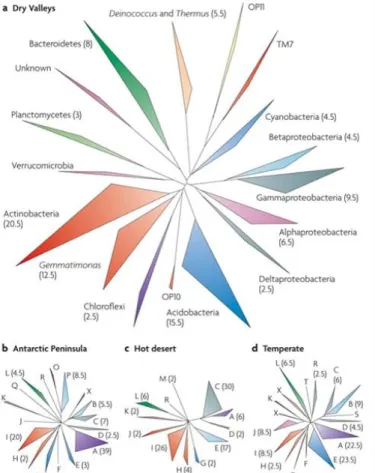
Figure 4. Phylogenetic diversity of bacterial 16s rRNA gene in different ecosystems. a. McMurdo Dry Valleys ((Smith et al. 2006; Niederberger et al. 2008; Aislabie et al. 2006); b. Antarctic Peninsula (Yergeau et al. 2007b); c. Hot desert (Chanal et al. 2006); d.Temperate surface soil (Liles et al. 2003; Lipson & Schmidt 2004; Sun et al. 2004). A, alphaproteobacteria; B, betaproteobacteria; C, gammaproteobacteria; D, deltaproteobacteria; E, Acidobacteria;F, OP10; G, Chloroflexi; H, Gemmatimonas; I, Actinobacteria; J, Verrucomicrobia;K, Planctomycetes; L, Bacteroidetes; M, Deinococcus and Thermus; O, TM7; P, cyanobacteria;Q, Fusobacteria; R, Firmicutes; S, epsilonproteobacteria; T, WS3; X, unknown isolates. (adopted from Cary et al. 2010)
that Antarctic soils harbor a large number of novel and possibly endemic species (Cowan 2009; Pointing et al. 2009; Cary et al. 2010; Sokol et al. 2013).
Bacterial community structure in the Dry Valleys varies considerably from the one observed in other regions of the continent (Fig. 4). At the phylum level, there is a decrease in the relative abundance of Proteobacteria and an increase in relative abundance of the Bacteroidetes and Actinobacteria phyla, when compared with the Antarctic Peninsula (Cowan 2014). Also, the prevalence of highly resistant members of the Deinococcus-Thermus and Gemmatimonadetes phyla in the mineral soils of the Dry Valleys distinguishes these soils from those with more temperate influences. However, even between valleys it is possible to observe structural differences between bacterial communities (Lee et al. 2012). Regarding Archaea, their existence has only been assessed in coastal soils near the Ross Sea (Aislabie et al. 2006; Ayton et al. 2010) using the 16S rRNA gene as molecular marker. A recent survey focused in the influence of soil properties in the diversity and distribution of archaeal diversity in the Dry Valleys revealed low overall richness, with most of the operational taxonomic units (OTUs) affiliated with the Thaumarchaeota phylum, and the remaining affiliated with the Euryarchaeota phylum (Richter et al. 2014).
These observations, focused on the major groups of prokaryotes came to reinforce the role of abiotic factors in driving microbial diversity, their role in Antarctic biogeochemical cycles, and also to guide future conservation planning strategies (di Prisco et al. 2012).
Research Objectives and Thesis Organization
Based on the premise that environmental variables have a preponderant role in shaping the abundance, diversity, structure and distribution of microbial communities in the Dry Valleys of Antarctica, this master project has two major goals which will be presented in two separate chapters:
Chapter I. The influence of the high gradients of soil geochemical parameters in controlling microbial metabolic activity, abundance and diversity was evaluated in Victoria Valley, covering a total of 86 sampling stations using community fingerprinting methods (ARISA). In order to understand in a more detailed way how one of those environmental parameters (water availability) dictates bacterial diversity and abundance, soils from a transect with increasing distance from a water source in Victoria Valley were retrieved and subjected to massive parallel pyrosequencing, by using Roche’s 454 technology.
Chapter II. This chapter will present an inter-valley comparison within the Transantarctic Mountains, of the diversity and phylogenetic affinities of the bacterial and archaeal functional gene amoA which is involved in one of the Earth’s major biogeochemical cycles – the nitrogen cycle. Here we investigated amoA gene diversity in the Darwin Mountains, Battleship Promontory, Miers, Beacon, Upper Wright and Victoria Valleys, where general soil microbial diversity and geochemistry have been previously described. We hypothesized that physicochemical heterogeneities of these extreme environments exert selective pressures on the groups of microorganisms involved in the ammonia oxidation pathway. Nitrogen biogeochemistry studies in the Antarctic Dry Valleys are still in their infancy and nitrogen is recognized to be a crucial element, regulating the microbial diversity and dispersion in these systems.
Chapter 1: The influence of water availability in
bacterial community structure: Victoria Valley
as a case study
I.
Background
1. Victoria Valley: a geologic perspective
The Victoria Valley system is the largest of the McMurdo Dry Valleys, with an ice-free area of approximately 650 km2. It contains five smaller valleys: the Victoria Upper, the Victoria
Lower, Barwick, Balham and McKelvin valleys which include the Bull Pass area. These valleys are located between 400-1000 meters above sea level (Bockheim & McLeod 2013) (Fig. 5).This system of valleys is characterized by an internal drainage system, which channels seasonal meltwaters to its topographic low point, which is the 5.7 km2 Lake Vida (McGowan
et al. 2014).Three large glacier tongues flow from the valleys: Victoria Upper, into Victoria Upper Valley and the Webb Glacier into Barwick Valley from northwest; the Victoria Lower Glacier from the Wilson Piedmont Glacier and local alpine glaciers from the northeast; and a smaller alpine glacier (Packard Glacier), that flows into Victoria Lower Valley (Fig. 5).
There have been some scientific controversies regarding the topology of this valley system, namely the potential past extension and depth of Lake Vida, and the existence of other high level lakes (Calkin 1971; Hall et al. 2002). However, recent studies failed to validate this hypothesis, due to the lack of significant differences in the salt levels of soils in relation to elevation (Bockheim & McLeod 2013).
It is important from the ecological point of view to understand the geological features of these locations, as well as the chronology of their genesis, because the few existing life forms thrive mostly in soil, between and/or below the rocks, due to the low water availability and high incidence of ultraviolet radiation (Cameron 1972).
Figure 5. Location of the Victoria Valley System, Antarctica, showing the site of the bench-like features in the eastern Victoria Valley. The five valleys that compose the system are shown, as well as the biggest water source – Lake Vida – in the midpoint of the valley system. Adapted from McGowan et al. (2012).
II. Goals
Environmental parameters are known to shape the abundance and diversity of microbial communities. Using community fingerprinting methodologies (ARISA), we aimed to characterize the existing microbial communities in terms of bacterial richness and abundance in the Victoria Valley, from the 86 sampling stations sampled in the K020 Antarctic field campaign. In addition, given the fact that water is one of the major limiting factors to the existence of life in Antarctic ecosystems, we determined its effect in the bacterial community dynamics, in terms of taxa richness, abundance and diversity across a transect with a gradient of water availability in Victoria Valley. Inferences were done based on the 16s rRNA gene sequences amplified using a NGS technology (Roche’s 454). NGS data analysis was performed using QIIME, but results from other two pipelines (SILVAngs and Metabiodiverse) are also presented.
We believe that this study provides critical insights regarding the intrinsically adapted and still largely unknown bacterial communities which are known to inhabit the Dry Valleys, which may represent sources of commercial, biological and medical interest.
III. Material and Methods
1. Sampling
The sampling program of this work was performed on behalf of the NITROEXTREM project, integrated in the ICTAR international program (ICTAR–
www.ictar.aq), which
coordinated, in January 2013, an Antarctic field campaign (K020) covering a sampling area of approximately 300 km2 in the Victoria Valley
system. One main field camp and three sub camps were set up to cover a total of 86 random sampling locations during three weeks of field campaign, with
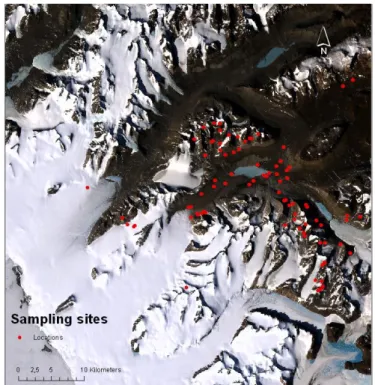
the main goal of building a model to link biodiversity with landscape and environmental factors. Soil from 86 sampling stations were collected (Fig. 6), and soil characteristics were measured for further analysis. In addition to the 86 sampling points, a total of six sites between T1 (77º 20.241’S, 161º 38.593’E (WGS84)) and T6 (77º 20.232’S, 161º 38.526’E (WGS84)) were sampled from a 32 m transect with increasing distance from a water pond near the main water source in this valley – Lake Vida. Several scoops of soil were collected aseptically and stored in a sterile Whirl-Pak (Nasco International Inc., Fort Atkinson, WI, USA) and kept at -80 ºC until further analysis.
All the procedures involved in the sampling campaign, as well as all the in situ measurements were performed and managed by the NZTABS in-field multidisciplinary team. All necessary and appropriate precautions were taken in order to avoid anthropogenic or cross-site contaminations. Aliquots of soil samples were shipped to Oporto’s University and analyzed on behalf of this project.
Figure 6.Location of the 86 sampling sites from which soil samples were collected in the K020 Antarctic field campaign.
2. Physico-chemical parameters
Water Activity (AW) is a measure of the amount of water available to microorganisms
and it is a very good indicator on whether the specific habitat is capable of supporting life. Aw
in all sampling points was measured in situ using a portable water activity analyzer (PaWKit
AquaLab, Decagon).
Conductivity and pH in all sampling points were also measured in situ using a CyberScan PC 510 Bench Meter (Eutech Intruments, Pte Ltd, Singapore) following the slurry technique which consists in mixing 1:2.5 mass ratio of samples and de-ionized water (Edmeades et al. 1985).
Organic carbon (OC) was only measured in the transect samples and was indirectly assessed from the subtraction of inorganic carbon (IC) from total carbon (TC). These two components were measured with a Shimadzu TOC-V CSH/CSN equipment. TC was measured by high temperature catalytic oxidation followed by non-dispersive infrared detection of CO2. For IC, samples were acidified (1.5% HCl 2 M) and sparged with carrier gas
(purified air) to convert only the inorganic carbon to CO2, which was also detected by infrared.
Calibration curves were generated for TC, using glucose (40% carbon) and for IC, using sodium carbonate (11.3% carbon). Three replicates from each sampling site were weighted (100 mg) and dried at 28 ºC for one hour before measurements.
3. Biological parameters
ATP (adenosine triphosphate) is a molecule that all living organisms produce and use in their metabolic processes, so the amount of biomass in a sample can be estimated by measuring the amount of ATP present in a sample. ATP was measured in situ by mixing the sample with an enzyme called luciferase, which reacts with the ATP to produce light. The amount of light produced indicates how much ATP is present in the sample and is measured in RLU (relative light units). In all the sampling points, this was done using a 3M™ Clean-Trace™ surface ATP kit, and results were measured in a 3M™ Clean-Clean-Trace™ NG Luminometer.
The total number of prokaryotic cells in the sediment samples was estimated by epifluorescence microscopy by a direct count of DAPI (4',6-diamidino-2-phenylindole - VWR) stained cells (Pernthaler et al. 2001; Llobet-Brossa, et al. 1998). One gram of sediment was weighed and fixed in 4% formaldehyde (AppliChem GmbH). Tween 12.5% (AMRESCO) was added and the sample was vortexed, sonicated (VWR® symphony™ Ultrasonic Cleaners) and
left for overnight incubation. In the following day, an aliquot of 350 µl of each sample was mixed with Tween 12.5 %, dilution water and 10 µl DAPI (0.5 mg/ml) (AppliChem GmbH) per ml of solution. Then, cells were filtered through the surface of 0.2 μm pore-size polycarbonate membranes by vacuum filtration and set up in a paraffin plate, to be later visualized using fluorescence microscopy (Zeiss Axiovision Z1). Fifteen fields were randomly photographed and cells were counted using the ImageJ 1.48v software (Abràmoff 2004). The following formula was used to calculate the total number of prokaryotes in the samples:
Total cell counts= a.b c.d x 10
6
Where,
a – area of the filter (mm2)
b – average number of cells per field c – field area (µm2)
d – filtered volume (ml) 106 – conversion from mm2 to µm2
4. DNA extraction
Samples were extracted using a modification of the CTAB
(Cetyltrimethylammonium bromide) extraction protocol (Barrett et al. 2006a). One gram of homogenized soil from each sample site was weighed and phosphate (100 mM NaH2PO4)
and SDS buffers were added (100 mM NaCl, 500 mM Tris, pH 8.0, 10% SDS). After agitation, vortexing and recovering of the supernatant, the CTAB solution was added and samples were incubated for 30 minutes. Afterwards, they were washed twice with chloroform isoamyl alcohol (24:1), centrifuged and the supernatant was retrieved. Then, 7M of ammonium acetate buffer was added, samples were centrifuged, the supernatant was retrieved and 0.54 volumes of isopropyl alcohol were added. After centrifugation, and recovery of the supernatant, the samples were submitted to an overnight incubation. In the following day, samples were washed in 70% ethanol, eluted in 25 µl of nuclease-free water and stored at -80 ºC. Two replicates were extracted for each sampling site.