Catabolism of Branched Chain Amino Acids
Contributes Significantly to Synthesis of
Odd-Chain and Even-Odd-Chain Fatty Acids in 3T3-L1
Adipocytes
Scott B. Crown, Nicholas Marze, Maciek R. Antoniewicz*
Department of Chemical and Biomolecular Engineering, Metabolic Engineering and Systems Biology Laboratory, University of Delaware, Newark, Delaware, United States of America
*mranton@udel.edu
Abstract
The branched chain amino acids (BCAA) valine, leucine and isoleucine have been implicated in a number of diseases including obesity, insulin resistance, and type 2 diabetes mellitus, although the mechanisms are still poorly understood. Adipose tissue plays an important role in BCAA homeostasis by actively metabolizing circulating BCAA. In this work, we have inves-tigated the link between BCAA catabolism and fatty acid synthesis in 3T3-L1 adipocytes using parallel13C-labeling experiments, mass spectrometry and model-based isotopomer
data analysis. Specifically, we performed parallel labeling experiments with four fully13
C-labeled tracers, [U-13C]valine, [U-13C]leucine, [U-13C]isoleucine and [U-13C]glutamine. We measured mass isotopomer distributions of fatty acids and intracellular metabolites by GC-MS and analyzed the data using the isotopomer spectral analysis (ISA) framework. We dem-onstrate that 3T3-L1 adipocytes accumulate significant amounts of even chain length (C14:0, C16:0 and C18:0) and odd chain length (C15:0 and C17:0) fatty acids under standard cell cul-ture conditions. Using a novel GC-MS method, we demonstrate that propionyl-CoA acts as the primer on fatty acid synthase for the production of odd chain fatty acids. BCAA contributed significantly to the production of all fatty acids. Leucine and isoleucine contributed at least 25% to lipogenic acetyl-CoA pool, and valine and isoleucine contributed 100% to lipogenic propionyl-CoA pool. Our results further suggest that low activity of methylmalonyl-CoA mutase and mass action kinetics of propionyl-CoA on fatty acid synthase result in high rates of odd chain fatty acid synthesis in 3T3-L1 cells. Overall, this work provides important new insights into the connection between BCAA catabolism and fatty acid synthesis in adipocytes and underscores the high capacity of adipocytes for metabolizing BCAA.
Introduction
The branched chain amino acids (BCAA) valine, leucine and isoleucine are essential amino acids that comprise about 15–25% of total protein intake [1]. The first step of BCAA catabolism is the conversion of BCAA to their respectiveα-keto acids through mitochondrial branched chain OPEN ACCESS
Citation:Crown SB, Marze N, Antoniewicz MR (2015) Catabolism of Branched Chain Amino Acids Contributes Significantly to Synthesis of Odd-Chain and Even-Chain Fatty Acids in 3T3-L1 Adipocytes. PLoS ONE 10(12): e0145850. doi:10.1371/journal. pone.0145850
Editor:Gregory P Tochtrop, Case Western Reserve University, UNITED STATES
Received:September 24, 2015
Accepted:December 9, 2015
Published:December 28, 2015
Copyright:© 2015 Crown et al. This is an open access article distributed under the terms of the
Creative Commons Attribution License, which permits unrestricted use, distribution, and reproduction in any medium, provided the original author and source are credited.
Data Availability Statement:All relevant data are within the paper and its Supporting Information files.
aminotransferase (BCATm). Hepatic activity of this initial enzymatic step is very low [2], although the liver can readily oxidize theα-keto acids formed from BCATm activity in other peripheral
tis-sues, such as skeletal muscle, cardiac muscle and adipose tissue. The rate-limiting step of BCAA catabolism is branch chain keto-acid dehydrogenase (BCKDH), which can be found in a host of tis-sues including liver, skeletal muscle, kidney, and adipose tissue. The major tissue responsible for BCAA oxidation is believed to be skeletal muscle [3]; however, the role of other tissues in BCAA metabolism, especially in states of metabolic disease are not well understood.
Due to poor catabolism of BCAA in the liver, BCAA can circulate through the bloodstream and act as signaling molecules of the nutritional state. BCAA, especially leucine, have been implicated as important sensor molecules that interact with the cell survival signaling pathway, i.e. mammalian target of rapamycin (mTOR), and the insulin signaling cascade [1,4,5]. Ele-vated plasma concentrations of BCAA and BCAA metabolism byproducts, e.g. alanine, gluta-mate/glutamine, and C3/C5-carnitine species, have been identified as a metabolic signature of obese individuals compared to their lean counterparts [6]. In addition, several cohort studies have demonstrated that elevated circulating concentrations of BCAA may even serve as bio-markers for predicting the development of insulin-resistance and T2DM [7–10]. Furthermore, there is evidence that BCAA levels associate with the success of weight-interventions either through lifestyle changes [8] or bariatric surgery [11,12].
Adipose tissue, an often underappreciated endocrine organ and regulator of energy homeo-stasis [13,14], may play a crucial role in amino acid regulation through modulation of circulat-ing BCAA levels [15]. Disruption of adipose-specific catabolism of BCAA has been observed in obese and insulin-resistant states and correlated with elevated circulating BCAA concentra-tions [15–17]. It is hypothesized that changes in adipose BCAA oxidation plays an important role in the incidence and progression of these metabolic diseases [18].
With the important role adipose plays in BCAA metabolism, it is of interest to examine the interplay between BCAA catabolism and glucose metabolism. 3T3-L1 adipocytes are an impor-tantin vitromodel system for adipose tissue and are commonly used as this cell line has similar
phenotypic behavior as adipose tissue. It has been well documented that BCAA catabolic enzyme activities and expression levels greatly increase over the course of 3T3-L1 differentia-tion [19–21]. In addition, agonism of PPARγ, a key receptor in glucose and fatty acid
metabo-lism, results in increased transcript levels of BCAA catabolic enzymes [22]. Furthermore, glucose and BCAA catabolism are coupled in 3T3-L1 adipocytes as inhibition of glucose metabolism with 2-deoxy-D-glucose resulted in decreased BCAA catabolic enzyme activity and expression, regardless of insulin supplementation [22].
In this work, we have quantified for the first time the contribution of BCAA to fatty acid synthe-sis in 3T3-L1 adipocytes. To this end, parallel isotopic labeling experiments were performed with four13C-tracers: [U-13C]valine, [U-13C]leucine, [U-13C]isoleucine and [U-13C]glutamine. While conducting this work, we noted a significant accumulation of odd chain length fatty acids in 3T3-L1 adipocytes. With the help of a novel GC-MS analysis technique we systematically eluci-dated the pathway of odd chain fatty acid synthesis. Overall, this work represents an important advance towards understanding the interconnection between BCAA and fatty acid metabolism in adipocytes. Moreover, this study demonstrates the power of using parallel13C-labeling experiments for pathway quantification and highlights a novel GC-MS methodology for fatty acid analysis.
Materials and Methods
Materials
Culture materials were purchased from Cellgro (Mediatech, Manassas, VA). [U-13C]Valine (99 atom%13C), [U-13C]leucine (98%), [U-13C,15N]isoleucine (99%13C), [U-13C]glutamine (98%
13C) and [U-13C]algal amino acids (97+%13C) were purchased from Sigma-Aldrich (St. Louis,
MO). Free amino acids were purchased from Fisher Sci. (Hampton, NH). Amino acid standard H was purchased from Pierce Sci. (Rockford, IL). Stock solutions (40x) of natural and uni-formly13C-labeled valine, leucine, and isoleucine were prepared at 40mM in deionized water. Stock solutions (40x) of natural and [U-13C]glutamine were prepared at 160mM in deionized water. [U-13C]algal amino acids were solubilized at 10mg/mL in 0.1N HCl phosphate buffered saline. All amino acid solutions were stored at -85°C until use.
Culture and differentiation of 3T3-L1 adipocytes
Pre-adipocyte 3T3-L1 cells (ATCC, Cat. No. CL-173) were cultured in Dulbecco’s modified Eagle medium (DMEM, Cellgro, Cat. No. 10–013) supplemented with 10% fetal calf serum (FCS, Sigma-Aldrich, Cat. No. N4762) and 1% penicillin-streptomycin solution (PS) in T-25 CellBIND flasks (Corning, NY). Cells were grown in a humidified incubator at 37°C with 10% CO2and passaged every three days (~70% confluence) at a split ratio of 1:6. Medium was
exchanged with fresh medium every two days (Fig 1). To prepare for differentiation, preadipo-cytes were grown to 100% confluence and maintained at confluency for one day (designated as
Fig 1. Timeline for13C-tracer experiments with 3T3-L1 adipocytes.
day 0). The monolayers were then incubated for 48 hours in DMEM with 10% fetal bovine serum (FBS, Cellgro, Cat. No. 35-011-CV), 1% PS and a differentiation cocktail that included 1μg/mL insulin, 1μM dexamethasone (dex) and 0.5mM 3-isobutyl-1-methylxanthine (IBMX).
After 48 hours (day 2), medium was exchanged with DMEM/FBS/PS medium supplemented with 1μg/mL insulin. On day 4, medium was exchanged with DMEM/FBS/PS medium without
any supplementations. On day 6, medium was exchanged with glutamine-free DMEM medium (Cellgro, Cat. No. 15–013) supplemented with 10% FBS, 1% PS, and additions of valine, leu-cine, isoleucine and glutamine from the 40x stock solutions. For parallel labeling experiments, one of the four amino acids was uniformly13C-labeled and the other amino acids were unla-beled. After 24 hours of incubation (day 7), cells were harvested for metabolite extraction as described below.
Cell visualization and staining
The differentiating adipocytes were observed by phase contrast imaging using a Leica DMI6000 B inverted microscope. Fatty acid visualization was conducted with Oil Red O (Sigma-Aldrich, Cat. No. O-0625) staining. To stain the cells, cells were washed twice with PBS, followed by fixation with a 10% formalin solution. After two washes with 60% isopropa-nol, cells were stained with 0.3% (w/v) Oil Red O in 60% isopropanol. Upon removal of Oil Red O, cells were washed twice with PBS and visualized using a Leica DMI6000 B inverted microscope.
Isotopic tracer experiments
For isotopic tracer experiments, one vial of frozen 3T3-L1 cells was thawed and plated in a T-25 flask. After four days, the cells were split into fresh T-T-25 flasks (passage 1), grown for three days, and split again at a split ratio of 1:6 (passage 2) (Fig 1). This resulted in a total of 26 flasks for cell culture experiments, where all cells were derived from the same frozen vial.
Four stable isotope tracers were used in the study: 1) [U-13C]valine (MPE ~45%); 2) [U-13C]leucine (MPE ~42%); 3) [U-13C,15N]isoleucine (MPE ~54%); 4) [U-13C]glutamine (MPE ~97%). The molar percent enrichment (MPE) of the BCAA tracers is less than 100%, since the BCAA tracers were added in addition to the ~0.8mM already present in DMEM media. All isotopic tracer experiments were conducted with four biological replicates (n= 4)
where the only difference was which amino acid was labeled. In addition to the 16 flasks for the labeling experiments, six flasks were used for cell counting. Furthermore, four flasks without tracer addition were used for quantifying media metabolites and 500μL of media was removed
at 0, 6, 12 and 24 hours. At the end of the labeling experiment (day 7), tracer experiment flasks were harvested and cells were extracted as described below to obtain intracellular metabolites for analysis of13C-labeling by GC-MS. All samples were stored at -85°C prior to analysis.
Viable cell number, glucose and lactate analysis
Cell numbers (n = 6) were measured using a hemocytomer and cell viability was determined by trypan blue exclusion method. For each sample, a minimum of 500 cells was counted. Concen-trations of glucose and lactate were measured in triplicate by YSI 2700 biochemistry analyzer (YSI, Yellow Springs, OH).
Gas chromatography-mass spectrometry
metabolites and fatty acid picolinyl esters; and a DB-23 capillary column (30 m x 0.25 mm i.d. x 0.25μm; Agilent J&W Scientific) for analysis of fatty acid methyl esters (FAMEs) [23]. The
GC instrumented interfaced with a Waters Quatro Micro GC-MS/MS (Milford, MA) operating under electron impact ionization at 70 eV and 200°C ion source temperature. The injection port and interface temperatures were 250°C for the DB-5ms column and 230°C for the DB-23 column. Helium flow was maintained at 1 mL/min. Mass spectra were recorded in selected ion recording (SIR) mode with 30 ms dwell time. Mass isotopomer distributions were obtained by integration of ion chromatograms [24] and corrected for natural isotope abundances [25].
Extraction of intracellular metabolites
At the harvesting time, culture medium was collected from the T-25 flasks and stored at -85°C until further analysis. The cells were washed twice with a chilled 0.9% NaCl solution (4°C). Metabolic activity was quenched by the addition of 1.5 mL of cold methanol (-20°C) and cells were subsequently placed on ice. After five-minute incubation, cells were scraped off the flask surface and the cell suspension was transferred into glass tubes with Teflon-sealed caps. Next, 1.5 mL of chloroform was added and the tubes were vortexed vigorously for 10 s. Lastly, any remaining cell debris in the flasks was resuspended in 1.5 mL of water and transferred to the glass tubes. The tubes were vortexed for 1 minute and then stored overnight at 4°C. The follow-ing day, the tubes were centrifuged at 2000 rpm and 4°C for 20 minutes. The resultfollow-ing phase separation resulted in an aqueous upper phase containing polar metabolites and an organic lower phase containing nonpolar metabolites. The upper phase (methanol and water) was transferred to two 1.5 mL Eppendorf tubes and the lower phase (chloroform) was transferred to a glass tube with a Teflon-sealed cap. Samples were stored at -85°C until further use.
Derivatization and GC-MS analysis of extracellular metabolites
Immediately after sampling, 200μL of medium was spiked with 30μL of 10 mg/mL [U-13C]
algal solution, 10μL of 60 mM [U-13C]glutamine and 30μL of 0.1N HCl [26]. Samples were
then treated with 1 mL of cold acetone (-20°C) and vortexed vigorously. The deproteinized samples were centrifuged at 14,000g for 5 minutes and the supernatants were evaporated to dryness under N2flow at 37°C using an evaporator (Reacti-Vap/Reacti-Therm III; Fierce,
Rockford, IL). 50μL of pyridine was added to the samples and mixed by pipetting. 50μL of
N-methyl-N-(tert-butyl-dimethylsilyl)-trifluoroacetamide (MTBSTFA) + 1% tert-butyldimethyl-chlorosilane (TBDMS) (Thermo Scientific, Bellefonte, PA) was added and the samples were derivatized at 60°C for 30 minutes. Afterwards, samples were incubated overnight at room temperature. The derivatized samples were centrifuged for 2 minutes at 14,000g and the super-natants were transferred to GC vials for GC-MS analysis. The injection volume was 1μL and
samples were injected in split mode with split ratio ranging from 1:10 to 1:20. GC oven temper-ature was held at 80°C for 2 minutes, increased to 280°C at 7°C/min and held until the total run time was 40 minutes. Mass spectra of selected metabolite fragments (Table B inS1 File) were collected in SIR mode.
Derivatization and GC-MS analysis of intracellular metabolites
The extracted aqueous samples were thawed and evaporated to dryness at 37°C with N2using
an evaporator. During the process, the contents of the two Eppendorf tubes were combined. Metabolites were suspended in 50μL of 2 wt% methoxylamine hydrochloride in pyridine and
incubated at 37°C for 90 minutes on a heating block. Next, 70μL of MTBSTFA + 1% TBDMS
at 14,000g and the supernatants were transferred to GC vials for GC-MS analysis. The injection volume was 1μL and samples were injected in split mode with split ratio ranging from 1:2 to
1:5. GC oven temperature was held at 70°C for 2 minutes, increased to 140°C at 3°C/min, increased to 150°C at 1°C/min, increased to 242°C at 3°C/min, increased at 10°C/min to 280°C and held until the total run time was 75 minutes. Mass spectra of selected metabolite fragments (Table C inS1 File) were collected in SIR mode.
Derivatization and GC-MS analysis of fatty acids
For analysis of fatty acid labeling, the chloroform phase was defrosted and split into two glass tubes. Both samples were then evaporated to dryness under air at 37°C using an evaporator. One sample was prepared as fatty acid methyl esters (FAMEs) to measure molecular ion mass spectra. The second sample was derivatized into picolinyl esters to obtain positional labeling information.
Fatty acid methyl ester (FAME) derivatization and GC-MS analysis. Dried lipids were resuspended in 1 mL of chloroform and 1 mL of methanol. Next, 100μL of concentrated
sulfu-ric acid was added to the samples. The glass tubes were wrapped with Teflon tape and sealed with Teflon-coated caps. After 2-hour incubation at 100°C, the samples were cooled to room temperature and 0.5 mL of deionized water was added. The resulting two-phase mixtures were vortexed vigorously for 1 minute and allowed to phase separate. To accelerate phase separation, samples were centrifuged at 2000 rpm and 4°C for 5 minutes. After a clear phase boundary formed, the lower phase (chloroform) was pipetted into a 1.5 mL Eppendorf tube and evapo-rated to dryness at 37°C under air using an evaporator. The samples were then resuspended in 200μL of hexane and mixed by pipetting. To remove insoluble debris, samples were
centri-fuged at 14,000 rpm for 2 minutes. The clear liquid was transferred to a glass GC vial for GC-MS analysis. The injection volume was 1μL and samples were injected in split mode with
split ratio ranging from 1:4 to 1:10. GC oven temperature was held at 125°C for 2 minutes, increased to 240°C at 5°C/min, and held until the total run time was 30 minutes. Mass spectra of selected metabolite fragments (Table C inS1 File) were collected in SIR mode.
Picolinyl ester derivatization and GC-MS analysis. Picolinyl ester derivatization was modified from previous studies [27,28]. Dried lipids were resuspended in 1 mL dichloro-methane. Next, 300μL of a fresh 3-hydroxymethylpyridine and potassium tert-butoxide (in
1M THF) solution (2:1 v/v) was added to the samples. After 30-minute incubation at 40°C, the solutions were cooled to room temperature, 2 mL of water was added to the samples, followed by 4 mL of hexane. The resulting solution was vortexed vigorously. Once two phases were clearly formed, the upper phase (organic) was collected and passed through packed sodium sul-fate bed to strip moisture. The anhydrous samples were then evaporated to dryness at 37°C under air using an evaporator. The samples were then resuspended in 100μL of hexane and
mixed by pipetting. To remove insoluble debris, samples were centrifuged at 14,000 rpm for 2 minutes. The clear liquid was transferred to a glass GC vial for GC-MS analysis. The injection volume was 1μL and samples were injected in split mode with split ratio ranging from 1:5 to
1:10. GC oven temperature was held at 200°C for 10 minutes, increased to 210°C at 5°C/min, held for 5 minutes, increased to 280°C at 5°C/min and held until the total run time was 40 min-utes. Mass spectra of selected metabolite fragments (Table C inS1 File) were collected in SIR mode.
Determination of [U
-13C]algal amino acid concentrations
To determine concentrations of amino acids in [U-13C]algal amino acid solution, 30μL of
standard H (1.25μmol/mL for cystine, and 2.5μmol/mL for other amino acids). Samples were
dried under nitrogen, derivatized with TBDMS, and analyzed by GC-MS as described above. From the isotopic dilution of the mass spectra the concentrations of the amino acids in the [U-13C]algal solution were determined (Table B inS1 File) [29]. The [U-13C]algal amino acid solution was then used as an internal standard to quantify the concentrations of amino acids in medium samples.
Isotopomer spectral analysis of fatty acids
Isotopomer spectral analysis (ISA) was conducted on the measured mass isotopomer distribu-tions (MIDs) of C14:0, C15:0, C16:0, C17:0 and C18:0 fatty acids [30] to determine the frac-tional new synthesis of each fatty acid (g-values) and the relative contributions of glutamine, BCAA, and other metabolites to the precursor pools for fatty acid synthesis (D-values). Even chain length fatty acids were modeled as the condensation products of multiple acetyl-CoA (AcCoA) units. For example, C16:0 was modeled as the condensation product of 8 AcCoAs. Odd chain length fatty acids were modeled as the condensation product of a three-carbon pre-cursor (propionyl-CoA, PropCoA) and multiple AcCoAs. For example, C15:0 was modeled as the condensation product of PropCoA and 6 AcCoAs. Metabolites contributing to lipogenic AcCoA were leucine, isoleucine, glutamine and other unlabeled metabolites (e.g. glucose); metabolites contributing to lipogenic PropCoA were valine and isoleucine (Tables AS, AT and BT inS1 File).
In addition to determining D- and g-values, we also determined the mass isotopomer distri-butions of AcCoA and PropCoA produced from13C-glutamine and13C-BCAA tracers. For example, rather than assuming that [U-13C]glutamine and [U-13C]-labeled BCAA would pro-duce M+2 labeled AcCoA, in the ISA model we allowed each [U-13C]-labeled tracer to produce M+1 and M+2 AcCoA; similarly, [U-13C]valine and [U-13C]isoleucine were allowed to pro-duce M+1, M+2 and M+3 labeled PropCoA (Tables AS, AT and BT isS1 File). The relative abundances of M+1, M+2 and M+3 mass isotopomers were estimated together with the other ISA model parameters using the Metran software [31], which is based on the EMU framework [32]. In short, ISA model parameters were estimated by minimizing the variance-weighted sum of squared residuals (SSR) between the experimentally measured and model predicted mass isotopomers of fatty acids using non-linear least-squares regression [33]. For each fatty acid, the MIDs from the four parallel tracer experiments with [U-13C]glutamine, [U-13C] valine, [U-13C]leucine and [U-13C]isoleucine tracers were fitted simultaneously. Methods for parallel fitting of multiple data sets with the Metran software have been described before [34–
36]. In order to find a global solution, flux estimation was repeated at least 10 times starting with random initial values for all fluxes. The fitted results were subjected to aχ2statistical test
to assess the goodness-of-fit, and accurate 95% confidence intervals were computed for all esti-mated parameters by evaluating the SSR sensitivity to flux variations [37,38].
Results
Cell growth and differentiation of adipocytes
3T3-L1 cells were cultured from the pre-adipocyte state to confluence and 24 hours post con-fluence (designated day 0), the cells were chemically differentiated with insulin, dexamethasone and IBMX to achieve the mature adipocyte phenotype (Fig 1). Undifferentiated preadipocyte cells, counted on day 0, had a viable cell density of 1.28 ± 0.03 ×10⁶cells/mL and viability of 95 ± 1% (Table A inS1 File).
4, small droplets of triglyercides were visible in the periphery of the cells and over the remain-ing duration until day 10, triglyceride droplet accumulation increased until almost the entire cell volume was comprised of lipid droplets. Cells were treated with Oil Red O to confirm tri-glyceride accumulation (Fig 2B). On day 0, no visible staining of lipids was detected. After four days, triglyceride accumulation was detected in small amounts, especially in the periphery of cells. On day 10, almost the entire intracellular volume was stained, indicating significant accu-mulation of triglycerides. For13C-tracer experiments, it was desirable to have noticeable accu-mulation of triglycerides over the duration of the tracer experiment. We determined that day 6 would be ideal for isotopic experiments, since the adipocyte phenotype has already been devel-oped by that time [39–41], and intracellular triglyceride accumulation has not yet saturated.
Glucose, lactate and glutamine metabolism
Extracellular glucose, lactate and glutamine concentration profiles between days 6 and 7 are shown inFig 3A. The initial glucose concentration was ~20 mM. Glucose was consumed at a constant rate of 227 nmol/106cells/h. The initial lactate concentration was 1.7 mM. Lactate was initially produced at a relatively high yield on glucose of ~1.4 mol/mol, but this decreased to ~0.4mol/mol after 24 hours (Fig 3B). Since glucose consumption remained constant over the 24-hour period, the decreased lactate yield indicates a shift in pyruvate metabolism. The initial glutamine concentration was ~3.5 mM and increased to 4.1 mM. Glutamine was pro-duced at a tenth of the rate of glucose uptake (23 nmol/106cells/h). Despite the net increase in glutamine concentration, glutamine was highly exchanged between the medium and the cells. For [U-13C]glutamine experiments, medium glutamine was initially 100% M+5 labeled;
Fig 2. 3T3-L1 adipocyte differentiation.(A) Phase contrast images of 3T3-L1 cells from induction (day 0) to ten days post-induction. Cells initially display a fibroblast phenotype. Over the course of differentiation, cell morphology changes and cells accumulate lipid droplets internally. (B) Triglyceride staining of 3T3-L1 cells with Oil Red O. Initially, the fibroblast phenotype displays negligible staining. As the adipocytes mature, the amount of staining increases until almost the entire cell volume is stained red.
doi:10.1371/journal.pone.0145850.g002
Fig 3. (A) Glucose, lactate, and glutamine concentration profiles over the course of the tracer experiment between days 6 and 7 (mean±stdev;
n= 4 biological replicates). (B) Profile of lactate concentration versus glucose concentration.The yield of lactate on glucose decreased during the experiment as indicated by a change in the slope.
however after 24 hours glutamine was only about 60% M+5 labeled (Figure F inS1 File). The decrease in M+5 labeling could not be explained solely by net glutamine secretion, as that would have resulted in ~85% M+5 (= 3.5mM /4.1mM).
Amino acid metabolism
Several other amino acids were also actively net consumed (or produced) by the cells (Fig 4
andTable 1). Significantly, the cells readily consumed the BCAAs valine, leucine, and isoleu-cine. Isoleucine and leucine were consumed at comparable rates, 25 nmol/106cells/h, whereas valine uptake rate was 14 nmol/106cells/h. The BCAA consumption rates were several-fold greater than the consumption rates of other amino acids. Other than glutamine, the major
Fig 4. Amino acid concentration profiles over the course of the tracer experiment between days 6 and 7 (mean±stdev;n= 4 biological replicates). Valine, leucine and isoleucine were consumed at a high rate, while glycine and alanine were secreted by the cells.
secreted amino acids were alanine and glycine (Fig 4). Secretion of alanine and glycine is com-monly observed in mammalian cell cultures as these amino acids can serve as a nitrogen sink [42].
Fatty acid profiling
Intracellular fatty acids were assayed by GC-MS after extraction of cellular triglycerides and subsequent transesterification with methanol. A representative total ion chromatogram for fatty acid methyl esters (FAMEs) is shown inFig 5. Both even and odd chain fatty acids were detected, ranging in chain length from C14 to C18.
Link between BCAA catabolism and fatty acid synthesis
To investigate a potential link between BCAA catabolism and fatty acid synthesis, experiments were conducted with [U-13C]valine, [U-13C]leucine, [U-13C]isoleucine, and [U-13C]glutamine as tracers. Mass isotopomer distributions of FAMEs of pentadecanoic (C15:0) and palmitic (C16:0) acid are shown inFig 6. Comparing the spectra for C15:0 and C16:0 we noted that: 1) for [U-13C]valine, C15:0 had a significant M+3 isotopomer, whereas C16:0 did not; 2) for [U-13C]isoleucine, C15:0 had a significant M+3 isotopomer and C16:0 did not; both fatty acids had M+2 isotopomers; 3) for [U-13C]leucine, both fatty acids had M+1 and M+2 isotopomers; 4) for [U-13C]glutamine, both fatty acids had M+2 and M+4 isotopomers.
Catabolism of valine and isoleucine is known to produce propionyl-CoA (PropCoA), which can account for M+3 isotopomers in [U-13C]valine and [U-13C]isoleucine experiments. As expected, palmitic acid did not show M+3 incorporation, since even chain fatty acids are formed solely from condensation of AcCoA. Isoleucine degradation also contributes to AcCoA, which explains the M+2 isotopomers in [U-13C]isoleucine experiments. Leucine degrades only into AcCoA, which accounts for M+1 and M+2 isotopomers in the [U-13 C]leu-cine experiment. Details regarding the formation of M+1 isotopomers from [U-13C]leucine are
Table 1. Glucose, lactate and amino acid production and consumption rates (nmol/106cells/h,
mean±SEM,n= 4 biological replicates).
Metabolite Rate
Glucose -227±6
Lactate 153±31
Alanine 10.4±5.1
Glycine 12.0±0.2
Valine -14.2±0.8
Leucine -25.8±2.5
Isoleucine -23.5±2.2
Methionine -0.7±0.1
Serine -2.2±0.4
Threonine 1.4±0.8
Phenylalanine 1.0±0.1
Aspartate -1.2±0.6
Glutamate -2.3±1.2
Tyrosine 0.6±0.1
Glutamine 23.2±0.8
Negative values denote net consumption.
discussed in the next section. Glutamine also contributes to lipogenic AcCoA pool, which explains the M+2 and M+4 isotopomers for [U-13C]glutamine experiments.
From these experiments, it can be concluded that valine and isoleucine both contribute to odd chain fatty acid synthesis through PropCoA precursor, and that PropCoA is not involved in the synthesis of even chain fatty acids. Furthermore, isoleucine, leucine, and glutamine all contribute to lipogenic AcCoA precursor pool.
Odd chain fatty acid synthesis pathway
To investigate where PropCoA is added to odd chain fatty acid carbon backbone, two fatty acid derivatizations were used in this study to gain structural information. FAMEs were used to
Fig 5. Total ion chromatogram from GC-MS analysis of fatty acid methyl esters (FAMEs).Fatty acids were extracted from differentiated 3T3-L1 adipocytes. Selected ion recording of molecular ions was conducted for GC-MS analysis.
determine the labeling of the complete molecule and picolinyl esters were utilized for investigating fragments of shorter carbon length. The structure of picolinyl esters and a representative mass spec-trum of the palmitate derivative are shown inFig 7. Mass spectra of picolinyl esters are character-ized by fragments that are separated by 14 amu (e.g.m/z332,318, 304, etc. for the palmitate
derivative), corresponding to subsequent removal of -CH2subunit from theω-end of the fatty acid.
For odd chain fatty synthesis it is assumed that PropCoA acts as the primer on fatty acid synthase that is subsequently elongated by AcCoA units. For [U-13C]valine, this would result in pentadecanoic acid being labeled on the first three carbons from theω-end, i.e. carbon
atoms C13-15. By applying the picolinyl ester derivatization for the [U-13C]valine experiment, this hypothesis was tested by measuring labeling of fragments corresponding to the removal of carbon atoms C13, C14 and C15 from pentadecanoic acid (Fig 8A). For the entire molecule (i.e. the FAME derivative) M+3 labeling was observed. Cleavage of the last carbon atom resulted in M+2 labeling, cleavage of the last two carbons resulted in M+1 labeling, and cleav-age of the last three carbons resulted in an unlabeled fragment (Fig 8). The mass spectrum for pentadecanoic acid thus followed the expected trend. For palmitic acid, the fatty acid was unla-beled (M+0) for each fragment as was anticipated given that even chain fatty acids are pro-duced from the elongation of AcCoAs. These data clearly show that PropCoA acts as the primer on fatty acid synthase for odd chain fatty acid synthesis.
Fig 6. Mass isotopomer distributions of (A) methyl pentadecanoate (C15:0) and (B) methyl palmitate (C16:0) for four parallel labeling experiments with [U-13C]valine, [U-13C]leucine, [U-13C]isoleucine and [U-13C]glutamine tracers.
Quantifying BCAA contribution to fatty acid synthesis
Based on the results described in the previous section, a simplified model for the synthesis of odd chain and even chain fatty acids was constructed (Tables AS and AT inS1 File). Even chain fatty acids, such as palmitic acid (C16:0), were modeled as condensation products of AcCoA units. Potential sources for AcCoA were glutamine, leucine, isoleucine, and others (e.g. glucose). Odd chain fatty acids, such as pentadecanoic acid (C15:0), were modeled as products of the elongation of a single PropCoA moiety with AcCoA units. Sources of AcCoA were the same as for even chain fatty acids, whereas valine and isoleucine contributed to Prop-CoA. Isotopomer spectral analysis (ISA) was applied to determine the fractional contributions (D-values) of the various precursors to AcCoA and PropCoA, as well as fractional new synthe-sis (g-values) of each fatty acid.
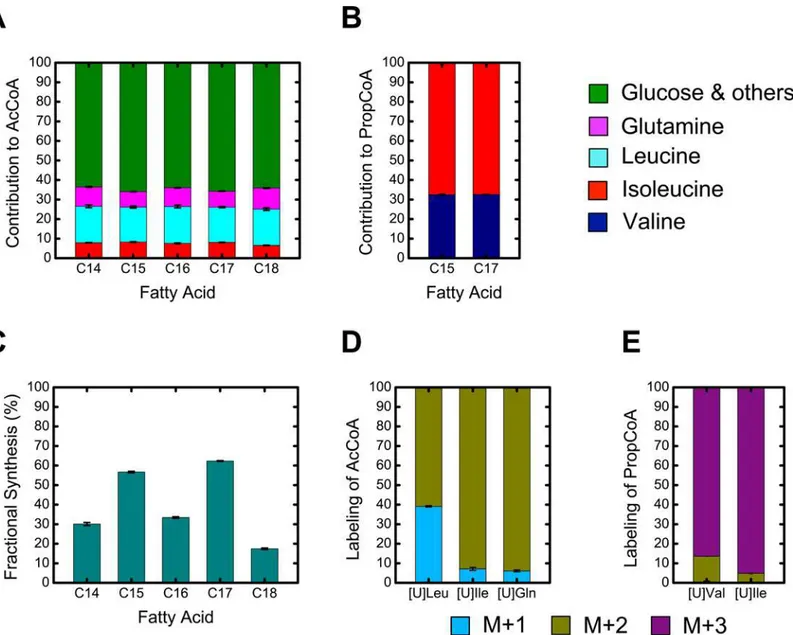
The estimated D-values are shown inFig 9A and 9B. The largest contributor to lipogenic AcCoA was leucine at ~18%, followed by glutamine (~10%) and isoleucine (~7%). The remain-ing contribution to lipogenic AcCoA is predominantly derived from glucose (data not shown). For the odd chain fatty acids, the largest contributor to PropCoA was isoleucine (~67%) with the remaining 33% accounted for by valine (Fig 9B). Since both even and odd chain fatty acids derive their AcCoA units from the same pool, it was encouraging that the D-values estimated for all fatty acids agreed well. Fatty acid g-values are shown inFig 9C. The odd chain fatty acids
Fig 7. GC-MS analysis of fatty acid picolinyl ester derivatives.(A) Chemical structure of fatty acid methyl ester derivatives. (B) Mass spectrum of palmitic acid (C16:0) methyl ester derivative. Intermediate mass fragments cannot be used for positional labeling information as they are not unique fragments. (C) Chemical structure of fatty acid picolinyl ester derivatives. (D) Mass spectrum of palmitic acid (C16:0) picolinyl ester derivative. The dominant fragments in the spectrum are separated by 14 amu corresponding to a unique loss of consecutive CH2groups.
C15:0 and C17:0 saw the greatest fold-increase between days 6 and 7, with ~55% fractional new synthesis, while stearic acid (C18:0) had the smallest increase (~20% fractional new synthesis).
From ISA analysis, we also determined the predicted mass isotopomer labeling of AcCoA and PropCoA pools derived from the various13C-tracers (Fig 9D and 9E). For AcCoA, we determined that [U-13C]isoleucine and [U-13C]glutamine produced AcCoA that was 94% M+2 labeled and 6% M+1 labeled, while [U-13C]leucine produced AcCoA that was 61% M+2 labeled and 39% M+1 labeled. For PropCoA, we determined that [U-13C]isoleucine produced Prop-CoA that was 95% M+3 labeled and 5% M+2 labeled, and [U-13C]valine produced PropCoA that was 87% M+3 labeled and 13% M+2 labeled.
To explain these results, catabolic pathways for BCAA are shown inFig 10. From leucine degradation three molecules of AcCoA are produced, one directly and two from acetoacetate
Fig 8. (A) Fragments of pentadecanoatic acid (C15:0) measured by GC-MS. An asterisk (*) indicates the expected location of13C-labeled carbon atoms from [U-13C]valine. (B) Mass isotopomer distributions for four fragments of C15:0 retaining different parts of the fatty acid carbon backbone (from [U-13C]valine experiment). (C) Mass isotopomer distributions measured for four fragments of C16:0 from [U-13C]valine experiment.
catabolism. An interesting fact of leucine catabolism is that it is first decarboxylated to form isovaleryl-CoA and later carboxylated at a different position. The decarboxylation and subse-quent carboxylation steps will produce incomplete labeling of AcCoA derived from [U-13C] leucine. Assuming that incorporated CO2is completely unlabeled, [U-13C]leucine will produce
AcCoA that is about 67% M+2 and 33% M+1 labeled, which is in good agreement with the ISA modeling results.
Discussion
In this study, we have investigated the connection between branched chain amino acid and fatty acid metabolism in 3T3-L1 adipocytes. Parallel labeling experiments were performed
Fig 9. Isotopomer spectral analysis (ISA) results.(A) Estimated D(AcCoA)-values, fractional contributions to lipogenic acetyl-CoA precursor pool. (B) Estimated D(PropCoA)-values, fractional contributions to lipogenic propionyl-CoA precursor pool. (C) Estimated g(24h)-values, fractional new synthesis of each fatty acid during the 24 hr tracer experiment between days 6 and 7. (D & E) Estimated mass isotopomer labeling (M+1, M+2 and M+3) of AcCoA and PropCoA precursor pools from the various13C-tracers used in this study.
where the DMEM medium was supplemented with additional amino acids consisting of a mix-ture of valine, leucine, isoleucine and glutamine. Of the supplemented amino acids, one was uniformally13C-labeled and the remaining three were unlabeled, i.e. natural13C-abundance. Measured fatty acid labeling data were then used to determine the fractional contributions of BCAA and glutamine to AcCoA and PropCoA precursor pools (D-values), as well as the frac-tion of newly synthesized fatty acids (g-values). First, we demonstrated that 3T3-L1 cells accu-mulated both even and odd chain length fatty acids. Using a novel GC-MS method, we also demonstrated that PropCoA acts as the primer on fatty acid synthase for the production of odd chain fatty acids.
Previously, the contributions of glucose and acetate to palmitic acid synthesis in 3T3-L1 cells were determined [30]. In addition, contributions to fatty acid synthesis in brown adipo-cytes have been investigated for several metabolites, including glucose, glutamine, acetate and acetoacetate [31,43]. In this work, we have determined for the first time the contributions of BCAA to fatty acid synthesis. First, we observed high consumption rates of BCAA by 3T3-L1 cells, where the combined uptake rate of BCAA was 63 nmol/106cells/h, or about 28% that of the glucose uptake rate. We determined that BCAA contributed significantly to lipogenic AcCoA and PropCoA pools. Based on ISA modeling results, we determined that ~25% of lipo-genic AcCoA was derived from leucine and isoleucine. This value was consistent for all mea-sured fatty acids, which included C14:0, C15:0, C16:0, C17:0 and C18:0. Despite the fact that there was no net consumption of glutamine, glutamine still contributed ~10% to AcCoA due to high exchange between medium glutamine and intracellular glutamine. Lipogenic PropCoA was derived solely from isoleucine and valine catabolism. From these results, it is evident that all three BCAA contribute a significant portion to overall lipid synthesis. It is important to note that the BCAA concentrations used in these experiments are several fold greater than observed in plasma and ~2-fold greater than DMEM media. While the concentrations are supra-physio-logical, these experiments do demonstrate the capacity of the 3T3-L1 adipocyte model to catab-olize BCAA and the interconnection between fatty acid and BCAA metabolism.
One important observation from the [U-13C]glutamine experiment was the transience of13 C-labeling in the medium. Initially, glutamine was 100% M+5 labeled; however, at the end of the 24-hour incubation, M+5 labeling was only about 60%. An assumption of ISA modeling is that the precursor pools are at steady state isotopic labeling, i.e. the labeling does not change with time. For the [U-13C]glutamine experiment this assumption is thus not valid. Since external glu-tamine labeling is changing with time, this will have a dynamic effect on the labeling of the result-ing AcCoA pool as well. It is important to note, however, that the steady state assumption was valid for the other13C-tracers used in this study. The observation of non-steady labeling of AcCoA for13C-glutamine highlights one of the limitations of the ISA modeling technique. In light of this observation, it is important to discuss how it may affect the modeling results.
Since [U-13C]glutamine labeling data is non-steady, the corresponding measured mass isoto-pomers will be a time-weighted average labeling and the total amount of13C-labeling incorpo-ration will be less than would be expected if [U-13C]glutamine labeling remained constant throughout the entire experiment. As a result, the g-parameter would be a time-averaged value. The value will be less than determined from [U-13C]leucine and [U-13C]isoleucine experiments. The discrepancy in g-values would not be an issue if modeling [U-13C]glutamine data alone; however, modeling the data with the other tracer experiments could pose a problem.
Fig 10. Pathways for branched chain amino acid catabolism.Valine degradation produces one propionyl-CoA, isoleucine catabolism produces one propionyl-CoA and one acetyl-CoA, and leucine catabolism produces three acetyl-CoA. Colors indicate the carbons which arise in propionyl-CoA (blue), acetyl-CoA (red), and acetoacetate (green).
To gain more insight, consider the case of odd chain fatty acids. In this case, the [U-13C] valine experiments will set a hard constraint on the g-value, since it only contributes to the PropCoA pool and not AcCoA pool. This will cause the g-value to be fixed at the true value, although this value will be greater than would be predicted with [U-13C]glutamine. As a result, there will be too much13C-labeling to explain the [U-13C]glutamine data and in order to com-pensate for this the model will decrease the amount of labeling, e.g. by decreasing the D-value for glutamine. The AcCoA and PropCoA precursor pools are interconnected due to isoleucine contributing to both pools. As a result, errors resulting in D-values for the AcCoA may cause indirect effects on the PropCoA pool (i.e. the low PropCoA contribution of M+2 from [U-13C] isoleucine). Based on this logic, we believe that the D-value estimates for AcCoA are underesti-mates. The glutamine dynamics does not invalidate our findings, but instead of determining the exact contributions, we deem the values to be the lower limits for this system.
An interesting observation of this study was the presence of odd-chain fatty acids in cul-tured adipocytes, which although uncommon can occur in mammalian cells [44]. We demon-strated through the use of two fatty acid derivatization methods that PropCoA serves as a primer on fatty acid synthase. Enzyme-bound PropCoA is then extended by AcCoA polymeri-zation as is the case for even chain fatty acid synthesis. To our knowledge, this is the first time that picolinyl esters have been used for mass isotopomer analysis to elucidate fatty acid pathways.
ISA modeling determined that odd chain fatty acids were primarily synthesized through PropCoA, contrary to publishedα-oxidation hypotheses [45–47] (Table BU inS1 File). Fatty
acidα-oxidation may occur, however, its contribution is minimal compared to PropCoA
elon-gation and can only be detected with sensitive, radioisotope assays [45]. The odd chain fatty acids accumulated at a greater relative rate than their even chain counterparts over the course of the tracer experiments. We believe that odd chain fatty acid accumulation occurs in part due to low activity of vitamin B12-dependent methylmalonyl-CoA mutase, which prevents
Prop-CoA from entering into the TCA cycle. From [U-13C]valine experiments, we saw negligible labeling incorporation into TCA cycle intermediates (Table L inS1 File), supporting this claim; however when we added [U-13C]propionate and vitamin B12to the media as supplements, 13C-labeling was seen in TCA cycle metabolites (Table N inS1 File). However, B
12
supplemen-tation did not completely ameliorate odd chain fatty acid synthesis, indicating that PropCoA derived from valine and isoleucine degradation may enforce mass-action effects on fatty acid synthase. This observation is in alignment with clinical observations of inherited diseases of propionate metabolism. In these disorders, propionate and byproducts of BCAA metabolism cannot assimilate into the TCA cycle and elevated levels of odd-chain fatty acids are commonly observedin vivo[48,49].
Conclusions
Supporting Information
S1 File. Supporting information.Cell culture data, mass spectrometry data and modeling results.
(DOCX)
Acknowledgments
The authors thank Joanne K. Kelleher for many valuable discussions.
Author Contributions
Conceived and designed the experiments: SBC NM MRA. Performed the experiments: SBC NM. Analyzed the data: SBC MRA. Contributed reagents/materials/analysis tools: MRA. Wrote the paper: SBC MRA.
References
1. Layman DK. The role of leucine in weight loss diets and glucose homeostasis. J Nutr. 2003; 133:261S–267S. PMID:12514305
2. Wahren J, Felig P, Hagenfeldt L. Effect of protein ingestion on splanchnic and leg metabolism in normal man and in patients with diabetes mellitus. J Clin Invest. 1976; 57:987–999. PMID:947963
3. Suryawan A, Hawes JW, Harris RA, Shimomura Y, Jenkins AE, Hutson SM. A molecular model of human branched-chain amino acid metabolism. Am J Clin Nutr. 1998; 68:72–81. PMID:9665099 4. Cota D, Proulx K, Smith KA, Kozma SC, Thomas G, Woods SC, et al. Hypothalamic mTOR signaling
regulates food intake. Science. 2006; 312:927–930. PMID:16690869
5. Hay N, Sonenberg N. Upstream and downstream of mTOR. Genes Dev. 2004; 18:1926–1945. PMID: 15314020
6. Newgard CB, An J, Bain JR, Muehlbauer MJ, Stevens RD, Lien LF, et al. A branched-chain amino acid-related metabolic signature that differentiates obese and lean humans and contributes to insulin resis-tance. Cell Metab. 2009; 9:311–326. doi:10.1016/j.cmet.2009.02.002PMID:19356713
7. Huffman KM, Shah SH, Stevens RD, Bain JR, Muehlbauer M, Slentz CA, et al. Relationships between circulating metabolic intermediates and insulin action in overweight to obese, inactive men and women. Diabetes Care. 2009; 32:1678–1683. doi:10.2337/dc08-2075PMID:19502541
8. Shah SH, Crosslin DR, Haynes CS, Nelson S, Turer CB, Stevens RD, et al. Branched-chain amino acid levels are associated with improvement in insulin resistance with weight loss. Diabetologia. 2012; 55:321–330. doi:10.1007/s00125-011-2356-5PMID:22065088
9. Fiehn O, Garvey WT, Newman JW, Lok KH, Hoppel CL, Adams SH. Plasma metabolomic profiles reflective of glucose homeostasis in non-diabetic and type 2 diabetic obese African-American women. PLoS One. 2010; 5:e15234. doi:10.1371/journal.pone.0015234PMID:21170321
10. Wang TJ, Larson MG, Vasan RS, Cheng S, Rhee EP, McCabe E, et al. Metabolite profiles and the risk of developing diabetes. Nat Med. 2011; 17:448–453. doi:10.1038/nm.2307PMID:21423183 11. Laferrere B, Reilly D, Arias S, Swerdlow N, Gorroochurn P, Bawa B, et al. Differential metabolic impact
of gastric bypass surgery versus dietary intervention in obese diabetic subjects despite identical weight loss. Sci Transl Med. 2011; 3:80re82.
12. Clifton P. Diabetes: treatment of type 2 diabetes mellitus with bariatric surgery. Nat Rev Endocrinol. 2010; 6:191–193. doi:10.1038/nrendo.2010.23PMID:20336164
13. Muoio DM, Newgard CB. Obesity-related derangements in metabolic regulation. Annu Rev Biochem. 2006; 75:367–401. PMID:16756496
14. Ouchi N, Parker JL, Lugus JJ, Walsh K. Adipokines in inflammation and metabolic disease. Nat Rev Immunol. 2011; 11:85–97. doi:10.1038/nri2921PMID:21252989
15. Herman MA, She P, Peroni OD, Lynch CJ, Kahn BB. Adipose tissue branched chain amino acid (BCAA) metabolism modulates circulating BCAA levels. J Biol Chem. 2010; 285:11348–11356. doi: 10.1074/jbc.M109.075184PMID:20093359
17. Pietilainen KH, Naukkarinen J, Rissanen A, Saharinen J, Ellonen P, Keranen H, et al. Global transcript profiles of fat in monozygotic twins discordant for BMI: pathways behind acquired obesity. PLoS Med. 2008; 5:e51. doi:10.1371/journal.pmed.0050051PMID:18336063
18. Newgard CB. Interplay between lipids and branched-chain amino acids in development of insulin resis-tance. Cell Metab. 2012; 15:606–614. doi:10.1016/j.cmet.2012.01.024PMID:22560213
19. Frerman FE, Sabran JL, Taylor JL, Grossberg SE. Leucine catabolism during the differentiation of 3T3-L1 cells. Expression of a mitochondrial enzyme system. J Biol Chem. 1983; 258:7087–7093. PMID: 6304077
20. Chuang DT, Hu CW, Patel MS. Induction of the branched-chain 2-oxo acid dehydrogenase complex in 3T3-L1 adipocytes during differentiation. Biochem J. 1983; 214:177–181. PMID:6615463
21. Kedishvili NY, Popov KM, Jaskiewicz JA, Harris RA. Coordinated expression of valine catabolic enzymes during adipogenesis: analysis of activity, mRNA, protein levels, and metabolic consequences. Arch Biochem Biophys. 1994; 315:317–322. PMID:7527207
22. Lackey DE, Lynch CJ, Olson KC, Mostaedi R, Ali M, Smith WH, et al. Regulation of adipose branched chain amino acid catabolism enzyme expression and cross-adipose amino acid flux in human obesity. Am J Physiol Endocrinol Metab. 2013.
23. Long CP, Antoniewicz MR. Quantifying biomass composition by gas chromatography/mass spectrome-try. Anal Chem. 2014; 86:9423–9427. doi:10.1021/ac502734ePMID:25208224
24. Antoniewicz MR, Kelleher JK, Stephanopoulos G. Accurate assessment of amino acid mass isotopo-mer distributions for metabolic flux analysis. Anal Chem. 2007; 79:7554–7559. PMID:17822305 25. Fernandez CA, Des Rosiers C, Previs SF, David F, Brunengraber H. Correction of 13C mass
isotopo-mer distributions for natural stable isotope abundance. J Mass Spectrom. 1996; 31:255–262. PMID: 8799277
26. Ahn WS, Antoniewicz MR. Metabolic flux analysis of CHO cells at growth and non-growth phases using isotopic tracers and mass spectrometry. Metab Eng. 2011; 13:598–609. doi:10.1016/j.ymben.2011. 07.002PMID:21821143
27. Destaillats F, Angers P. One-step methodology for the synthesis of FA picolinyl esters from intact lipids. JAOCS. 2002; 79:253–256.
28. Yang S, Minkler P, Hoppel C, Tserng KY. Picolinyl ester fragmentation mechanism studies with applica-tion to the identificaapplica-tion of acylcarnitine acyl groups following transesterificaapplica-tion. J Am Soc Mass Spec-trom. 2006; 17:1620–1628. PMID:16904336
29. Ahn WS, Antoniewicz MR. Parallel labeling experiments with [1,2-13C]glucose and [U-13C]glutamine provide new insights into CHO cell metabolism. Metab Eng. 2013; 15:34–47. doi:10.1016/j.ymben. 2012.10.001PMID:23111062
30. Kharroubi AT, Masterson TM, Aldaghlas TA, Kennedy KA, Kelleher JK. Isotopomer spectral analysis of triglyceride fatty acid synthesis in 3T3-L1 cells. Am J Physiol. 1992; 263:E667–675. PMID:1415685 31. Yoo H, Antoniewicz MR, Stephanopoulos G, Kelleher JK. Quantifying reductive carboxylation flux of glutamine to lipid in a brown adipocyte cell line. J Biol Chem. 2008; 283:20621–20627. doi:10.1074/ jbc.M706494200PMID:18364355
32. Antoniewicz MR, Kelleher JK, Stephanopoulos G. Elementary metabolite units (EMU): a novel frame-work for modeling isotopic distributions. Metab Eng. 2007; 9:68–86. PMID:17088092
33. Crown SB, Antoniewicz MR. Publishing 13C metabolic flux analysis studies: a review and future per-spectives. Metab Eng. 2013; 20:42–48. doi:10.1016/j.ymben.2013.08.005PMID:24025367 34. Au J, Choi J, Jones SW, Venkataramanan KP, Antoniewicz MR. Parallel labeling experiments validate
Clostridium acetobutylicum metabolic network model for 13C metabolic flux analysis. Metab Eng. 2014; 26:23–33. doi:10.1016/j.ymben.2014.08.002PMID:25183671
35. Leighty RW, Antoniewicz MR. COMPLETE-MFA: complementary parallel labeling experiments tech-nique for metabolic flux analysis. Metab Eng. 2013; 20:49–55. doi:10.1016/j.ymben.2013.08.006 PMID:24021936
36. Crown SB, Long CP, Antoniewicz MR. Integrated 13C-metabolic flux analysis of 14 parallel labeling experiments in Escherichia coli. Metab Eng. 2015; 28:151–158. doi:10.1016/j.ymben.2015.01.001 PMID:25596508
37. Antoniewicz MR, Kelleher JK, Stephanopoulos G. Determination of confidence intervals of metabolic fluxes estimated from stable isotope measurements. Metab Eng. 2006; 8:324–337. PMID:16631402 38. Antoniewicz MR. Methods and advances in metabolic flux analysis: a mini-review. J Ind Microbiol
39. Simicevic J, Schmid AW, Gilardoni PA, Zoller B, Raghav SK, Krier I, et al. Absolute quantification of transcription factors during cellular differentiation using multiplexed targeted proteomics. Nat Methods. 2013.
40. Kajimoto K, Naraba H, Iwai N. MicroRNA and 3T3-L1 pre-adipocyte differentiation. RNA. 2006; 12:1626–1632. PMID:16870994
41. Wang GL, Shi X, Salisbury E, Sun Y, Albrecht JH, Smith RG, et al. Cyclin D3 maintains growth-inhibi-tory activity of C/EBPalpha by stabilizing C/EBPalpha-cdk2 and C/EBPalpha-Brm complexes. Mol Cell Biol. 2006; 26:2570–2582. PMID:16537903
42. Ahn WS, Antoniewicz MR. Towards dynamic metabolic flux analysis in CHO cell cultures. Biotechnol J. 2012; 7:61–74. doi:10.1002/biot.201100052PMID:22102428
43. Yoo H, Stephanopoulos G, Kelleher JK. Quantifying carbon sources for de novo lipogenesis in wild-type and IRS-1 knockout brown adipocytes. J Lipid Res. 2004; 45:1324–1332. PMID:15102881 44. Masoro EJ, Porter E. Propionic acid as a precursor in the biosynthesis of animal fatty acids. J Lipid
Res. 1961; 2:177–181. PMID:13767834
45. Su X, Han X, Yang J, Mancuso DJ, Chen J, Bickel PE, et al. Sequential ordered fatty acid alpha oxida-tion and Delta9 desaturaoxida-tion are major determinants of lipid storage and utilizaoxida-tion in differentiating adi-pocytes. Biochemistry. 2004; 43:5033–5044. PMID:15109262
46. Roberts LD, Virtue S, Vidal-Puig A, Nicholls AW, Griffin JL. Metabolic phenotyping of a model of adipo-cyte differentiation. Physiol Genomics. 2009; 39:109–119. doi:10.1152/physiolgenomics.90365.2008 PMID:19602617
47. Guo L, Zhou D, Pryse KM, Okunade AL, Su X. Fatty acid 2-hydroxylase mediates diffusional mobility of Raft-associated lipids, GLUT4 level, and lipogenesis in 3T3-L1 adipocytes. J Biol Chem. 2010; 285:25438–25447. doi:10.1074/jbc.M110.119933PMID:20519515
48. Decsi T, Sperl W, Koletzko B. Essential fatty acids in clinically stable children with propionic acidaemia. J Inherit Metab Dis. 1997; 20:778–782. PMID:9427145
49. Coker M, Duran M, De Klerk JB, Kleijer WJ, Jakobs C, Huijmans JG. Amniotic fluid odd-chain fatty acids are increased in propionic acidaemia. Prenat Diagn. 1996; 16:941–944. PMID:8938066 50. Crown SB, Antoniewicz MR. Parallel labeling experiments and metabolic flux analysis: Past, present
and future methodologies. Metab Eng. 2013; 16:21–32. doi:10.1016/j.ymben.2012.11.010PMID: 23246523


![Fig 6. Mass isotopomer distributions of (A) methyl pentadecanoate (C15:0) and (B) methyl palmitate (C16:0) for four parallel labeling experiments with [U- 13 C]valine, [U- 13 C]leucine, [U- 13 C]isoleucine and [U- 13 C]glutamine tracers.](https://thumb-eu.123doks.com/thumbv2/123dok_br/16443899.196989/13.918.77.866.125.628/isotopomer-distributions-pentadecanoate-palmitate-parallel-experiments-isoleucine-glutamine.webp)

![Fig 8. (A) Fragments of pentadecanoatic acid (C15:0) measured by GC-MS. An asterisk (*) indicates the expected location of 13 C-labeled carbon atoms from [U- 13 C]valine](https://thumb-eu.123doks.com/thumbv2/123dok_br/16443899.196989/15.918.94.865.135.746/fragments-pentadecanoatic-measured-asterisk-indicates-expected-location-labeled.webp)