Annals of “Dunarea de Jos” University of Galati Fascicle I. Economics and Applied Informatics
Years XIX – no3/2013 ISSN-L 1584-0409 ISSN-Online 2344-441X
www.ann.ugal.ro/eco www.eia.feaa.ugal.ro
Developed Model for Debts Relief Decision Based on
Financial and Accounting Reports Applied on PORT
TRANS EUROPE SA
Riana Iren RADU, Violeta ISAI
A R T I C L E I N F O A B S T R A C T
Article history:
September
Available online December
JEL Classification
M , M
Keywords:
Management, Debts, Model, Decision, Strategy
Business agents are today facing with a dynamic economic environment transformed by the direct effects of the economic crisis. )n these circumstances the managers of the entities are forced to adapt to the economic activities by various types of decisions. A special attention is paid to financial decisions. Financial issues touch all aspects of economic life of an agent. )n this context are fitting the management of debts. Management of debts problem can be addressed through a decision-making model. )n this paper we propose the development of a multidimensional decision to be strengthened the management of debts of PORT TRANS EUROPE SA, in order to reduce them.
© EA). All rights reserved.
1. Introduction
)nformation base source for decision making is in the past, and proper evaluation and comparison of variants targeting horizon decision that relate to future consequences will be obtained in the future.
Methods and models used are extremely varied due to the variety of decision situations. Decision making methods are different, having regarded to:
(ow important are the issues addressed, the result of the consequences of decisions to be approved;
Certainty of information that can be used, the factors that can influence;
(ow big is the decision horizon;
The decision criteria and their number;
Decision problem and its reflection in the company.
For each decision problem has to be developed a model that should contain data accuracy assessments and grounding methods.
2. Dimensionality in decision process
To evaluate the action lines are considered one or more decision criteria. One decision criterion can be used for decision making when the criterion considers an important objective of the company.
Regarding managerial decisions, you can use unique objectives such as increased turnover, profit growth, increased financial liquidity, reduce costs of production. These criteria have different meanings in terms of how speech can be relative or absolute values. On the horizon decision on criteria results can talk short, medium or long term. Decision problems are multidimensional, with multiple plans consequences, but in practice most of them are one-dimensional. Thus, implementation of decisions appear serious consequences on the organization, which means that the previous decision may be revoked or be major corrections. For multidimensional decision making must be addressed estimate the relative importance of decision criteria. Reflecting the degree to which managers want to make the decision criteria is given by the coefficients of importance. To do this, you can use different ways that can be both direct estimate of the coefficients of importance of decision criteria based on subjective assessments, or their calculation through a comparison. When evaluating coefficients kj by the comparison criteria for a number of people, you can use the formula:
∑∑
∑
=
j i ij i
ij
j
N
N
k
where:
, Faculty of Economics and Business Administration, Dunarea de Jos University of Galati, Romania. E-mail addresses: raduriana@yahoo.com R. ). Radu , violeta.isai@yahoo.com V.
34
i =
i
=
1
,
R
– is the number of the person making the hierarchy of decision criteriaxi; Nij – is the score awarded to the person "i" criterion xj
Comparison results are shown in a matrix D, where the elements if xi is more important than xj xi> xj , then D)J = ;
if xi <xj, then D)J = ;
if xi ~ xj have the same importance, the two criteria will be represented in matrix D by a single line and
column;
criteria themselves dominate, so xi> xj and dii = .
3. Develop decision-making model
Proposed decision model provides a framework for identifying the best methods of management company debt.
Description of the model
)n making a decision to reduce debt, decision style and level of participation required of the group are influenced by three important factors:
Quality of decision: how important is finding the right solution? As required quality is much higher
opinion should be requested several persons.
)nvolvement: how important it is to support other decision? The more necessary with the approval of
others should be involved more people.
Time available: while it is available for decision making? As more time is even more people would be
involved.
Model is recommended to be used in economic crisis or development of financial pressure on the company to more quickly identify what must be done.
Table . Submission criteria
The decision criteria Departments participate in decision making X1 Level amount in trade payables P Financial departament
X2 Level of trade receivables P Juridic departament
X3 Stock value P (uman resource departament
X4 Level amount of financial liabilities P Supply compartment
X5 Level amount of social debt P Marketing department sales X6 Liquidity level inv t.s. + banks P Accounting department
X7 Distribution of profit P )nvestment compartiment
X8 Cash flow P Management department
X9 Net profit X10 Turnover
X11 Working capital requirement X12 Value of fixed assets
Source: Elaborated by the author
To determine which of these ways are most recommended for debt relief is necessary to answer some
questions in the affirmative, negative and then build a decision-making scheme.
There are five questions:
. Debts have reached maturity? . There are funds for payment? . Cover claims receivable amount of debt? . Can renegotiate payment terms? . What are the methods that can be performed to obtain funding?
Relations between hierarchical decision criteria for each department directly involved in
decision-making are:
Table . Ordering criteria
p1 p2 p3 p4 p5 p6 p7 p8
x x x x x x x x
x x x x x x x x
x x x x x x x x
x x x x x x x x
x x x x x x x x
x x x x x x x x
x x x x x x x x
x x x x x x x x
x x x x x x x x
x x x x x x x x
x x x x x x x x
Order by degree of importance
(descending)
x x x x x x x x
35
The table above shows that departments that participate in the decision making process p - Financial compartment, p - legal department, p - (R department, p - supply compartment, p - marketing department sales , p - accounting department, p - investment compartment, p - management department only influence the decision of some criteria. This conclusion is drawn from the analysis of flow chart. Thus, the criteria are distinct relational belonging to each department.
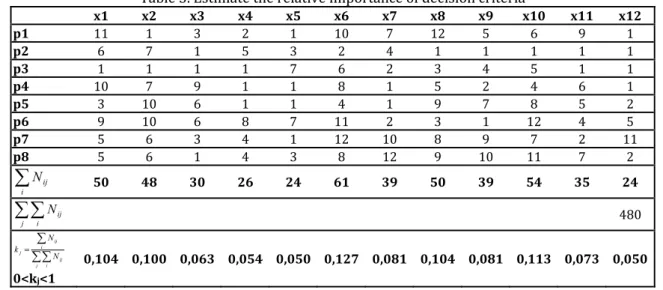
After calculating the D matrix and significance of the kj coefficients, we obtain the following data:
Table . Estimate the relative importance of decision criteria
x1 x2 x3 x4 x5 x6 x7 x8 x9 x10 x11 x12
p1 p2 p3 p4 p5 p6 p7 p8
∑
i ij
N 50 48 30 26 24 61 39 50 39 54 35 24
∑∑
j i
ij
N
∑∑ ∑
=
j i ij i
ij j
N N k
0<kj<1
0,104 0,100 0,063 0,054 0,050 0,127 0,081 0,104 0,081 0,113 0,073 0,050
Source: Elaborated by the author
Estimate the relative importance of decision criteria, showed that in order score the most important criteria is: x - the liquidity short-term investments and banks x – turnover, x - cash flow, x - level
amount in trade payables.
For S.A. PORT TRANS EUROPE the period - have the following values for the selection
criteria:
Table . Assigning value to criteria RON
Current prices indicators 2006 2007 2008 2009 2010 2011
x1 Level amount in trade payables . . . .
x2 Level of trade receivables . . . .
x3 Stock value . . . .
x4 Level amount of financial
liabilities . . . .
x5 Level amount of social debt . . . .
x6 Liquidity level inv t.s. + banks . . . .
x7 Distribution of profit . . . .
x8 Cash flow . . . .
x9 Net profit . . . .
x10 Turnover . . . .
x11 Working capital requirement . . . .
x12 Value of fixed assets . . . .
xb Total debts 30.852.573 76.963.948 74.760.446 69.003.577 64.112.532 61.393.604
Source: Elaborated by the author
Analyzing the data in Table the following conclusions:
Turnover increased in compared to , with Ron , , and net profit increased
compared with the same period was Ron , , . Although in , as compared to , turnover
increased by Ron , , , net profit in the same period decreased by Ron , , this led to an
increase in expenses.
Liquidity level in compared to decreased by Ron , , as a result of payment of the
36
Turnover growth in than in , Ron , , was overshadowed by higher costs leading to lower
net income in compared to , with , , lei.
The analysis of the indicators most profitable year was , before the manifestation of the
economic crisis in Romania, when turnover was Ron , , and profit was Ron , , and the trade
receivables was lower in compared to , with , , lei. The only unfavorable situation is
encountered in the debt, especially financial liabilities which led to a decrease in cash balance.
)n the period - operating needs could be met from surplus stable resources on stable
resources. Analyzing the claims and the liquidity in the period - , we find that they do not cover the
total debt due to higher financial debt. This situation was improved in when the debt fell Ron , ,
and the debt and liquidity increased by Ron , , . Future be avoided completely cover operational need
of stable resources. Long-term debt is to be contracted only to cover depreciable assets because the only way the operator can ensure development. Stable resource use surplus for investment, not for current needs.
The weighting coefficients kj values with estimated values obtained dynamics of debt indicators
during - :
Table . Determining the estimated indicator "Debts" on the decision model RON
2006 2007 2008 2009 2010 2011
Debts . . . .
Estimated debts . . . .
Source: Elaborated by the author
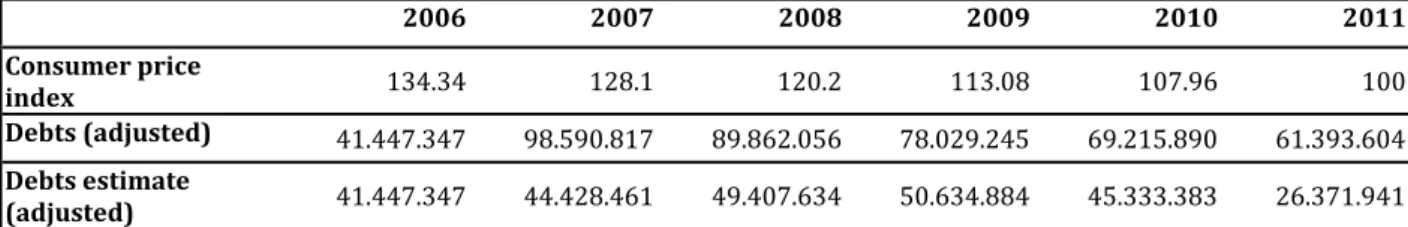
There is a much decelerated trend estimate for debt indicator, deceleration caused by the effect of making the indicator model implementation. )n order to eliminate the influence of inflationary event was done to adjust the values of the consumer price index, adjusted values are shown in the table below:
Table . Value adjustments in consumer price index
2006 2007 2008 2009 2010 2011
Consumer price
index . . . . .
Debts (adjusted) . . . . . . . . . . . .
Debts estimate
(adjusted) . . . .
Source: Elaborated by the author
)f adjustment with CP) values, it is observed a tendency for equalization of values, correlation coefficients decreased from - . to - .
4. Conclusions
Developing the model for debt relief decision based on information gathered from financial statements is useful for the managers of the companies affected by the economic, and it can offer a solution to limit their impact on the evolution of the business activities of the company concerned. Model proved reliable in terms of financial and economic analysis, managing to highlight the role of each resource involved in management processes.
Financial resources at a time can be limited by several external factors enterprise, but efficient management and a coherent process of debt relief can be a rigorous basis for future economic development of society.
References
1. Negoescu, G., (2011), Are you ready to win 72.000 lei on month?, Universitaria Publishing, Craiova, 2nd edition, Craiova 2. Negoescu, G., (1995), Risk and uncertainty in today's economy, Alter Ego Publishing, Galaţi
3. Negoescu, G., Mihalcea, L., Ştefănescu, R. and Radu, R., (1998), Costs and prices, Algorithm + Publishing, Galaţi, ISBN 973-98803-3-9 4. Nica, P., Iftimescu, A., (2008), Management. Concepts and Applications, Sedcom Libris, Iasi