Satellite Based Assessment of Hydroclimatic
Conditions Related to Cholera in Zimbabwe
Antarpreet Jutla1*, Haidar Aldaach1, Hannah Billian1, Ali Akanda2, Anwar Huq3, Rita Colwell3,4,5*
1Department of Civil and Environmental Engineering, West Virginia University, Morgantown, WV, United States of America,2Department of Civil and Environmental Engineering, University of Rhode Island, Kingston, RI, United States of America,3Maryland Pathogen Research Institute, University of Maryland, College Park, MD, United States of America,4Centre for Bioinformatics and Computational Biology, University of Maryland, College Park, Maryland, United States of America,5Bloomberg School of Public Health, Johns Hopkins University, Baltimore, Maryland, United States of America
*asjutla@mail.wvu.edu(AJ);rcolwell@mail.wvu.edu(RC)
Abstract
Introduction
Cholera, an infectious diarrheal disease, has been shown to be associated with large scale hydroclimatic processes. The sudden and sporadic occurrence of epidemic cholera is linked with high mortality rates, in part, due to uncertainty in timing and location of out-breaks. Improved understanding of the relationship between pathogenic abundance and cli-matic processes allows prediction of disease outbreak to be an achievable goal. In this study, we show association of large scale hydroclimatic processes with the cholera epi-demic in Zimbabwe reported to have begun in Chitungwiza, a city in Mashonaland East province, in August, 2008.
Principal Findings
Climatic factors in the region were found to be associated with triggering cholera outbreak and are shown to be related to anomalies of temperature and precipitation, validating the hypothesis that poor conditions of sanitation, coupled with elevated temperatures, and fol-lowed by heavy rainfall can initiate outbreaks of cholera. Spatial estimation by satellite of pre-cipitation and global gridded air temperature captured sensitivities in hydroclimatic conditions that permitted identification of the location in the region where the disease outbreak began.
Discussion
Satellite derived hydroclimatic processes can be used to capture environmental conditions related to epidemic cholera, as occurred in Zimbabwe, thereby providing an early warning system. Since cholera cannot be eradicated because the causative agent,Vibrio cholerae,
is autochthonous to the aquatic environment, prediction of conditions favorable for its growth and estimation of risks of triggering the disease in a given population can be used to alert responders, potentially decreasing infection and saving lives.
a11111
OPEN ACCESS
Citation:Jutla A, Aldaach H, Billian H, Akanda A, Huq A, Colwell R (2015) Satellite Based Assessment of Hydroclimatic Conditions Related to Cholera in Zimbabwe. PLoS ONE 10(9): e0137828. doi:10.1371/ journal.pone.0137828
Editor:Guy J-P. Schumann, University California Los Angeles, UNITED STATES
Received:January 27, 2015
Accepted:August 22, 2015
Published:September 29, 2015
Copyright:© 2015 Jutla et al. This is an open access article distributed under the terms of the Creative Commons Attribution License, which permits unrestricted use, distribution, and reproduction in any medium, provided the original author and source are credited.
Data Availability Statement:All relevant data are within the paper and its Supporting Information files.
Funding:This research is funded in part from a NASA grant (NNX15AF71G) and WV NASA space grant.
Introduction
Cholera, a life-threatening diarrheal disease, has been shown to be transmitted by drinking water contaminated with the causative agent,Vibrio cholerae, and the disease remains a global public health threat. Recent studies have established that cholera occurs in three forms: epi-demic (a sudden outbreak in a previously relatively disease-free region and primarily inland), endemic (recurring essentially annually and predominantly along coastal regions) [1], and mixed-mode (a combination of epidemic and endemic disease occurrence). Epidemic and endemic cholera show significantly different mortality rates, with epidemic cholera having higher mortality, over 6% in some cases. The mortality rates reported for recent epidemics include Haiti 6.4% in 2010, Madagascar 6% in 2000, Zimbabwe 4.3% in 2008–09, and Nigeria 3.8% in 2010 [2]. Current methods are effective in treating cholera, e.g., oral rehydration, intra-venous saline solution, and vaccines; but providing safe water access remains the most effective method to prevent outbreaks.V.choleraeexists naturally in the aquatic environment. Hence growth of the bacterium is strongly influenced by environmental conditions. Furthermore,V.
choleraeis reemerging in many areas in the form of newly virulent serotypes, such asV. cho-lerae0139, complicating traditional treatments. Because it is not realistic or feasible to consider eradication of the pathogen from the aquatic environment, a fundamentally transformational approach is needed to design mitigation strategies to protect against the disease. If prediction of a probable cholera epidemic using large scale hydroclimatic data is possible, appropriate resources and treatment can be dedicated to a given location in advance.
The majority of cholera research over the last several decades has focused on endemic chol-era regions, primarily Bangladesh, where temporal disease surveillance data have been accumu-lated. Research onV.cholerae, the agent itself, also is extensive, both on its micro-environment (biological processes associated with the bacteria) and macro-environment (large scale hydro-logical, ecohydro-logical, and climatological processes related to outbreaks of the disease). Both sets of information are crucial to understand how the disease is triggered in a specific geographic region and how it can spread in that population.
variables [8]. Other studies, although not predictive in design, linked climatic variables, e.g., precipitation, temperature, and humidity, to outbreaks of cholera, based on historical data [9–
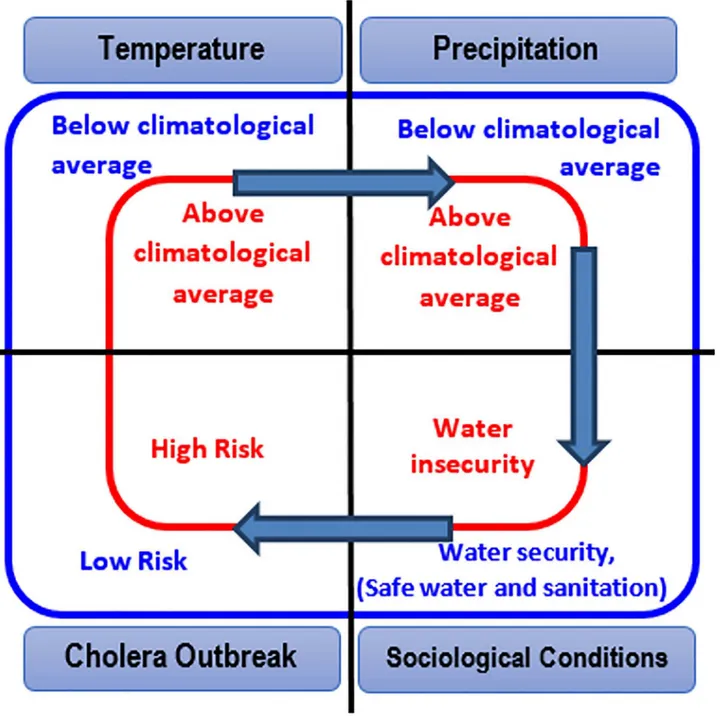
11]. Most of the studies were strictly correlational, lacking a physical hypothesis with respect to cholera and large scale geophysical variables. Relevant is an observation made in a review [12], where it was qualitatively concluded that precipitation may be a key variable for understanding modalities of seasonal variability in the occurrence of disease in human populations. Recently, a hypothesis was proposed by Jutla et al., [1] concerning large scale hydroclimatic control of cholera outbreaks occurring inland away from the coasts and in epidemic form, concluding that elevated temperatures create environmental conditions favorable for growth of the cholera bacteria. When followed by above average rainfall and appropriate transmission mechanisms (i.e. ineffective or catastrophic destruction of sanitation infrastructure resulting in open flow of domestic wastewater), a cholera epidemic can be expected [1]. The hypothesis was developed from historical data on cholera in South Asia.
The first cases of cholera in Zimbabwe were reported to the World Health Organization in August, 2008 [13]. Between August, 2008, and June, 2009, a total of 98,522 cholera cases and 4,282 deaths were reported [14]. The case fatality ratio (CFR), i.e., the ratio of deaths to total cases reported, peaked in January, 2009 [14]. CFRs for the entire Zimbabwe epidemic were much higher than in those areas of the country where appropriate treatment was available, being highest in the rural areas of Zimbabwe, away from the treatment centers [14]. Based on the information available, the cholera outbreak originated in Chitungwiza, a subsection of the capital city of Harare, in the province of Mashonaland East [15]. There are no published results documenting the role of environmental factors associated with cholera outbreaks in Zimbabwe. Large-scale hydroclimatic processes can be estimated using remote sensing and linked with epidemiological data to assess risk of disease occurrence [16]. These technologies provide mea-surements for geophysical variables at varying spatial and temporal scales [17]. Employing the epidemic cholera hypothesis, we established the objective of this study to underscore sensitivity in satellite derived precipitation and air temperature data and to determine their association with timing and spatial variability of disease outbreaks in Zimbabwe, thereby establishing hydroclimatic predictability of the occurrence of cholera.
Materials and Methods
Epidemiological data
The climate of Zimbabwe, located in sub-Saharan Africa, is tropical and its rainy season occurs from October through March. Cholera data for Zimbabwe were obtained from the Zimbabwe Ministry of Health and Child Welfare (weekly scales from November 13, 2008 to July 31, 2009), for the Mashonaland East region (details of the data are available from Mukandavire et al. [20]). Historical hydroclimatological data for the Indus River basin were assembled by collecting and processing historical climatological data in the annual reports of the
Meteorological Reporter to the Government of India, covering1875 to 1900. Cholera mortality data for the Indus River basin were obtained from statistical statements appended to the Annual Reports of the Sanitary Commissioner to the Government of Punjab, 1875–1900 (Jutla et al. [1]).
Climate data
Daily precipitation data collected by satellite (Tropical Rainfall Measuring Mission (TRMM) included monthly data product 3B43 at 0.25x0.25 degree resolution) obtained for 1998 to 2013. Air temperature data were obtained from the Global Historical Climatology Network version 2 Climate Anomaly Monitoring System (GCHN CAMS-0.5x0.5 degree resolution) for the same time period(bounding coordinates 15°S to 23°S latitude and 25°E to 33.5°E longitude). Precipi-tation and air temperature were linked with the cholera epidemics that occurred during the time period of this study.
Spatial data analysis
The study was designed to determine hydroclimatic conditions triggering the 2008 cholera out-break in Zimbabwe. To apply the epidemic cholera hypothesis of Jutla et al. [1], calculation of monthly anomalies (subtraction of month value from the average of 15 years of monthly data) for precipitation and temperature was done. These were calculated for each pixel in both data-sets, e.g., daily precipitation data obtained from TRMM sensors were converted to monthly scales for fourteen years for all pixels covering Zimbabwe. An average for 15 years was calcu-lated and then subtracted from each month, resulting in a positive or negative value (thereafter referred to as anomaly). A positive anomaly implied that month received greater precipitation from average over the given pixel in a fifteen year period. An additional step of analysis was determination of percent deviation each month from the average for that month, using the fol-lowing equation:
Deviationmonth;yearð%Þ ¼
Month value Precipitation=Temperature Average value Precipitation=Temperature Average value Precipitation=Temperature
" #
100
For example,% Deviationfor July, 2008 was calculated by subtracting precipitation during the month from the 15 year average precipitation for July and dividing by the 15 year average precipitation for July. Air temperature data were similarly processed, with the exception that monthly temperature data were employed. Student t-test (two tail) was used to determine if a probability value of less than 0.05 (95% confidence level) rejected the null hypothesis of zero. In order to overcome limitation of data availability, analysis of recent outbreaks of cholera in five other parts of Africa was done.Table 1provides a summary for the five regions, including months in which cholera outbreaks [21–31] had been reported.
Logistical regression analysis
Goodness of fit using Goodman-Kruskal Gamma is a non-parametric rank correlation and ranges between -1 to 1 with 1, representing perfect association.
Mechanistic disease model
Since epidemic cholera is sporadic by definition [1], therefore the long-term time series was not available for Zimbabwe. A mechanistic population based compartmental model, Suscepti-ble-Exposed-Infected-Recovered (SEIR), was developed to analyze and supplement the empiri-cal observations. Details of model development (Fig A and Table A inS1 File), calibration and parameters (Table B inS1 File) are appended in the supplementary information (S1 File).
Results and Discussion
Spatial data analysis for Zimbabwe
The cholera outbreak in Zimbabwe began in Chitungwiza, a city in the Mashonaland East province in August, 2008. Hydroclimatic processes for the months of June through August are critical, since departure from normal for the Mashonaland East province can provide condi-tions favorable for growth of cholera bacteria in the aquatic environment. It must be noted that the precise location of the region of a disease outbreak cannot be determined because of limita-tions in the resolution of satellite data. However, provincial analysis (average of all pixels in a particular province) showed air temperature in Mashonaland (East and Central), as well as in Manicaland, were ca. 2.0 to 12.0% higher than average (Fig 2). If anomalous temperatures in a region are followed by heavy precipitation, the risk of a cholera outbreak increases.Fig 3shows precipitation in Mashonaland East had a positive anomaly during the month of July, 2008, whereas the rest of Zimbabwe experienced less than normal precipitation during July and August, 2008. Precipitation was lower than the climatic average, based on the data available for two months before the outbreak, except in the province of Mashonaland East, where rainfall was ca. 25% higher than average. Results are not shown, but data for the preceding months indicate it was also below the 15-year average. Elevated temperature, followed by heavy precipi-tation have been found to be indicators of conditions optimum for cholera, notably where the drinking water source and sanitation infrastructure are poorly maintained or unavailable. Table 1. Recent cholera epidemics in the African continent.
Country Region(Case Fatality Ratio) Outbreak Month Coordinates for data
Tproba(Two month lead)
Pprobb(One month lead)
Societal disturbance
Source
South Sudan Juba (5%) April 2014 4°-5°N; 31°-32°E 0.021(Feb 14) 0.005(March 14) Civil unrest [21,22]
Central African Republic (CAR)
Mongoumba(13%) September2011 4°-5°N; 18°-19°E <0.001(July 11) 0.101(August 11) Natural Hazard (Floods)
[23,24]
Rwanda Rutsiro(50%) November2012 2°-1°S;29.5°-30.5°E
<0.001(Sept 12) <0.001(October 12)
Natural Hazard (Floods)
[25,26]
Cameroon Nord Region
(13%)
September2009 9.5°-10.5°N; 14°-15°E
0.012(July 09) 0.023(August 09) Natural Hazard (Floods)
[27–29]
Mozambique Delgado(1%) February2013
12.5°S-11.5°S;39°-40°E
<0.001(Dec 12) 0.002(January 13) Natural Hazard (Floods)
[30,31]
a
Tprob, for temperature, is the probability (according to two tail t-test) that value in the month is equal to zero (difference between value for that month and the long term average should be zero). For example, a probability value of less than 0.05 (95% confidence level) rejects the null hypothesis that the value is equal to zero.
b
Pprob is calculated similarly to Tprob, but for precipitation. Coordinates indicate regions where TRMM data were obtained
Supportive evidence was obtained when spatial anomaly maps of temperature and precipi-tation were plotted, with expecprecipi-tation that if conclusions from the provincial analysis were valid, then differentiation in the patterns of hydroclimatic variability would be observed at spa-tial scales.Fig 4shows interpolated air temperature anomaly maps for the entire country of Zimbabwe for June, July, and August, 2008. It can be observed that Mashonaland (East, Cen-tral), as well as Manicaland, had temperature anomalies between +1 to +3% (changes greater than 2% were statistically significant at 95% confidence interval using two tail t-tests) during June, 2008, and a positive departure from the average during July, 2008. That is, warm condi-tions were present that were suitable for growth of the cholera bacteria in the environmental water system, mainly the Nyatsime and Manyame rivers. Following the period of elevated Fig 2. Change in air temperature for June, July and August 2008.A positive value represents temperature higher than the 15-year average; a negative value represents temperature lower than the 15-year average.
temperature, Mashonaland East had heavier than average precipitation, up to 10% (Fig 5a) during July, 2008.
Parts of Matabeleland South and Masvingo provinces (Fig 4) also experienced anomalous temperatures and greater precipitation during August, 2008. Therefore, these regions should have experienced cholera in September, but disease outbreak occur if favorable environmental conditions are accompanied by impaired water and sanitation infrastructure. While the Mashonaland East region experienced mixing of sewage contaminated river water with drink-ing water in both Chitungwiza and Harare cities [34], none of the regions in Matabeleland South and Masvingo provinces reported such incidents, but the disease subsequently spread throughout the country via secondary (human to environmental) transmission.
Fig 3. Change in precipitation for July and August 2008.A positive value represents rainfall higher than the 15-year average; a negative value represents rainfall lower than the 15-year average.
If empirical observations for the 2008 Zimbabwe cholera are valid, similar trends should be observed in other regions.Table 1provides a summary for five regions that includes those months for which first cholera cases were reported.Fig 5was constructed similarly as forFig 2, but includes all of the five other regions. The data show that anomalous above average air tem-peratures, followed by above average precipitation, occurred at all sites, and at least one month in advance.Fig 6shows the month when cholera was first reported for that region, and the cor-responding analysis presented inTable 1indicates that the observed anomalies of precipitation and temperature were statistically significant at 90% confidence intervals (using two-tail t-test), corroborating the hypothesis for cholera in Zimbabwe in 2008.
Analysis of historical epidemic cholera for the Indus River Basin
To validate the findings and determine whether the pattern of air temperature and precipita-tion would be observed elsewhere, we employed the binomial logistical regression models to analyze 25 years of historical cholera data for the Indus River basin region (Table C inS1 File). The model estimates probability of occurrence of cholera for nine locations in the Indus River Fig 4. Spatial temperature change from 15-year Average for (a) June and (b) July 2008.
doi:10.1371/journal.pone.0137828.g004
Fig 6. Precipitation and temperature anomalies for five regions in Africa.Black arrows on the x-axis of plots indicates month when cholera was first reported.
Basin (Delhi, Lahore, Ludhiana, Sialkot, Rawalpindi, Peshawar, Dera Ismail Khan, Multan, and Sirsa). Additional details for these locations have been published (Jutla et al., 2013).Fig 7shows results of performance of the model with respect to metrics for the association between predic-tor (cholera) and predictand (two month lead in air temperature and one month lead in precipi-tation). If the hypothesis for Zimbabwe cholera is valid, statistically significant values for model performance indicators should be observed for Indus River historical cholera. If p-values for the Hosmer-Lemeshow calculations are 0.52 to 0.85, the indication is insufficient evidence to claim the model does not fit the data. The p-values for Hosmer-lemeshow tests calculated in this instance were greater than 0.05 (statistical confidence at 95%), hence does not reject the null hypothesis that the model does not adequately fit the data. Similarly, the measure of association ranged between 0.35 to 0.70, suggesting a limited predictive capability of the model. The results statistically support the hypothesis of role for hydroclimatic conditions in epidemic cholera, with the caveat that only limited information is available concerning conditions of water and sanitation infrastructure during the study time period in the Indus River Basin.
Mechanistic model results
Mathematical models, such as compartmental representation of population [20], are often use-ful in understanding role of different environmental processes and associated variables that lead to disease outbreak. Therefore, after development of a SEIR model (details in supplemen-tary information), calibration (Fig 8; fitted R2= 0.88) using weekly cholera case data for Mashonaland East, three scenarios were used to determine the role, and possible association, of hydroclimatic processes as a trigger of epidemic cholera.
Fig 7. Statistical metrics for measure of association of cholera with air temperature and precipitation in the Indus River Basin.(Somers’D and Goodman Kruskal Gamma p-values were multiplied with 100 for comparison purposes).
Case 1: Control (equilibrium scenario). The model for this case scenario was calibrated using the assumptions that the susceptible population was greater than 1 and that there were no infected individuals (or carriers) present in the population. If our hypothesis that cholera outbreaks in Zimbabwe are related to hydroclimatic processes is valid, then environmental bac-teria in the aquatic medium should have increased in number (presence) at a higher rate than the number of cases occurring via secondary route of infection, primarily shedding of cholera bacteria from infected humans to the environment. Environmental and human contributions to the overall pathogen pool is shown inFig 9. The data suggest that environmental bacteria numbers peaked at least one month in advance compared to human transmission (secondary transmission).
Case 2: No external hydroclimatic forcing with presence of infected individuals. In this scenario, it was assumed that there were no external hydroclimatic forcings and no buildup of cholera bacteria populations in the aquatic system. The assumption was that infected individu-als were present and were simulated for each sub-scenario.Fig 10shows that none of the sub-scenarios was able to replicate the observed infected (I = calibrated) results, indicating that, in absence of appropriate hydroclimatic conditions, a cholera epidemic would not have occurred in the region.
Case 3: External hydroclimatic forcing and presence of infected individuals. This sce-nario is based on the assumption that external hydroclimatic conditions, such as above average temperature followed by above average precipitation, occurred without an enhanced environ-mental population of cholera bacteria. Similar to case 2 above, sub-scenarios were computed to Fig 8. Calibration of the model using Mashonaland East cholera data.(Starting week 46 represent November 13, 2008).
determine if introduction of infected individuals, with subsequent shedding of cholera vibrios to the aquatic environment, was sufficient to trigger an epidemic.Fig 10shows that none of the sub-scenarios, until introduction of 90 infected individuals was postulated, simulated condi-tions of the calibrated model (I = calibrated). However, when 10 to 20 infected individuals were introduced, a small increase in the number of cholera cases was predicted. However, with-out temperature and precipitation affecting the environmental reservoir, cholera epidemics were not indicated in any of the model simulations, giving credence to synergism between the environmental reservoir and external hydroclimatic forcings.
Fig 9. Simulated contribution of bacteria from infected population and growth of environmental bacteria.
doi:10.1371/journal.pone.0137828.g009
Fig 10. (a) Cholera cases with no external hydroclimatic forcing and environmental bacteria reservoir; (b) Cholera cases with external hydroclimatic forcing but with no environmental bacteria reservoir. (I = 0, 10. . .90 indicates infected introduced in the population and I = calibrated is the simulated infected cholera
cases after calibration of model).
Summary and Conclusion
Cholera is likely to occur in epidemic regions, namely those with nearby rivers or water bodies and insufficient safe water and sanitation systems, during times when warm air temperatures are followed by heavy precipitation, conditions that are optimum for growth of the cholera bac-teria. Heavy rainfall and subsequent flooding accelerate interaction between a contaminated water source and human exposure. Hydroclimatic predictability of a lead time for occurrence of cholera is possible when temperature and rainfall are higher than the long-term average and conditions are favorable for growth of cholera bacteria in the aquatic environment. Satellite data were successfully used to capture hydroclimatic sensitivities of satellite (TRMM) based precipitation and gridded air temperature data to predict cholera outbreaks atleast one month in advance.
Interest in the extremes of the variables of temperature and rainfall has heightened with cli-mate change. Cholera epidemics are likely to occur with high probability ifhydroclimatological risk[defined as a combination of large scale geophysical processes and environmental condi-tions conducive to bacterial growth] andsocietal risk[defined as reduced or lack of availability of safe drinking water and sanitation] occur in a community or region. The challenge in devel-oping a cholera prediction model for epidemic regions is to identify environmental conditions and enabling transmission mechanisms. When a major natural disaster strikes a region (town/ province) or civil disorder damages living conditions of a population center, a hydroclimate driven cholera tracking mechanism can be made operational by satellite remote sensing, moni-tor water and sanitation infrastructure, and the displaced population. Convergence of these fac-tors with environmental conditions optimum for growth of the cholera bacteria and
knowledge of transmission pathways, can provide a reliable prediction and early warning of cholera epidemics for public health action. In most affected regions, preventive responses are tied to the timing of the outbreaks. Such responses typically depend on the emergence of the index cases in a vulnerable region, where local health departments, in conjunction with public health personnel on the ground, monitor and evaluate the spread of cases. Once an outbreak in confirmed, measures to avoid or reduce infection—mostly in the form of providing safe water access, mobile sanitation facilities, water and sanitation awareness, medication for the infected (such as antibiotics or intravenous fluids), and oral rehydration therapy (ORT) is mobilized. However, due to the lack of long lead predictions, current warnings and responses typically operate with a lead-time of only a few days since the emergence of the index case. Thus, while these preparations are able to save lives and reduce infections, they become effective only after the outbreaks are well under way and thus the disease burden remains high in many regions.
Although, the timing can be anticipated fairly well in endemic regions, the potential magni-tude or the location of the outbreak remain unknown—and prepositioning and maintaining the appropriate level of human and material resources in anticipation of an outbreaks remains a difficult task. Predictions can add significant‘actionable knowledge’to preemptive prepara-tions. Especially in epidemic regions, predictions can be valuable by adding the potential tim-ing of outbreaks. Thus, armed with the knowledge of imminent outbreaks with a few weeks to months lead-time, vulnerable population groups (such as children and elders) can be preemp-tively vaccinated, at-risk areas (such as low level areas prone to flooding, areas with water scar-city and quality issues, areas next to bad drainage or effluent discharges, slums, etc) can be targeted with water and sanitation facilities, awareness, and rules enforcement, and public health groups can be prepositioned with ORT, antibiotics, and vaccines [35].
monitoring vulnerable regions and strengthen ability of the public health community to halt outbreaks early and reduce the disease burden [36]. The challenge to predict and mitigate out-breaks becomes more challenging, when societal change and factors such as civil unrest and natural disasters occur. However, the risks is compounded with environmental factors condu-cive to cholera outbreaks (due to temperature increase, heavy precipitation patters, or drought/ flood risk and proliferation of the cholera bacteria), and a robust early warning can contribute to mitigation of cholera outbreaks by enhancing the response capacity and resilience of regional institutions.
Supporting Information
S1 File. This file describes various model development and calibration procedures for mechanistic and logistical regression analysis.SEIR model variables and associated symbols (Table A); parameters and values used for model fitting (Table B); and model parameters for logistical regression for Indus Basin (Table C). Hydroclimatic SEIR model design (Fig A). (DOCX)
Acknowledgments
This research is funded in part from a NASA grant (NNX15AF71G) and WV NASA space grant. Antarpreet Jutla acknowledges assistance from Rebecca Posa during the analysis phase of the manuscript.
Author Contributions
Conceived and designed the experiments: AJ RC. Performed the experiments: AJ HB. Analyzed the data: AA AJ HA. Contributed reagents/materials/analysis tools: AH RC. Wrote the paper: RC.
References
1. Jutla A, Whitcombe E, Hasan N, Haley B, Akanda A, Huq A, et al. Environmental Factors Influencing Epidemic Cholera. Am J Trop Med Hyg. 2013; 89: 597–607. doi:10.4269/ajtmh.12-0721PMID: 23897993
2. Enserink M. Haiti’s Outbreak Is Latest in Cholera’s New Global Assault. Science. 2010; 330: 738–739. doi:10.1126/science.330.6005.738
3. Gaffga NH, Tauxe RV, Mintz ED. Cholera: a new homeland in Africa? Am J Trop Med Hyg. 2007; 77: 705–713. PMID:17978075
4. Mendelsohn J, Dawson T. Climate and cholera in KwaZulu-Natal, South Africa: The role of environmen-tal factors and implications for epidemic preparedness. Int J Hyg Environ Health. 2008; 211: 156–162. doi:10.1016/j.ijheh.2006.12.002PMID:17383231
5. Lobitz B, Beck L, Huq A, Wood B, Fuchs G, Faruque ASG, et al. Climate and infectious disease: Use of remote sensing for detection of Vibrio cholerae by indirect measurement. Proc Natl Acad Sci. 2000; 97: 1438–1443. doi:10.1073/pnas.97.4.1438PMID:10677480
6. Traerup SLM, Ortiz RA, Markandya A. The Costs of Climate Change: A Study of Cholera in Tanzania. Int J Environ Res Public Health. 2011; 8: 4386–4405. doi:10.3390/ijerph8124386PMID:22408580
7. Thompson AA, Matamale L, Kharidza SD. Impact of Climate Change on Children’s Health in Limpopo Province, South Africa. Int J Environ Res Public Health. 2012; 9: 831–854. doi:10.3390/ijerph9030831 PMID:22690167
8. Alexander KA, Carzolio M, Goodin D, Vance E. Climate Change is Likely to Worsen the Public Health Threat of Diarrheal Disease in Botswana. Int J Environ Res Public Health. 2013; 10: 1202–1230. doi: 10.3390/ijerph10041202PMID:23531489
10. Bompangue D, Giraudoux P, Handschumacher P, Piarroux M, Sudre B, Ekwanzala M, et al. Lakes as Source of Cholera Outbreaks, Democratic Republic of Congo. Emerg Infect Dis. 2008; 14: 798–800. doi:10.3201/eid1405.071260PMID:18439365
11. Bompangue D, Vesenbeckh SM, Giraudoux P, Castro M, Muyembe J-J, Kebela Ilunga B, et al. Cholera ante portas—The re-emergence of cholera in Kinshasa after a ten-year hiatus. PLoS Curr. 2012; 4: RRN1310. doi:10.1371/currents.RRN1310PMID:22453903
12. Rebaudet S, Sudre B, Faucher B, Piarroux R. Environmental determinants of cholera outbreaks in inland Africa: a systematic review of main transmission foci and propagation routes. J Infect Dis. 2013; 208 Suppl 1: S46–54. doi:10.1093/infdis/jit195PMID:24101645
13. WHO | Cholera in Zimbabwe—update [Internet]. [cited 6 Oct 2014]. Available:http://www.who.int/csr/ don/2008_12_26/en/
14. WHO | Cholera in Zimbabwe—update 3 [Internet]. [cited 6 Oct 2014]. Available:http://www.who.int/csr/ don/2009_03_23/en/
15. Fernandez MAL, Schomaker M, Mason PR, Fesselet JF, Baudot Y, Boulle A, et al. Elevation and chol-era: an epidemiological spatial analysis of the cholera epidemic in Harare, Zimbabwe, 2008–2009. BMC Public Health. 2012; 12: 442. doi:10.1186/1471-2458-12-442PMID:22708576
16. Jutla AS, Akanda AS, Islam S. Tracking Cholera in Coastal Regions Using Satellite Observations1. JAWRA J Am Water Resour Assoc. 2010; 46: 651–662. doi:10.1111/j.1752-1688.2010.00448.xPMID: 21072249
17. Jutla AS, Akanda AS, Griffiths JK, Colwell R, Islam S. Warming Oceans, Phytoplankton, and River Dis-charge: Implications for Cholera Outbreaks. Am J Trop Med Hyg. 2011; 85: 303–308. doi:10.4269/ ajtmh.2011.11-0181PMID:21813852
18. Huq A, Sack RB, Nizam A, Longini IM, Nair GB, Ali A, et al. Critical factors influencing the occurrence of Vibrio cholerae in the environment of Bangladesh. Appl Environ Microbiol. 2005; 71: 4645–4654. doi: 10.1128/AEM.71.8.4645-4654.2005PMID:16085859
19. Islam MS, Siddique AK, Salam A, Akram K, Majumdar RN, Zaman K, et al. Microbiological investigation of diarrhoea epidemics among Rwandan refugees in Zaire. Trans R Soc Trop Med Hyg. 1995; 89: 506. PMID:8560524
20. Mukandavire Z, Liao S, Wang J, Gaff H, Smith DL, Morris JG. Estimating the reproductive numbers for the 2008–2009 cholera outbreaks in Zimbabwe. Proc Natl Acad Sci. 2011; 108: 8767–8772. doi:10. 1073/pnas.1019712108PMID:21518855
21. Hosmer D, Lemeshow S. Applied Logistic Regression. John Wiley & Sons, Inc; 1989.
22. Hosmer DW, Hosmer T, Le Cessie S, Lemeshow S. A comparison of goodness-of-fit tests for the logis-tic regression model. Stat Med. 1997; 16: 965–980. PMID:9160492
23. Turton A. Three Strategic Water Quality Challenges that Decision-Makers Need to Know About and How the CSIR Should Respond [Internet]. Pretoria: Council for Scientific and Indus trial Research; 2008 Nov p. 28. Report No.: CSIR/NRE/WR/EXP/2008/0160/A. Available:http://www.environment.co. za/documents/water/KeynoteAddressCSIR2008.pdf
24. Akanda A, Jutla A, Gute D, Evans T, Islam S. Reinforcing cholera intervention through prediction-aided prevention. Bull World Health Organ. 2012; 90: 243–244. doi:10.2471/BLT.11.092189PMID: 22461722
25. Akanda AS, Jutla AS, Colwell RR. Global diarrhoea action plan needs integrated climate-based surveil-lance. Lancet Glob Health. 2014; 2: e69–e70. doi:10.1016/S2214-109X(13)70155-4PMID:25104658
26. WHO | WHO responds to health crises facing war-wracked South Sudan [Internet]. [cited 16 Oct 2014]. Available:http://www.who.int/features/2014/health-crisis-south-sudan/en/
27. WHO. Cholera outbreak in Juba, Central Equatoria State [Internet]. 2014 May p. 5. Available:http:// who.int/hac/crises/ssd/sitreps/south_sudan_juba_cholera_update_16may2014.pdf?ua=1
28. Central African Republic: Severe Local Storm—Jun 2011. In: ReliefWeb [Internet]. [cited 16 Oct 2014]. Available:http://reliefweb.int/disaster/st-2011-000073-caf
29. CDC Foundation. Cholera Outbreak Investigation in the Central African Republic [Internet]. p. 20. Avail-able:http://www.cdcfoundation.org/sites/default/files/upload/pdf/2011CholeraOutbreakReport.pdf
30. Rwanda: Floods—Apr 2012. In: ReliefWeb [Internet]. [cited 16 Oct 2014]. Available:http://reliefweb.int/ disaster/fl-2012-000067-rwa
32. 9 FCCOS in C| C of B| W| A water news A, Pm 2010 at 2:32. Flooding Causes Cholera Outbreak Spread in Cameroon. In: Circle of Blue WaterNews [Internet]. [cited 16 Oct 2014]. Available:http:// www.circleofblue.org/waternews/2010/world/flooding-causes-cholera-outbreak-spread-in-cameroon/
33. Cameroon cholera deaths rising as heavy rains bring flooding. In: ReliefWeb [Internet]. 3 Aug 2010 [cited 16 Oct 2014]. Available: http://reliefweb.int/report/cameroon/cameroon-cholera-deaths-rising-heavy-rains-bring-flooding
34. World Health Organization. Global Task Force on Cholera Control [Internet]. Geneva; p. 2. Available: http://www.who.int/cholera/countries/CameroonCountryProfile2011.pdf
35. World Health Organization. Global Task Force on Cholera Control: Mozambique [Internet]. Geneva; p. 2. Available:http://www.who.int/cholera/countries/MozambiqueCountryProfile2013.pdf