INFLUÊNCIA DA RIGIDEZ DA PARTE ANTERIOR DA
ENTRESSOLA DO TÊNIS NO DESLOCAMENTO ANGULAR
DO PÉ E NA POTÊNCIA DE JOELHO DURANTE A MARCHA
Belo Horizonte
Renan Alves Resende
INFLUÊNCIA DA RIGIDEZ DA PARTE ANTERIOR DA ENTRESSOLA DO TÊNIS NO DESLOCAMENTO ANGULAR DO PÉ E NA POTÊNCIA DE JOELHO
DURANTE A MARCHA
Belo Horizonte
Escola de Educação Física, Fisioterapia e Terapia Ocupacional/UFMG 2011
Dissertação apresentada ao Programa de Pós-Graduação em Ciências da Reabilitação da Escola de Educação Física, Fisioterapia e Terapia Ocupacional da Universidade Federal de Minas Gerais como requisito parcial à obtenção do título de Mestre em Ciências da Reabilitação
Linha de Pesquisa: Estudos do desempenho motor e funcional humano.
PREFÁCIO
De acordo com as normas estabelecidas pelo Colegiado do Programa de Pós-Graduação em Ciências da Reabilitação da UFMG, a estrutura deste trabalho é composta por três partes. A primeira parte é composta por uma introdução com o objetivo de apresentar a revisão bibliográfica sobre o tema, a problematização e a justificativa do estudo, bem como por uma descrição detalhada do método utilizado para realização do trabalho. A segunda parte é composta por um artigo em que os resultados e a discussão são apresentados, redigidos de acordo com as normas preconizadas pelo periódico para o qual este trabalho será posteriormente enviado para publicação (Clinical Biomechanics – ISSN: 0268-0033). Por fim, na terceira
AGRADECIMENTOS
Agradeço à minha mãe, Marly Aparecida Alves Rezende, a maior responsável por tudo de bom que aconteceu e que possa acontecer em minha vida, meu maior exemplo. Sua história de vida e a forma heróica como conseguiu criar cinco filhos me incentivam a lutar pelos meus objetivos. Você nos educou da melhor forma que uma mãe pode fazer, pelo exemplo. Talvez você nunca vá entender a real dimensão do que você fez por nós. Amo-te acima de tudo!
À minha irmã, Patrícia Resende Camilo, o maior presente que a vida podia me dar. Você participou intensamente de toda a minha criação e, de forma sutil, de segunda mãe se transformou em minha grande amiga! A ligação que tenho com você é o que me faz acreditar em uma força maior! Você é o elo que nunca vai ser quebrado!
Ao meu pai, Newton Rezende, meus irmãos Raphael, Rodrigo e Ricardo e ao meu cunhado Abraão Camilo. Obrigado por me apoiarem em todas as decisões que tomei! Vocês fazem parte dessa conquista! Amo vocês!
À minha orientadora, Renata Noce Kirkwood, que acima de tudo se tornou uma grande amiga ao longo desses seis anos de convivência. Professora extremamente capacitada e apaixonada por aquilo que faz, você foi o meu exemplo a seguir ao longo desses anos. Obrigado por ter acreditado em mim desde o início da graduação e por ter me possibilitado despertar o interesse pela pesquisa. É extremamente gratificante poder contar com uma orientadora tão presente e tão dedicada ao meu processo de aprendizado.
Ao Lucas Rodrigues Nascimento. Se eu soubesse que ao final do mestrado além do título de mestre eu teria um amigo como você eu teria feito antes! Com sua energia única, você tem o dom de tornar cada pequeno detalhe em algo muito especial! Obrigado por resgatar em mim o prazer pela pesquisa, pela escrita e pela enorme ajuda em todos os passos que dei ao longo desse projeto. Só você sabe cada pequeno obstáculo que tive que superar para chegar até aqui e isso mostra o quanto a sua amizade é importante pra mim!
À Ana Cisalpino Pinheiro e Maria Clarice Lopes da Silva, pela enorme dedicação durante todas as coletas e por me acalmar nos momentos de maior desespero. Vocês me ajudaram a carregar o piano!
Ao Renato Trede e em especial ao Professor Antônio Pertence pela grande colaboração durante a fase inicial desse projeto e por disponibilizar o seu laboratório para o meu projeto!
Aos amigos da vida, Daniel Faria, Inalda Burni, Rafael Ferreira e Rafael Pais e em especial ao Marcos Henrique Ferreira, meu eterno grande amigo! Quando olho pra trás e vejo tudo o que nós dois já passamos juntos, tenho vontade de voltar no tempo e fazer tudo de novo. Obrigado por continuar me aguentando! Ao Guilherme Pacheco, por ser essa pessoa tão especial na minha vida e na daqueles que o cercam. Obrigado por me fazer acreditar em tudo aquilo que eu já não acreditava mais!
Aos grandes amigos que fiz na graduação, em especial, Gabriela Gonçalves, Gisele Alves, Juliana Antero, Leandro Moura, Priscilla Santos, Rafael Tavares e Vivian Yankous. Os cinco anos que passamos juntos jamais serão esquecidos! Vocês foram a base da minha formação! Fico muito feliz com o sucesso de todos vocês!
À equipe Fisioemcasa, Adriana Magalhães, Kamile Tiradentes, Mary Avelar, Niziane Fonseca, Thaís Ischaber, Wendel Couto e em especial ao Mauro Castelo Branco, que acreditou em mim e contribuiu imensamente para o meu amadurecimento profissional!
Aos brilhantes professores Elyonara Mello de Figueiredo, Luci Fuscaldi Teixeira-Salmela, Marisa Cotta Mancini e em especial ao professor Sérgio Teixeira da Fonseca, que de maneira direta e indireta me auxiliou na concepção teórica desse projeto e aceitou representar a minha orientadora durante a defesa dessa dissertação!
Aos funcionários dos Departamentos de Fisioterapia e Terapia Ocupacional da UFMG pela disposição e ajuda contínua, em especial a: Gilvana Gomes de Souza, Marilane Soares, Margaret Amaral de Morais, Pollyana Maria Francisco Gomes, Richard Marques Perdigão e Rivamar Conceição de Souza.
RESUMO
Introdução: A rigidez de compressão da parte anterior da entressola do tênis pode influenciar na cinemática e cinética dos membros inferiores. É possível que uma entressola com menor rigidez aumente o deslocamento angular dos segmentos do pé e aumente a potência dos membros inferiores. Objetivo: Avaliar a influência da rigidez da parte anterior da entressola do tênis no deslocamento angular dos segmentos do pé, joelho e quadril e na potência de tornozelo, joelho e quadril durante a fase de apoio da marcha. Método: Dados cinemáticos e cinéticos tridimensionais do membro inferior de 37 sujeitos saudáveis utilizando dois níveis diferentes de rigidez da parte anterior da entressola do tênis (condições baixa-rigidez e alta-rigidez) foram obtidos durante a fase de apoio da marcha por meio da utilização do sistema Qualisys ProReflex sincronizado a uma plataforma de força. As variáveis dependentes do estudo foram: deslocamento angular de antepé-tíbia e retropé nos planos frontal e transverso e de joelho e quadril no plano transverso e potência de tornozelo, joelho e quadril no plano sagital durante a fase de apoio da marcha. Os dados foram analisados inicialmente extraindo a amplitude total de movimento de antepé-tíbia e retropé das curvas de deslocamento angular e pela aplicação da análise de componentes principais para extrair as diferenças em formato e magnitude nas curvas de deslocamento angular e de potência entre as duas condições. Resultados: A condição baixa-rigidez apresentou maior amplitude de movimento total no plano transverso de antepé-tíbia e retropé do que a condição alta-rigidez (α=0,05). A análise de componentes principais detectou diferenças estatisticamente significativas em formato e magnitude entre as curvas de deslocamento angular e de potências duas condições. Conclusões: Os achados sugerem a influência da rigidez de compressão da parte anterior da entressola sobre a cinemática dos segmentos do pé e sobre a geração de potência na articulação do joelho durante a fase de apoio da marcha. A condição baixa-rigidez foi associada a um atraso na geração de energia durante a fase final de apoio o que pode influenciar negativamente o desempenho do indivíduo durante a marcha.
ABSTRACT
Introduction: The compression stiffness of the midsole at the forefoot may influence the kinematics and the kinetics of the lower extremity. It is possible that a midsole with low stiffness may increase the angular displacement of the foot segments and increase the power of the lower extremity. Purpose: Evaluating the influence of the stiffness of the forefoot midsole on the motion of the segments of the foot, knee and hip and on the power of the ankle, knee and hip during the stance phase of gait. Method: Three-dimensional kinematics and kinetics data of the lower extremity of 37 healthy subjects, wearing two different levels of forefoot midsole shoe stiffness (low-stiffness and high-(low-stiffness conditions), were obtained during the stance phase of gait using the Qualisys ProReflex synchronized with a force platform. The dependent variables were: forefoot and rearfoot motion in the frontal and transverse planes; knee and hip motion in the transverse plane; sagittal power at the ankle, knee and hip joints. Data were analyzed by first extracting the total range of motion from the forefoot and rearfoot waveforms and by applying principal component analysis to extract the shape and magnitude differences from the waveforms between conditions. Results: Low-stiffness condition had a higher range of motion in the transverse plane of the forefoot and rearfoot than the high-stiffness condition (α=0.05). The principal component analysis detected magnitude and waveform characteristics that were significantly different between conditions. Conclusions: The findings suggest the influence of the compression stiffness of the forefoot midsole on the kinematics of the segments of the foot and on the power generation at the knee joint during the stance of gait. The low-stiffness condition was associated with a delay in the generation of energy during late stance which may negatively influence the performance during gait.
SUMÁRIO
1 INTRODUÇÃO... 13
1.1 Objetivos... 17
2 MATERIAIS E MÉTODO... 20
2.1 Delineamento do Estudo... 20
2.2 Amostra... 2.3 Instrumentos e Medidas... 2.3.1 Ficha de identificação e avaliação... 2.3.2 Sistema de análise de movimento... 20 20 20 21 2.3.3 Tênis... 25
2.4 Procedimentos... 2.5 Redução dos dados... 27 28 2.6 Análise estatística... 30
3 REFERÊNCIAS ... 32
4 ARTIGO... 37
5 CONSIDERAÇÕES FINAIS... 62
APENDICE A... 64
APENDICE B... 67
ANEXO A... 68
1 INTRODUÇÃO
Diversos estudos realizados em diferentes grupos de indivíduos tiveram como objetivo explorar os mecanismos relacionados com o desempenho do indivíduo e com a ocorrência de lesões durante a marcha (BERETTA, 2009). Especificamente em relação a tênis desenvolvidos para utilização durante esta atividade, duas estratégias tem sido foco de atenção principal da comunidade científica: minimização da dissipação de energia e maximização do retorno energético (NIGG, 1987). A minimização da dissipação de energia se refere a todas as estratégias que têm como objetivo reduzir a perda de energia mecânica gerada pelo sistema musculoesquelético na deformação dos tênis. Por outro lado, a maximização do retorno energético objetiva o retorno da maior quantidade possível de energia elástica absorvida pelos tênis para o sistema musculoesquelético.
Estudos que investigaram o retorno de energia elástica durante a corrida demonstraram que a capacidade dos tênis de retornar energia elástica para o sistema musculoesquelético é limitada (NIGG, 1987; ALEXANDER, 1989; MCMAHON, 1987; TURNBALL, 1989). Os principais fatores atribuídos a essa limitação são as propriedades mecânicas dos materiais amortecedores usados na entressola dos tênis de retornar energia para o sistema musculoesquelético
(SHORTEN, 1993). Nigg e Segesser(1992) sugerem que durante a construção de
tênis o retorno energético não é a melhor abordagem para melhorar o desempenho do indivíduo, mas sim, a minimização da dissipação de energia. Dois principais
fatores dificultam o retorno de energia dos tênis para o sistema musculoesquelético: a baixa capacidade de absorver e devolver energia dos materiais utilizados como amortecedores nos tênis e o local do tênis em que a maior parte da energia é absorvida (retropé) não ser o local onde essa energia pode ser utilizada, antepé. Dessa forma, a menor rigidez da parte anterior da entressola do tênis devido à presença de materiais amortecedores nessa região poderia favorecer a dissipação de energia e não o retorno de energia para o sistema musculoesquelético.
indivíduos utilizando tênis de corrida comerciais cuja rigidez da entressola foi modificada por meio da inserção de uma placa de fibra de carbono do antepé até o retropé da entressola. Os autores concluíram que a rigidez da entressola do tênis é um parâmetro importante para obter eficiência energética durante a corrida, pois foi encontrado menor gasto energético com o aumento da rigidez da entressola do tênis. Apesar do grande número de estudos que avaliaram as repercussões de diferentes tipos de entressola sobre os membros inferiores (AERTS, 1993; ARNDT, 2003; BENNO, 1988; CHEUNG, 2008), não foram encontrados estudos que avaliaram especificamente a influência da alteração da rigidez da parte anterior da entressola do tênis. Nesse contexto, investigar a influência da rigidez específica da parte anterior da entressola do tênis poderia melhorar o entendimento acerca da influência da mesma sobre a biomecânica do membro inferior, pois é possível que a região posterior e a região anterior da entressola devam possuir características distintas para propiciar o melhor desempenho do indivíduo durante a marcha.
Uma das possíveis influências da rigidez da parte anterior da entressola ocorre sobre a habilidade da musculatura flexora plantar do tornozelo em gerar potência durante a impulsão na fase final de apoio da marcha (REQUIAO, 2005). A musculatura posterior da perna, representada pelos músculos gastrocnêmio e sóleo, encontra-se ativa entre 10% e 60% do ciclo da marcha, gerando energia principalmente entre 40% e 60% do ciclo, quando a força de reação do solo está direcionada para cima e para frente (NADEAU, 1997; NADEAU, 1999; WINTER, 1983). Segundo Winter (1983), os flexores plantares são responsáveis pela produção de 50% do trabalho positivo durante essa fase da marcha o que é importante para levar a perna à frente na fase de oscilação e acelerar a massa do corpo também à frente (LEWIS, 2008), aumentando o tamanho do passo e, consequentemente, a velocidade da marcha, o que resulta em uma marcha mais eficiente (REQUIAO, 2005).
predispor o indivíduo à ocorrência de lesões por sobrecarga nessas articulações (REQUIAO, 2005).
Roy e Stefanyshyn (2006) investigaram a influência do aumento da rigidez de toda a extensão medial da entressola do tênis no consumo de oxigênio e seus efeitos locais sobre a absorção e geração de energia nas articulações dos membros inferiores durante a corrida em indivíduos jovens saudáveis. Os resultados mostraram que os indivíduos diminuíram o consumo de oxigênio e aumentaram a absorção de energia apenas na articulação do tornozelo durante a condição de maior rigidez da entressola do tênis. Em relação às articulações do quadril, joelho e metatarsofalangeana (MTF) não foram encontradas diferenças significativas. É possível que o aumento da absorção de energia na articulação do tornozelo possa ser uma justificativa para o menor consumo de oxigênio encontrado na condição com aumento da rigidez, pois a energia que foi absorvida e, possivelmente, transferida a outros grupos musculares, por meio das conexões de tecido conectivo existentes, favorece a redução do gasto energético.
Por outro lado, Stefanyshyn e Nigg (2000) investigaram a influência do aumento da rigidez da entressola do tênis sobre a potência articular dos membros inferiores durante a corrida e o salto em um grupo de indivíduos jovens saudáveis. Foi encontrada uma menor dissipação de energia na articulação MTF com o uso da entressola com maior rigidez, porém não foram observadas diferenças nas articulações do tornozelo, joelho e quadril. Os autores justificaram que a ausência de diferença estatisticamente significativa pode ter ocorrido devido à limitação do tamanho da amostra, sendo que não foi realizado cálculo do poder estatístico do estudo. Foi encontrada, no entanto, uma tendência para a diferença entre os grupos na articulação do tornozelo, a qual absorveu e gerou menos energia com o tênis com maior rigidez.
A movimentação dos segmentos do pé durante a fase de apoio da marcha também pode ser influenciada por diferenças na rigidez da parte anterior da entressola do tênis. É possível que a diminuição da rigidez da parte anterior da entressola do tênis ofereça menor resistência mecânica aos movimentos de eversão de antepé, calcâneo e consequentemente da articulação subtalar, permitindo maior movimentação dessas articulações durante a fase de apoio da marcha. Essas alterações podem levar a uma maior susceptibilidade para o desenvolvimento de patologias específicas do pé e tornozelo conseqüentes à interação desse padrão com as características mecânicas das fases de médio apoio e apoio terminal (STEFANYSHYN, 1997; STEFANYSHYN, 2000; SOUZA, 2009).
A subtalar, que se encontra deslocada 45º no plano frontal, permite o acoplamento dos movimentos do pé no plano frontal (eversão do calcâneo) com os movimentos de rotação interna do talus e do membro inferior no plano transverso (NIGG, 1993). Essa conexão sugere que mudanças nos movimentos da articulação subtalar podem levar a compensações nas articulações proximais (NIGG, 1993), dentre estas a rotação interna excessiva de joelho e quadril, que pode ocorrer como consequência da adução do talus (SOUZA, 2009) e estar associada a inúmeras lesões de membros inferiores (MENDONÇA, 2005).
A entressola do tênis deve ter características de rigidez distintas ao longo da sua extensão para propiciar melhor eficiência energética do sistema músculo-esquelético durante a marcha. No entanto, a maior parte dos estudos que investigaram a influência da rigidez do tênis sobre a cinemática e cinética dos membros inferiores utilizaram uma densidade única de entressola, que foi definida como rígida ou macia (RUBIN, 2009). Esse tipo de entressola difere dos tipos de tênis fabricados atualmente para a prática de exercício físico, que utilizam entressolas com características anisotrópicas (densidades múltiplas).
possuir maior rigidez mecânica que a parte posterior (STEFANYSHYN, 1997), o que potencializaria a função do pé como uma alavanca rígida durante a fase de retirada do pé do solo.
Ao avaliar a rigidez mecânica da parte anterior de tênis comerciais vendidos especificamente para a prática de caminhada e corrida, foi encontrado nos tênis pesquisados um mecanismo amortecedor na parte anterior da entressola, e existe uma tendência dos fabricantes de produzir tênis com entressolas menos rígidas na região anterior (STEFANYSHYN, 1997). É especulado que essa tendência seja guiada por aspectos relacionados ao conforto do indivíduo e não necessariamente pela melhor adequação à biomecânica dos membros inferiores durante a caminhada e a corrida(STEFANYSHYN, 1997). Não foram encontrados estudos que avaliaram
as repercussões cinéticas e cinemáticas sobre os membros inferiores durante a marcha com o uso de tênis utilizados para a prática de exercício físico com diferentes níveis de rigidez mecânica da parte anterior da entressola. Portanto, o objetivo do presente estudo foi avaliar a influência da rigidez da parte anterior da entressola do tênis nas variáveis cinemáticas (deslocamento angular nos planos frontal e transverso de antepé e retropé e no plano transverso de joelho e quadril) e cinéticas (potência das articulações do quadril, joelho, tornozelo no plano sagital) dos membros inferiores durante a fase de apoio da marcha.
1.1 Objetivos
1.1.1 Objetivo Geral
Avaliar a influência da rigidez da parte anterior da entressola do tênis nas variáveis cinemáticas e cinéticas dos membros inferiores durante a fase de apoio da marcha.
1.1.2 Objetivos Específicos
Comparar a forma e as magnitudes das curvas de deslocamento angular de antepé-tíbia e de retropé nos planos frontal e transverso e do joelho e quadril no plano transverso entre as condições alta-rigidez e baixa-rigidez;
Comparar a forma e as magnitudes das curvas de potência articular no plano sagital das articulações do tornozelo, joelho e quadril entre as condições
2 MATERIAIS E MÉTODO
2.1 Delineamento do estudo
Foi conduzido um estudo experimental com medidas repetidas, realizado no Laboratório de Análise de Movimento da Escola de Educação Física, Fisioterapia e Terapia Ocupacional da Universidade Federal de Minas Gerais.
2.2 Amostra
A amostra do tipo conveniência foi constituída por 37 voluntários, recrutados na comunidade a partir de uma divulgação prévia de acordo com os seguintes critérios de inclusão: (1) idade entre 18 e 35 anos de idade; (2) utilizar no dia-a-dia tênis com tamanhos entre 37 e 39 (medida brasileira); (3) não ter sofrido lesões ou ter sido submetido a qualquer tipo de cirurgia de membros inferiores nos últimos seis meses; (4) não possuir déficits visuais significativos não corrigidos por lentes corretivas; (5) não possuir alterações musculares ou neurológicas que interferiam no desempenho da marcha; (5) aceitar participar da pesquisa por meio da assinatura do Termo de Consentimento Livre e Esclarecido (TCLE). (APÊNDICE A) Foi utilizado como critério de exclusão: (1) relatar desconforto durante qualquer procedimento da coleta de dados. O projeto foi aprovado pelo Comitê de Ética em Pesquisa da UFMG: ETIC: 0047.0.203.000-10. (ANEXO A)
2.3 Instrumentos e medidas
2.3.1 Ficha de Identificação e Avaliação
2.3.2 Sistema de Análise de Movimento
As variáveis dependentes: deslocamento angular do antepé e retropé nos planos frontal e transverso e do joelho e quadril no plano transverso e potência de tornozelo, joelho e quadril no plano sagital foram obtidas por meio do sistema de
fotogrametria baseada em vídeo Qualisys – Pro Reflex MCU (QUALISYS MEDICAL
AB, 411 12 Gothenburg, Suécia). O Sistema Qualisys permite a reconstrução em três dimensões (3D) de marcas passivas refletoras localizadas em estruturas ósseas específicas. O sistema possui oito câmeras com iluminação produzida por um grupo de diodos emissores de luz infravermelha, localizados em volta da lente de cada uma das câmeras. As marcas passivas refletoras captam e refletem a luz infravermelha, que é então captada pela lente das câmeras. Os dados captados foram processados pelo programa de aquisição Qualisys Track Manager 1.6.0.x –
QTM, que calcula a posição de cada marca em duas dimensões. Por meio da
triangulação das posições das marcas obtidas pelas oito câmeras, as coordenadas de cada marca são reconstruídas em três dimensões.
A calibração do sistema para determinar as coordenadas de referência global foi realizada utilizando uma estrutura de referência metálica em forma de “L”, que contém quatro marcadores refletivos. Dois marcadores refletivos estavam presos ao eixo mais curto X que determina a direção látero–medial. O eixo mais longo possui dois marcadores refletivos, que determinam a direção Y, ou ântero–posterior. A referência metálica foi colocada sobre a plataforma de força e uma batuta em forma de “T”, contendo dois marcadores refletivos fixos na extremidade da haste superior a uma distância de 751 mm foi usada na varredura do volume de interesse. A batuta foi movida em todos os planos dentro desse volume por 30 segundos permitindo assim gerar os dados que determinam a localização e orientação das marcas. A frequência de captação foi de 120 Hz para calibração e para coleta (GARD, 2004).
Sincronizado ao sistema Qualisys, encontrava-se uma plataforma de força AMTI® (
Advanced Mechanical Tecnology, modelo OR6-6, Watertown, MA, USA)
movimento. A calibração da plataforma ocorreu simultaneamente à calibração do sistema Qualisys. A colocação da referência metálica sobre o canto direito da
plataforma alinha as coordenadas da plataforma de força com as coordenadas do sistema Qualisys. Dessa forma, os dados cinemáticos e cinéticos são extraídos
usando o mesmo sistema de referência. Para definir o momento do contato inicial e da retirada do pé do solo, caracterizando a fase de apoio da marcha, foi utilizada a força de reação do solo obtida pela plataforma de força.
Para a captura do movimento é necessário definir o tamanho e a posição de cada segmento. Para isso, o sistema faz uso de dois tipos de marcadores: os marcadores anatômicos e os marcadores de rastreamento. Os marcadores anatômicos são necessários para a construção do modelo biomecânico por meio da identificação do comprimento dos segmentos e a localização dos eixos articulares. Dessa forma, foi atribuído ao modelo um sistema de coordenadas para cada segmento de maneira coerente com a definição de planos e eixos anatômicos. Os marcadores anatômicos eram esféricos com 15 mm de diâmetro. Os segmentos construídos foram: pelve, coxa, perna, complexo tornozelo/pé, retropé e antepé. As referências anatômicas para a colocação dos marcadores foram detectadas por meio de palpação e incluíram os seguintes pontos: ponto mais alto da crista ilíaca direita e esquerda, trocânter maior direito e esquerdo, epicôndilo lateral e medial do fêmur, maléolo lateral e medial, sustentáculo do tálus, tuberosidade peroneal, base e cabeça do primeiro e quinto metatarsos e região do tênis correspondente à cabeça do 1° e 5° metatarsos.
Os marcadores de rastreamento têm como objetivo rastrear a trajetória de cada segmento durante o movimento por meio de no mínimo três marcadores por segmento, posicionados de forma não-colinear (CAPOZZO, 1984). Esses marcadores de rastreamento foram posicionados com o requerimento técnico, tal como a visibilidade em um número suficiente de câmeras e para minimizar o movimento relativo entre as marcas e o osso subjacente (CAPOZZO, 2005). Nos segmentos pelve, coxa, perna, complexo tornozelo/pé, retropé e antepé foram usados clusters rígidos para afixar os marcadores de rastreamento. Um cluster de
forma retangular com quatro refletores foi colocado na base do sacro entre as espinhas ilíacas posteriores e dois clusters, com três refletores com distribuição
marcadores posicionado sobre o calcâneo próximo à inserção do Tendão Calcâneo e no segmento antepé foi utilizado um cluster com três marcadores posicionado
sobre a região correspondente à diáfise do segundo e terceiro metatarso (foi realizada uma adaptação em forma de abertura na parte posterior do tênis e retirada a lingüeta do mesmo para permitir a colocação dos clusters). Duas coletas estáticas
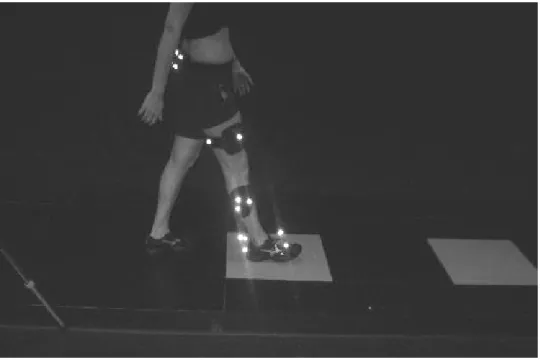
foram necessárias para o registro da posição e a orientação das marcas anatômicas e de rastreamento. A primeira coleta estática era realizada com o indivíduo descalço o que possibilitou a utilização dos marcadores de definição (maléolo lateral e medial, sustentáculo do talus, tuberosidade peroneal, base e cabeça do 1º e 5º metatarsos) e de rastreamento (cluster sobre o calcâneo e sobre o antepé) dos segmentos do pé
e de definição e rastreamento da tíbia durante a mesma. (Fig.1) Os marcadores de sustentáculo do talus, tuberosidade peroneal, base e cabeça do 1° e 5º metatarsos eram retirados, permanecendo os clusters de rastreamento de tíbia, calcâneo e
FIGURA 1: Primeira coleta estática.
FIGURA 3: Coleta dinâmica.
2.3.3 Tênis
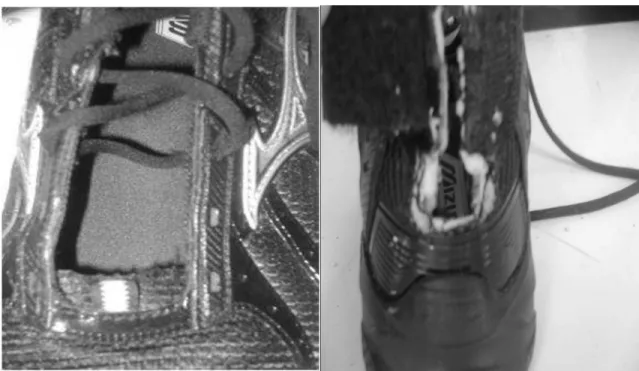
Dois pares de tênis idênticos, tamanho 39 (medida brasileira), desenvolvidos especificamente para a prática de corrida e caminhada, foram adquiridos para a realização do estudo. Os dois pares de tênis tiveram suas lingüetas retiradas para possibilitar o uso do cluster de antepé e em sua parte posterior foi realizada uma
abertura posteriormente fixada com velcro com o objetivo de possibilitar o uso do
cluster de retropé posicionado sobre o calcâneo (Fig. 4). Na parte anterior (12 cm de
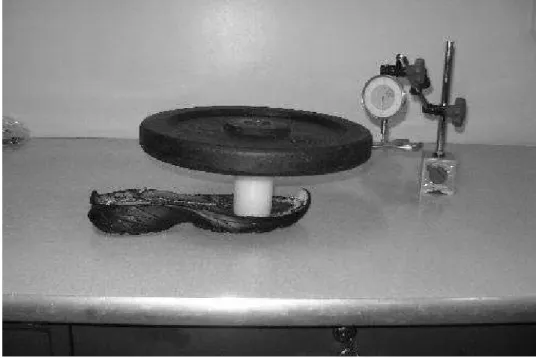
mm². Sobre a haste metálica foi posicionado um relógio comparador analógico com fundo de escala de centésimos de milímetros fixo sobre uma base magnética, o que permitiu medir a deformação da entressola após a aplicação da força de 98,2 N. (Fig. 5) Foram realizadas três medidas de cada entressola e calculada a média e o desvio padrão. Assim, na fórmula k = P/δ, ao dividirmos a força aplicada P pela deformação sofrida δ obtivemos a rigidez k, que informa sobre a resistência de um corpo elástico à deformação por uma força aplicada. O tênis baixa-rigidez apresentou rigidez de 29,76 N/mm (DP = 0,54) e o tênis alta-rigidez apresentou rigidez de 49,1 N/mm (DP = 0,58).
FIGURA 5: Mensuração da rigidez da parte anterior da entressola.
2.4 Procedimentos
O estudo foi realizado no Laboratório de Análise de Movimento (LAM) do Departamento de Fisioterapia da Escola de Educação Física, Fisioterapia e Terapia Ocupacional da Universidade Federal de Minas Gerais (UFMG), Belo Horizonte - MG. Os participantes foram instruídos acerca dos objetivos do estudo antes de assinarem o termo de consentimento livre e esclarecido (APÊNDICE A). Em seguida, foi aplicado (por um acadêmico de fisioterapia da UFMG previamente treinado) o questionário com o objetivo de investigar sobre a presença de possíveis critérios de exclusão.
A coleta dos dados foi realizada pelo pesquisador auxiliado por um acadêmico de fisioterapia da UFMG. Inicialmente, foi realizado um estudo piloto com 10 indivíduos com o objetivo de avaliar a confiabilidade teste-reteste do examinador nas medidas realizadas durante o estudo. O estudo piloto demonstrou que as medidas apresentaram confiabilidade de moderada a excelente (APÊNDICE B).
rastreamento. Os marcadores dos clusters foram fixados em um neoprene e
colocados nos participantes com auxílio de um velcro. A colocação dos marcadores anatômicos e de rastreamento foi feita pelo mesmo pesquisador em todas as coletas dos participantes.
Antes de iniciar a coleta da marcha, o sistema Qualisys foi calibrado como
explicitado anteriormente na página 21 e em seguida foi realizada a primeira coleta estática com o indivíduo descalço para possibilitar a posterior definição dos segmentos tíbia, retropé e antepé. Os participantes foram então calçados com o tênis sorteado para a primeira coleta e instruídos a caminharem ao longo da passarela por um período de prática de cinco minutos com o tênis para a familiarização com o mesmo e com os marcadores. Foi realizada a segunda coleta estática com o indivíduo em posição ortostática para possibilitar a posterior definição dos segmentos pelve, coxa, tíbia e complexo do pé. Cada participante, então, deambulou pelo menos seis vezes pelos dez metros de extensão da passarela com o primeiro tênis na sua velocidade auto-selecionada. Para iniciar a coleta, o pesquisador dava o comando verbal “pode ir” ao mesmo tempo em que acionava o computador do Qualisys
Após cada coleta, era verificado se todas as marcas de rastreamento haviam sido visualizadas durante cem por cento da fase de apoio da marcha e então, os dados eram armazenados para análise. Em seguida, foram repetidos os mesmos procedimentos com o tênis sorteado para a segunda coleta. O tempo médio de permanência de cada participante no LAM foi em torno de 60 minutos.
Após o término da coleta de dados de toda a amostra, foi realizada a avaliação da rigidez da parte anterior da entressola do tênis no laboratório de Engenharia Mecânica da Universidade Federal de Minas Gerais.
2.5 Redução dos dados
A aquisição dos dados cinemáticos foi realizada pelo software de aquisição
Qualisys Track Manager 1.9.2.(Gothenburg). Nessa etapa, foi realizada a
Em seguida, os dados foram transferidos para o software Visual3D para
processamento, no qual foram construídos dois modelos biomecânicos para cada indivíduo: o primeiro modelo baseado na coleta estática com o indivíduo descalço, necessário para a definição do deslocamento angular dos segmentos do pé e o segundo modelo baseado na coleta estática com o indivíduo calçado, necessário para a definição do deslocamento angular de joelho e quadril e potência de tornozelo, joelho e quadril. Os modelos foram construídos com base na posição das marcas de referência capturadas durante as duas coletas estáticas e, em seguida, esses modelos foram aplicados aos arquivos dinâmicos. Os dados da plataforma de força foram então processados, delimitando-se o contato inicial e a retirada do pé ou
toe-off. Essas informações foram usadas para a normalização da fase de apoio da
marcha, de 0 a 100% (contato do pé até retirada do mesmo pé).
Os ângulos e a potência articulares foram calculados usando-se a sequência de Cardan e definidos como a orientação do sistema de coordenadas de um
segmento em relação ao sistema de coordenadas do segmento de referência. Para a normalização dos ângulos, o software calcula a orientação relativa do segmento e
do segmento referência, em relação à posição de referência (coleta estática) e aplica essa orientação relativa dos dois segmentos às coletas dinâmicas.
Para os ângulos nos planos frontal e transverso de retropé e antepé/tíbia a tíbia foi utilizada como segmento referência. Os ângulos no plano transverso do quadril e joelho foram obtidos usando-se como segmento referência a pelve e a coxa, respectivamente. As potências de quadril, joelho e tornozelo foram obtidas usando-se como segmento referência a pelve, a coxa e a tíbia, respectivamente.
Em seguida, foi aplicado um filtro de passa baixa Butterworth de quarta ordem
com a frequência de corte estabelecida em seis Hz aos gráficos gerados para diminuir os ruídos provenientes da movimentação de marcadores. Foram gerados os gráficos da média dos deslocamentos angulares de retropé e antepé/tíbia nos planos frontal e transverso de movimento e de quadril e joelho no plano transverso. Durante a geração dos gráficos, foi utilizada a convenção de deslocamentos angulares positivos para rotação interna de quadril e joelho, e adução e inversão de retropé e antepé/tíbia.
partir do produto das velocidades angulares com os momentos de força articulares. (ENG, 1995).
2.6 Análise estatística
Os dados antropométricos dos participantes foram descritos por meio de medidas de tendência central e de dispersão. Foram extraídas as ADMs de antepé e retropé nos planos frontal e transverso. Para identificar diferenças entre as condições foi aplicado o teste tpareado para dados com distribuição normal e teste de Wilcoxon
para dados que não possuem distribuição normal.
A Análise de Componentes Principais (ACP) foi realizada para sumarizar as informações contidas nas 101 variáveis, correspondentes às 101 porcentagens do ciclo da marcha, em um número pequeno de componentes. A ACP tem como objetivo explicar a estrutura da variabilidade de um vetor aleatório de p-variáveis por meio de combinações lineares feitas a partir dessas variáveis (KIRKWOOD, 2011). As combinações lineares são chamadas de componentes principais, não correlacionadas entre si e capazes de reter o máximo da informação contida nas p-variáveis originais. Essa análise resulta em coeficientes, que são os pesos dados a cada variável para cada um dos componentes, e nos escores, que são os valores resultantes da multiplicação desses coeficientes pelo valor dos deslocamentos angulares e potências de cada indivíduo, em cada plano de movimento, durante o ciclo da marcha (KIRKWOOD, 2011). Os escores representam a distância que as ondas temporais de cada indivíduo estão da média de uma determinada componente principal. A partir dos escores encontrados, foram realizados testes t pareado para escores com distribuição normal e teste de Wilcoxon nos casos em que a normalidade foi violada,
análises estatísticas foram desenvolvidas no software Minitab versão 14.0 e no SPSS versão 15, com nível de confiança de 5%.
REFERÊNCIAS
AERTS, P.; DE C.D. Deformation characteristics of the heel region of the shod foot during a simulated heel strike: the effect of varying midsole hardness. J. Sports Sci., v.11, n. 5, p. 449-61, 1993.
ALEXANDER, R.M.; BENNET, M. How elastic is a running shoe? New Science, v. 15, p. 45-6, 1989.
ARNDT, A.; WESTBLAD, P.; EKENMAN, I.; LUNDBERG, A. A comparison of external plantar loading and in vivo local metatarsal deformation wearing two different military boots. Gait Posture, v. 18, n. 2, p. 20-6, 2003.
BENNO, M.; NIGG, H.; BAHLSEN, A. Influence of Heel Flare and Midsole Construction on Pronation Supination and Impact Forces for Heel-Toe Running. Int. J. Sport Biomech. v. 4, p. 205-19, 1988.
BERETTA, E.; CIMOLIN, V.; PICCININI, L.; CARLA, T.A.; GALBIATI, S.; CRIVELLINI, M.; et al. Assessment of gait recovery in children after Traumatic Brain Injury. Brain Inj, v. 23, n. 9, p. 751-9, 2009.
CAPPOZO, A.; CROCE, U.D.; LEARDINI, A.; CHIARI, L. Human Movement Analysis Using Stereophotogrammetry. Part 1: Theoretical Background. Gait Posture, v. 21, p. 186-96, 2005.
CAPPOZZO, A. Gait Analysis Methodoly. Hum. Mov. Sci., v. 3, p. 27-50, 1984.
CHEUNG, R.T.; NIGG, G.Y. Influence of different footwear on force of landing during running. Phys. Ther., v. 88, n. 5, p. 620-8, 2008.
CIKAJLO, I.; MATJACIC, Z. The influence of boot stiffness on gait kinematics and kinetics during stance phase. Ergonomics, v. 50, n. 12, p. 2171-82, 2007.
DIXON, S.J.; WATERWORTH, C.; SMITH, C.V.; HOUSE, C.M. Biomechanical analysis of running in military boots with new and degraded insoles. Med. Sci. Sports. Exerc. v. 35, n. 3, p. 472-9, 2003.
ENG, J.J.; WINTER, D.A. Kinetic analysis of the lower limbs during walking: what information can be gained from a three-dimensional model? J. Biomech., v. 28, n. 6, p. 753-8, 1995.
GARD, S.A.; MIFF, S.C.; KUO, A.D. Comparison of kinematic and kinetic methods for computing the vertical motion of the body center of mass during walking. Hum. Mov. Sci., v. 22, n. 6, p. 597-610, 2004.
KIRKWOOD, R.N.; RESENDE, R.A.; MAGALHÃES, C.M.B.; GOMES, H.A.; MINGOTI, S.A.; SAMPAIO, R.F. Application of principal component analysis on gait kinematics in elderly women with knee osteoarthritis. Rev. Bra. Fisioter., v. 15, n. 1, p. 52-58, 2011.
LEWIS, C.L.; FERRIS, D.P. Walking with increased ankle pushoff decreases hip muscle moments. J. Biomech., v. 19, n. 41, p. 2082-9, 2008.
MCKEAN, K.A.; LANDRY, S.C.; HUBLEY-KOZEY, C.L.; DUNBAR, M.J.; STANISH, W.D.; DELUZIO, K.J. Gender differences exist in osteoarthritic gait. Clin. Biomech. (Bristol, Avon), v. 22, n. 4, p. 400-9, 2007.
MCMAHON, T.A. Biomechanics. The spring in the human foot. Nature, Jan., v. 8, n. 325, p. 108-9, 1987.
MENDONÇA, L.D.M.; MACEDO, L.G.; FONSECA, S.T.; ET AL. Comparison of the anatomical alignment of lower limbs between healthy individuals and those with patellar tendinosis. Rev. Bras. Fisioter. 2005 9: 101-107.
NADEAU, S.; GRAVEL, D.; ARSENAULT, A.B.; BOURBONNAIS, D. A mechanical model to study the relationship between gait speed and muscular strength. IEEE Trans. Rehabil. Eng. v. 4, n. 4, p. 386-94, 1996.
NADEAU, S.; GRAVEL, D.; ARSENAULT, A.B.; BOURBONNAIS, D. Plantarflexor weakness as a limiting factor of gait speed in stroke subjects and the compensating role of hip flexors. Clin. Biomech. (Bristol, Avon), n. 14, n. 2, p. 125-35, 1999.
NIGG, B.M.; COLE, G.K.; NACHBAUER, W. Effects of arch height of the foot on angular motion of the lower extremities in running. J. Biomech., v. 26, p. 909-916, 1993.
NIGG, B.M.; SEGESSER, B. Biomechanical and orthopedic concepts in sport shoe construction. Med. Sci. Sports Exerc., v. 24, n. 5, p. 595-602, 1992.
PORTNEY, L.G.; WATKINS, M.P. Foundations of clinical research: Applications to practice. New Jersey: Prentice Hall Health, 3 ed, 2009.
REQUIAO, L.F.; NADEAU, S.; MILOT, M.H.; GRAVEL, D.; BOURBONNAIS, D.; GAGNON, D. Quantification of level of effort at the plantarflexors and hip extensors and flexor muscles in healthy subjects walking at different cadences. J. Electromyogr. Kinesiol., v. 15, n. 4, p. 393-405, 2005.
ROY, J.P.; STEFANYSHYN, D.J. Shoe midsole longitudinal bending stiffness and running economy, joint energy, and EMG. Med. Sci. Sports Exerc., v. 38, n. 3, p. 562-9, 2006.
RUBIN, D.A.; BUTLER, R.J.; BECKMAN, B.; HACKNEY, A.C. Footwear and running cardio-respiratory responses. Int. J. Sports. Med., v. 30, n. 5, p. 379-82, 2009.
SHORTEN, M.R. The energetics of running and running shoes. J. Biomech., v. 26, Suplemento, n. 1, p. 41-51, 1993.
SOUZA, T.R.; PINTO, R.Z.; TREDE, R.G.; KIRKWOOD, R.N.; PERTENCE, A.E.; FONSECA, S.T. Late rearfoot eversion and lower-limb internal rotation caused by changes in the interaction between forefoot and support surface. J. Am. Podiatr. Med. Assoc., v. 99, n. 6, p. 503-511, 2009.
STEFANYSHYN, D.J., NIGG, B.M. Influence of midsole bending stiffness on joint energy and jump height performance. Med. Sci. Sports Exerc., v. 32, n. 2, p. 471-476, 2000.
STEFANYSHYN, D.J.; NIGG, B.M. Mechanical energy contribution of the metatarsophalangeal joint to running and sprinting. J. Biomech., v. 30, n. 11-12, p. 1081-5, 1997.
4 ARTIGO
The influence of shoe stiffness on foot motion and power at the knee joint
during gait.
ABSTRACT
Background: The compression stiffness of the midsole at the forefoot may influence
the kinematics and the kinetics of the lower extremity. It is possible that a midsole with low stiffiness may increase the angular displacement of the foot segmentes and increase the power of the lower extremity.
Method: Three-dimensional kinematics and kinetics data of the lower extremity of 37
healthy subjects, wearing two different levels of forefoot midsole shoe stiffness, were obtained during the stance phase of gait using the Qualisys ProReflex synchronized with a force platform. The dependent variables were: forefoot and rearfoot motion in the frontal and transverse planes; knee and hip motion in the transverse plane; sagittal power at the ankle, knee and hip joints. Data were analyzed by first extracting the total range of motion from the forefoot and rearfoot waveforms and then applying principal component analysis to extract the shape and magnitude differences from the waveforms between conditions.
Findings: Low-stiffness condition had a higher range of motion in the transverse
plane of the forefoot and rearfoot than the high-stiffness condition (α=0.05). The principal component analysis detected magnitude and waveform characteristics that were significantly different between conditions.
Interpretation: The findings suggest the influence of the compression stiffness of the
forefoot midsole on the kinematics of the segments of the foot and on the power generation at the knee joint during the stance of gait. The low-stiffness condition was associated with a delay in the generation of energy during late stance which may negatively influence the performance during gait.
Key words: Shoes; gait; lower extremity; biomechanics.
_________________________________________________________________________
Autores: Renan A Resende, Renata N Kirkwood, Antônio E M Pertence, Sérgio T Fonseca, Paula L.
Silva. Periódico: Clinical Biomechanics ISSN: 0268-0033
1. Introduction
Walking is a common activity chosen by a large group of people as typical
physical exercise. In this context, significant efforts have been made toward
development of better footwear designed to prevent injuries and to improve
performance during physical exercise (Cikajlo and Matjacic, 2007). The focus has
been on efficient transmission of mechanical power produced by the musculoskeletal
system through the footwear and the return of elastic energy from the footwear to the
musculoskeletal system (Cikajlo and Matjacic, 2007). However, the results have
demonstrated the inability of the footwear to return elastic energy to the body
(Alexander and Bennet 1989;McMahon 1987;Turnball 1989). The reason is related to
the type of materials that cushion the footwear, which are usually of low quality as
energy returners (Shorten, 1993). Nigg and Segesser (1992) suggested that shoe
manufacturers should aim to reduce the dissipation of mechanical energy instead of
spending time improving energy return.
The compression stiffness of the shoe midsole on the forefoot may influence
the amount of energy dissipated during gait (Stefanyshyn and Nigg, 2000a). It is
especially important during the late stance phase, since part of the energy generated
by the musculoskeletal system during the push off phase, to accelerate the lower
limb forward, is lost due to the mechanical deformation of the shoe midsole.
Therefore, stiffening the shoe midsole of the forefoot could decrease the amount of
energy lost and improve lower limb progression.
Excessive foot motion, measured as rearfoot inversion/eversion, has been
associated with lower stiffness of the shoe midsole (Morio et al., 2009). A less rigid
midsole would fail to work as a lever arm system for the medial arch of the foot,
maybe contributing to the occurrence of musculoskeletal injuries during gait (Gross et
al., 2007; Levinger and Gilleard, 2007; Mendonça et al., 2005; Viitasalo and Kvist,
1983). A rigid lever system for the medial arch of the foot could reduce foot pronation
and, consequently, decrease knee and hip internal rotation range of motion (Souza et
al., 2009). Therefore, a forefoot midsole with higher stiffness would have positive
effects on the kinematics of the foot complex, possibly preventing lower limb injuries.
The rearfoot midsole of most shoes might contribute to the impact absorption
at the calcaneus, reducing the reaction forces on the lower limb during heel strike.
However, it has been speculated that the compliance required for appropriate
cushioning at the rearfoot may not be appropriated for the demands of the forefoot
(Stefanyshyn and Nigg, 1997), since the foot should function as a rigid lever during
late stance. Most studies that investigated the influence of the stiffness of the midsole
were conducted with shoes composed of a single density midsole designed as hard
(dense) or soft (less dense), which are markedly different from current shoes which
are molded with anisotropic (multiple density) midsoles (Roy and Stefanyshyn, 2006;
Rubin et al., 2009; Stefanyshyn and Fusco, 2004; Stefanyshyn and Nigg, 2000b).
Therefore, the present study investigated two different forefoot midsole
stiffness, high- and low-stifness conditons, on the kinematics and power of the lower
extremity joints during the stance phase of gait. It is hypothesized that walking with a
less stiff shoe of the forefoot would increase total range of motion and the
mechanical power of the lower limb joints during gait. This study will contribute to a
preliminary understanding of the influence of low forefoot midsole stiffness on the
biomechanics of the lower extremity during gait
2. Methods
Thirty seven young healthy subjects (35 females, 2 males) participated in the
study. Inclusion criteria were as follow: age between 18 and 35 years and no history
of surgery or injuries in the lower limbs or lumbar-pelvic complex. The exclusion
criterion was the report of any discomfort during data collection. The participants
signed an informed consent, and this study was approved by the Ethics Research
Committee of the Universidade Federal de Minas Gerais, under the number: ETIC
0047.0.203.000-10.
2.2. Footwear
Two identical pairs of commercial shoes specially designed for walking, with a
midsole composed by ethylene vinyl acetate - EVA rubber, size 7.5, were used in the
study. The tongues of the shoes were removed to allow the placement of a cluster
with three passive markers over the forefoot. An opening was cut at the back part to
allow the placement of a rearfoot cluster with three markers over the calcaneus. The
opening was surrounded by velcro to close the back of the shoe to ensure firmness
during gait.
To decrease the stiffness of the forefoot midsole of one of the pairs of the
shoe referred as the low-stiffness condition, four 6 mm² holes were drilled in the
corners of each square centimeter of the forefoot (length of 12 cm, width of 10 cm).
The other pair of shoes remained with the manufacturer’s stiffness and is referred in
the present study as the high-stiffness condition.
The stiffness of each pair of forefoot midsole was determined by removing the
upper part of the shoes and applying, in the circular central area of 706.5 mm², a
force of 98.2 N. The force device consisted of a metal rod fixed on a structure with
negligible mass. Above the metal rod, a metric dial indicator was placed with an
deformation of the midsole after the application of the force was measured by the dial
indicator. Three trials were performed on each midsole and the mean and standard
deviations of the trials were obtained. The compression stiffness of the forefoot
midsole was determined as the ratio of the applied force by the deformation of the
midsole, and it was measured in newtons per millimeter. The low-stiffness shoe had
a forefoot midsole mean value of 29.8 N/mm (SD = 0.54) and the high-stiffness shoe
a mean value of 49.1 N/mm (SD = 0.58). The compression stiffness of the forefoot
midsole of both low and high stiffness shoe conditions was measured after data
collection.
2.3. Instrumentation and experimental design
Three-dimensional kinematic and kinetic data of the lower extremity were
measured during the stance phase of gait with an eight-camera motion analysis
system (Qualisys ProReflex Medical AB, Gothenburg, Sweden) synchronized with
one force plate (AMTI – Advanced Mechanical Technology, OR6-6 model,
Watertown, MA, USA) placed in the center of a 10-meter walkway.
Anatomical markers and clusters of tracking markers were used to determine
the coordinate system of the segments and motion at the pelvis, thigh, shank,
rearfoot and forefoot (Souza et al., 2009), according to the recommendations for
minimizing soft tissue artefacts (Chiari et al., 2005; Manal et al., 2000; Schache et al.,
2008). A reference position for both conditions, considered the neutral position for the
foot segments and tibia, was obtained during a barefoot bipedal standing trial.
Anatomical markers over the foot were placed on the following locations: lateral and
medial malleolus, sustentaculum tali, peroneal tuberosities and at the base and
heads of the first and fifth metatarsals. The anatomical markers at the foot were used
and for the rearfoot. Forefoot and rearfoot motions were measured with a rigid cluster
firmly attached to the top of the second metatarsal and another cluster attached
exclusively to the calcaneus.
For the knee and hip motion in the transverse plane and the power of the
ankle, knee and hip in the sagittal plane, two standing trials were performed, one for
each type of midsole (low-stiffness and high-stiffness). In each condition, the
reference position was obtained while standing with the given shoes. For dynamic
analysis of gait, the subjects walked on an 8-meter walkway (six trials) in their
self-selected speed. The order of data collection using the high or low-stiffness shoe was
randomized.
A pilot test was conducted with ten subjects to define the test-retest reliability
of the examiner on the measurements taken during the study. The results
demonstrated test-retest reliability from moderate to excellent with an average
intra-class correlation coefficient of 0.77 (SD 0.12).
2.4. Analysis and dependent measures
The software Visual 3D (C-Motion, Inc., Rockville, USA) was used to calculate
the following kinematic and kinetic variables: forefoot adduction-abduction (Z-axis)
and inversion-eversion (Y-axis) represented by the motion of the forefoot relative to
the shank – positive values for adduction and inversion, rearfoot adduction-abduction
(Z-axis) and inversion-eversion (Y-axis) represented by the motion of the rearfoot
relative to the shank – positive values for adduction and inversion, knee
internal-external rotation represented by the motion of the shank relative to the thigh –
positive values for internal rotation and hip internal-external rotation represented by
the motion of the thigh relative to the pelvis – positive values for internal rotation -
the six trials, for each subject, were considered for analysis. The stance phase was
determined by the contact and lack of contact of the foot on the force plate. Data
were collected at a frequency of 120 Hz and filtered with a Butterworth low-pass filter
with a cut-off frequency of 6 Hz (Winter, 2005). Kinematic and kinetic data were
interpolated to 101 data points, with each data point representing 1% of the stance
phase.
2.5. Statistical analysis
The normality of the data was tested using the Kolmogorov-Smirnov and the
Shapiro-Wilk tests. Paired Student’s t-test for parametric data and Wilcoxon Test for
non-parametric data were performed to detect differences between low and
high-stiffness conditions for the total ROM extracted from the forefoot and rearfoot in the
frontal and transverse planes.
2.6. Principal component analysis
Principal component analysis (PC) was applied to the gait waveforms for both
high and low-stiffness conditions (Deluzio and Astephen, 2007; Kirkwood et al.,
2011). An n by p matrix, 72 participants by 101 variables representing 0 to a100% of
the gait stance phase, was used in the analyses at each plane of motion. The matrix
was first transformed into a covariance matrix, which contains the variability of the
data. To maximize the variance, the mean for each variable was subtracted from the
corresponding variable value. Then, the PCs were extracted from the covariance
matrix through a method called diagonalization that realigns the data into a new
coordinate system. The new coordinate system are called principal components or
loading vectors and the maximum number of loading vectors is 101, or the number of
time points of the gait cycle. The components are ordered according to the amount of
proportion of variation explained, followed by the subsequent PCs. A criteria of 90%
of variance explained was used to determine the number of PCs to retain for data
analysis (Deluzio and Astephen, 2007).
The principal components scores are represented by the individual elements
that compose the loading vectors. Therefore, the numbers of scores are equal to the
number of the sample size studied, and the scores represent the distance each
individual is from the mean of one specific component. The scores are important in
describing what these components of variation mean in terms of the characteristics of
specific groups or cases. The higher the score the more correlated the subject’s
waveform is with a specific PC. Therefore, further analysis can be performed to
determine differences between groups.
In the present study, the scores were analyzed for difference between stiffness
conditions using Paired Student’s t-tests for parametric data and Wilcoxon test for
non-parametric data, with Bonferroni correction. To interpret the components, two
waveforms were created based on the mean waveform +/- one standard deviation of
the PC scores times the loading vector for each PC (Ramsay and Silverman, 1997).
All the data was analyzed with a significance level of 0.05.
3. Results
3.1. Range of motion analysis
Data from one subject were discarded due to poor quality; therefore, thirty-six
(36) healthy young subjects, with an average age of 24.3 years (SD 2.9), mass and
height of 65.5 kg (SD 8.3) and 169 cm (SD 5.2), respectively, participated in the
study. The low- and high-stiffness condition had an average gait velocity of 1.31 m/s
(SD 0.15) and 1.32 m/s (SD 0.15), respectively, and this difference was not
transverse plane (adduction/abduction), was significantly higher for the low-stiffness
condition across the stance phase of gait (Table 1). For the forefoot the difference
between conditions was 1.9º (SD 3.1), and 1.0º (SD 1.9) for the rearfoot. In the
frontal plane (inversion/eversion), the total ROM showed no statistically significant
difference in the forefoot and rearfoot between shoe conditions (Table 1).
3.2. Principal component analysis
The PC analysis demonstrated differences between conditions at the forefoot
and rearfoot in the frontal plane and at the power of the knee. The significant PC
scores between high and low stiffness midsole condition and their respective
interpretation are provided in Table 2. The waveform data for each gait measure
along with the PC loading vectors and its interpretation are shown on Figs. 1-3.
At the forefoot, PC1 captured the largest source of variation in the data
(85%), in a total of 91.2% explained by two PCs (Table 2 and Fig. 1). PC1 loading
vector had positive coefficients throughout the entire stance (Fig. 1B). As seen in
previous studies, this describes an overall magnitude feature in the data (Deluzio
and Astephen, 2007; Linley et al., 2010). Therefore, PC1 captured a measure of the
average angle throughout stance phase. Examination of gait waveforms
corresponding to the mean waveform and the high and low curves created based on
the mean waveform +/- one standard deviation of the PC1 score times the loading
vector for each PC1 are shown on Fig. 1C. The low and high curves support this
interpretation, showing that the low-stiffness condition increased the forefoot
inversion angle compared to the high stiffness shoe condition. The statistical
analysis of the PC1 scores revealed that the low-stiffnesscondition presented higher
forefoot inversion during the stance phase of the gait cycle compared to the
A different magnitude in the rearfoot movement in the frontal plane was also
found (Table 2 and Fig. 2). Two PCs explained 94.9% of the variance and PC1
captured the largest source of variation in the data (89.4%). Only PC1 was
significant and showed positive values of approximately the same magnitude during
the stance phase of the gait cycle (Fig. 2B). The low-stiffnesscondition had a higher
rearfoot inversion during the stance phase of gait cycle than the high-stiffness
condition (p = 0.013, α=0.025). Examination of gait waveforms on Fig. 2C supports
this interpretation.
Power analysis at the knee joint in the sagittal plane was different between the
shoe conditions. Three PCs explained 93.1% of the variance but only PC2 was
significant and explained 9.1% of the variance. PC2 measured the timing and peak
of power during early stance relative to mid-stance and terminal stance relative to
pre-swing (p=0.010, α=0.017). The loading vector corresponding to PC2 revealed a
peak during terminal stance (Fig. 3B) and the gait high and low curve waveforms
created revealed that the low-stiffness condition had a delay in timing and a lower
positive peak power during late stance compared to the high-stiffnesscondition (Fig.
3C).
4. Discussion
The results of this study demonstrated that reducing forefoot midsole stiffness
increased forefoot and rearfoot total ROM in the transverse plane during the stance
phase of walking. In addition, PCI analyses demonstrated that the low-stiffness
condition increased the inversion angle at the forefoot and rearfoot when compared
to the high-stiffness condition during gait stance. The present study also identified a
delay in timing and a decrease in the magnitude of the knee power during late stance
The increase in the total ROM of adduction/abduction in the transverse plane
of the forefoot may be attributed to the shoe’s lower forefoot midsole stiffness. As the
forefoot contacts the ground and the foot reaches full support during mid-stance, the
midsole influences the amount of movement of the foot segments, because it is
located between the foot and the ground. In the present study, the reduced forefoot
midsole stiffness offered less mechanical support to the forefoot adduction/abduction
movements, especially during the mid- and late stance, which contributed to the
increased total ROM. Since some gait injuries are often related to excessive motion
of the foot segments (Gross et al., 2007; Levinger and Gilleard, 2007; Mendonça et
al., 2005; Tiberio, 1988; Viitasalo and Kvist, 1983), the results of the present study
suggest that shoes with low-stiffness forefoot midsole may contribute to the
development of some lower extremities musculoskeletal injuries.
Similarly to the forefoot, the total rearfoot ROM in the transverse plane was
significantly greater during the low-stiffness condition. This kinematic change
suggests that distal factors, such as lower stiffness of the forefoot midsole, may
affect lower-extremity mechanics during walking (Souza et al., 2009). During the
stance phase of walking, the rearfoot normally moves from an initial adduction
position at initial contact toward abduction. At mid-stance the rearfoot motion
normally reverses and begins to adduct until toe off (Hunt and Smith, 2004). It has
been proposed that hypermobility of the first ray reduces the stiffness of the medial
arch of the foot and increases the amount of rearfoot motion (Allen et al., 2004). The
reduced forefoot midsole stiffness, seems to produce the same effect. Hence, without
a rigid support, rearfoot abduction may be prolonged past mid-stance. The results
suggested that the low-stiffness forefoot midsole condition might have contributed to
observed increase in rearfoot total ROM in the transverse plane. Similarly, Hamill et
al. (1992) reported a significant decrease in maximum rearfoot eversion angles
during running with hard and medium midsole conditions compared with a soft
midsole. However, in the study by Hamill et al. (1992), the whole length of the
midsole stiffness was changed, while in the current study changes were made only at
the forefoot. This fact emphasizes the possible contribution of the forefoot midsole
stiffness to the occurrence of excessive rearfoot motion.
The magnitude of the inversion angle at the forefoot and rearfoot during the
stance phase of gait was also affected by the low-stiffness condition. This finding was
not in accordance with our expectations that the lower forefoot midsole stiffness
would increase the magnitude of eversion of the segments of the foot. However, the
greater inversion angles occurred at the initial contact phase of walking, when the
lower forefoot midsole stiffness could not influence the kinematics of the lower
extremity (as the forefoot had not contacted the ground). Possibly, other factors not
evaluated in the present study, such as the kinematics of the contralateral lower limb
and the line of progression of the body, influenced the increased magnitude of
inversion during the low-midsole stiffness condition.
The PCI analyses have shown a delay and a decrease in the positive power
peak at the knee joint during late stance in the low-stiffness condition. Based on
studies from muscle-based simulations, which demonstrated that the plantar flexors
produce nearly all the work in late stance, our findings are consistent with net joint
power analyses using inverse dynamics (Meinders et al., 1998; Winter, 1983).
According to Zajac and Gordon (1989), the force generated by the muscles not only
accelerates the segments and the joints it spans, but also the distal and proximal