Submitted11 June 2016 Accepted 24 August 2016 Published21 September 2016
Corresponding author Siow-Wee Chang, siowwee@um.edu.my, changsiowwee@gmail.com Academic editor Kenta Nakai
Additional Information and Declarations can be found on page 12
DOI10.7717/peerj.2482
Copyright 2016 Tan et al.
Distributed under
Creative Commons CC-BY 4.0
OPEN ACCESS
A genetic programming approach to oral
cancer prognosis
Mei Sze Tan1, Jing Wei Tan1, Siow-Wee Chang1, Hwa Jen Yap2,
Sameem Abdul Kareem3and Rosnah Binti Zain4
1Bioinformatics Program, Institute of Biological Sciences, Faculty of Science, University of Malaya,
Kuala Lumpur, Malaysia
2Department of Mechanical Engineering, Faculty of Engineering, University of Malaya, Kuala Lumpur,
Malaysia
3Department of Artificial Intelligence, Faculty of Computer Science & Information Technology, University of
Malaya, Kuala Lumpur, Malaysia
4Oral Cancer Research & Coordinating Centre (OCRCC), Faculty of Dentistry, University of Malaya,
Kuala Lumpur, Malaysia
ABSTRACT
Background. The potential of genetic programming (GP) on various fields has been attained in recent years. In bio-medical field, many researches in GP are focused on the recognition of cancerous cells and also on gene expression profiling data. In this research, the aim is to study the performance of GP on the survival prediction of a small sample size of oral cancer prognosis dataset, which is the first study in the field of oral cancer prognosis.
Method. GP is applied on an oral cancer dataset that contains 31 cases collected from the Malaysia Oral Cancer Database and Tissue Bank System (MOCDTBS). The feature subsets that is automatically selected through GP were noted and the influences of this subset on the results of GP were recorded. In addition, a comparison between the GP performance and that of the Support Vector Machine (SVM) and logistic regression (LR) are also done in order to verify the predictive capabilities of the GP.
Result. The result shows that GP performed the best (average accuracy of 83.87% and average AUROC of 0.8341) when the features selected are smoking, drinking, chewing, histological differentiation of SCC, and oncogene p63. In addition, based on the comparison results, we found that the GP outperformed the SVM and LR in oral cancer prognosis.
Discussion. Some of the features in the dataset are found to be statistically co-related. This is because the accuracy of the GP prediction drops when one of the feature in the best feature subset is excluded. Thus, GP provides an automatic feature selection function, which chooses features that are highly correlated to the prognosis of oral cancer. This makes GP an ideal prediction model for cancer clinical and genomic data that can be used to aid physicians in their decision making stage of diagnosis or prognosis.
SubjectsComputational Biology, Oncology, Computational Science
Keywords Genetic Programming, Oral cancer prognosis, Machine learning, Feature selection
INTRODUCTION
(cheeks), and lips (National Institute of Dental and Craniofacial Research, 2016). According to the Oral Cancer Research and Coordinating Centre (OCRCC) in the University of Malaya, there are 350,000 new cases of oral cancer reported worldwide every year, bringing oral cancer to the rank of the 6th most common cancer in the world. In Malaysia, oral cancer is ranked the third most common cancer amongst the Indian Ethnic group and constitutes 13.2% of the cancer in Malaysia as reported by the National Cancer Registry (NCR) 2007 (Omar & Ibrahim Tamin, 2011).
The risk factor of oral cancer includes heavy use of tobacco, alcohol and betel quid. Besides that, the practice of imbalance diet i.e., the low intake of antioxidant-rich food may also cause the development of oral cancer. Some genetic factors, such as p53 and p63, have been found to be associated with oral cancer.
Various machine learning models, such as the Genetic Algorithm (GA), the Artificial Neural Network (ANN) and the Support Vector Machine (SVM), can actually ‘‘be trained’’ and ‘‘learn’’ from the given data in order to execute many functions. In the bio-medical field, most of these machine learning approaches are commonly used for pattern recognition, diagnosis and prognosis of diseases.
In this research, a machine learning approach, namely Genetic Programming (GP), is applied for oral cancer prognosis. Many recent studies have explored the functionality of GP in cells recognition (Dong, 2008;Nandi et al., 2006) or in gene expression profiling data (Hong & Cho, 2006;Mitra et al., 2006;Ho et al., 2006). However, the potential of GP in the classification of cancerous data for cancer prognosis purposes remain unclear. Based on our review, this is the first study that applied the GP technique in the oral cancer prognosis research. The main objective of this research is to study the feasibility of using GP as a feature selection and classification tool in a small dataset that contains limited number of data and variables. For benchmarking purposes, the prediction of 3-year oral cancer prognosis using GP is compared with SVM, a machine learning technique, and also logistic regression, a statistical method.
Most biomedical data samples are usually small in size but consist of many variables. This may cause over-fitting problem in the classification as the accuracy may be affected by the irrelevant features. Thus, feature selection steps should be taken before the classification steps in order to increase the accuracy of the results. Although the dataset involved in this research is small in size and does not contain many variables, the aim is to study the performance of GP the small subset of features in order to obtain the optimal result.
BACKGROUND STUDY
GP breed populations of hundreds or thousands of computer programs using the Darwinian principal of survival and reproduction of the fittest, together with genetic operations during the process of evolution, namely, mutation and crossover. Thus, in general, GP solves the problems given by the combination of natural selection and genetic operations. There are many tasks that can be performed by using GP. InMitra et al. (2006), the research was carried out to identify the nodal status in bladder using gene expression profiles analysis. This research used GP as a method to generate classifier rules in order to determine the nodal status. The authors identified genesICAM 1, MAP2K6, KDR, CDK8
andANXA5involved in the expression of the positive node case.
Yu et al. (2007)proposed a method to applied GP in cancer expression profiling data to select gene features and build a molecular classifier by applying mathematical integration of the genes. The result of this research revealed that there is a set of highly significant feature genes that are repetitively associated with prostate cancer. Also, in this paper, the accuracy of GP classification is compared with other machine learning techniques, such as, compound covariate 3-Nearest Neighbor, Support Vector Machine, DLC and etc. The results showed that GP has a lower error rate (1.5% using 5 genes) as compared to other methods.
There are a some studies that use GP in Breast Cancer studies. InVanneschi et al. (2011), the author compared the accuracy of several machine learning classifiers with GP using NKI Breast Cancer Dataset showing that GP performs significantly better than other methods in classifying breast cancer dataset and also comparable with the scoring-based method of the 70-gene signature. On the other hand,Guo & Nandi (2006)used GP as the feature selection method in their research. The authors compared the result of breast cancer diagnosis using the features generated by GP based on the criteria of various pattern recognition methods. The results of this research indicated that Modified Fisher Criterion-based GP (MP_GP) performed better than the other GP-based features extractor (Guo & Nandi, 2006).
Furthermore, GP is proved to be applicable in drug discovery. According toArchetti et al. (2007), GP is useful in predicting the pharmacokinetic of drug, which is the movement of drug in the human body. The authors reviewed the functionality of GP in the pharmacokinetics of drug, as well as comparing the ability of GP to predict oral bioavailability (RMSE of 30.1276), median oral lethal dose (RMSE of 1776.7700) and plasma-protein binding levels (RMSE of 34.6617) with other types of machine learning method.
Almost all of the studies involved GP in genomic and cancer data are done using microarray datasets which consists of microarray gene expression data and are larger in size. The only exception of GP application using non-microarray dataset was from
Table 1 Features available in the oral cancer prognosis dataset.
Feature
Age (Age)
Ethnicity (Eth)
Gender (Gen)
Smoke (Smo)
Drink (Dri)
Chew (Chew)
Site (Site)
Histological differentiation of SCC (Diff)
Pattern of invasion (Inv)
Nodes (Nodes)
PT (PT)
PN (PN)
Stage (Sta)
Size (Size)
Treatment (Tre)
p53 (p53)
p63 (p63)
obtained using selected features dropped slightly (WBC-96.84% and WDBC-96.31%) while compared with the accuracy of using all features (WBC-97.42% and WDBC-97.26%). The authors claimed that the performance of their proposed method in using a smaller subset of features is comparable with that of all features and producing similar results.
In this research, however, a small locally collected dataset is used in order to review the performance of GP in small-sized dataset. We would like to test the feasibility of applied GP in a small dataset, whether GP could maintain its stability and obtain the good results that archived by using microarray datasets in the previous studies, and to test the suitability of GP as feature selection and classification tool in a small dataset.
MATERIALS AND METHOD
Data
A total of 31 oral cancer cases of 3-year prognosis were collected from the Malaysia Oral Cancer Database and Tissue Bank System (MOCDTBS) coordinated by the OCRCC, Faculty of Dentistry, University of Malaya. The procedures of data acquisition are the same as described inChang et al. (2013). There are 17 features in the dataset, which are listed in theTable 1. Each case was followed up for three years from the date of the time when oral cancer was diagnosed. The outcome for each case is either dead or alive at the end of the three years.
Genetic Programming
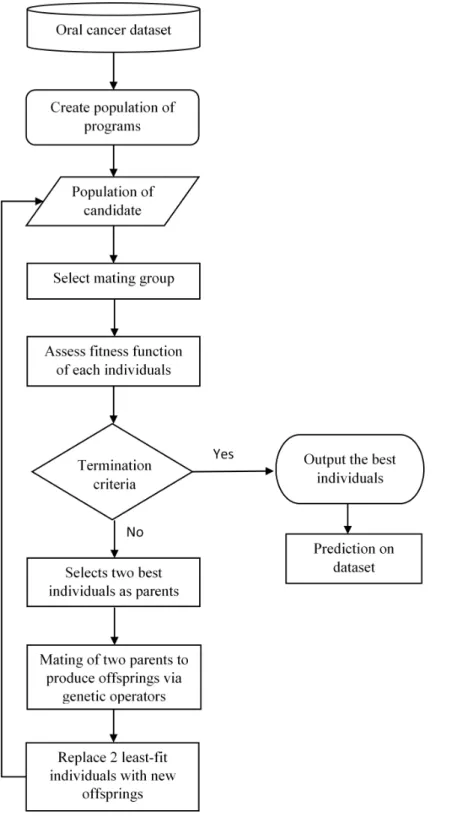
GP calculates the fitness of each member in the population and generates generations of offspring to compete with the parents in order to obtain the best individuals in the populations (in this study, the best prediction result).Figure 1shows the framework of the proposed oral cancer prognosis by using genetic programming.
Basically, GP is initiated by the interactions between the randomly selected inputs with the function operators, for instances, boolean and arithmetic operator, to compose an individual tree structure. The accumulations of these individual will form the initial population and the selection from these populations will form a small subgroup known as the ‘‘mating group.’’ The fitness function for each individual in this small population is evaluated. The two fittest individuals in this generation are selected for ‘‘mating’’ or act as the parents for the next generation to produce ‘‘offspring,’’ usingmutationandcrossover
operators as the selective genetic operator. Then, a new generation is formed by replacing the generated offspring with the least-fit parents in the population until all the parent members in the population are fully replaced. This process of evaluating every member of the population, mating, and producing replacement offspring is looped over generations until a termination criterion, is reached, (i.e., the maximum number of generations) which is predefined firstly by the user of the program.
The aim of this genetic program is to obtain the best individual from the population with the best fitness value and the best result, which is the predicted outcome that generated by GP using the small oral cancer dataset that described earlier in this study. The predicted results were then compared with the three-year survival rate of the oral cancer dataset in order to determine the accuracy of the results. This is a crucial step involved in the cancer prognosis research as the more accurate the predicted result is, the higher the feasibility of applied GP in the prognosis of cancer especially in the small dataset.
In this research, GPLAB (Silva & Almeida, 2003) is used. GPLAB is a genetic program-ming toolbox, which runs in the MATLAB environment. GPLAB provides GP function to different users at various levels of depth and insight as the architecture of GPLAB is highly modular and parameterized in structure. There are three main operation modules in GPLAB (GEN POP, GENERATION, and SET VARS). By manipulating the three modules, users can control the path of execution of the program and thus obtain the best results.
Table 2 Parameters used in this research. GP parameters
Population size 31
Population initiation ‘rampedinit’
Maximum number of generation 5
Selection method Tournament (size = 0.0100)
Crossover rate 0.01
Mutation rate 0.01
SVM parametersa
Types of kernel Radial basis function
gamma (γ) parameter 0.06
cost (c) penalty 1
epsilon parameter 0.001
Weight (w) vector 1
Notes.
aSVM parameter: gamma (γ) parameter determines the boundary of RBF kernel in which the kernel will be exceed a certain
value; cost (c) penalty function to control the tradeoff between the two requirements, i.e., the margin of the SVM hyperplane depends on thecpenalty; epsilon parameter determines the level of accuracy of the function; weight (w) parameter is ann -dimensional coefficient vector which is normal to the hyperplane
The GP parameters used in this study are showed inTable 2. The study was carried out by using population that ranged between 15 individuals to 100 individuals. However, the results obtained showed that the population with 31 individuals had a more stable results (i.e., less outlier individual with extreme fitness value during the final generation). In addition, a maximum generation of 5 was used in this study as the average fitness of the members in the population became constant after 5 generations.
Support Vector Machine
Support Vector Machine (SVM) (Vapnik, 2000) is a classification method that performs task by constructing a multidimensional space of hyperplanes that separate cases of different class labels. SVM is associated with learning algorithms that analyze data and recognize pattern, and support regression and classification tasks that can deal with multiple, continuous and categorical variables. Generally, SVM apply the kernel methods to produce a high dimensional data and construct the maximum-margin hyperplane. SVM works well with high dimensional microarray dataset. The goal of SVM is to find separating hyperplane with the largest margin (Hsu, Chang & Lin, 2003;Rosset et al., 2004;Huang & Kecman, 2005).Table 2shows the parameters of SVM used in this research.
Logistic Regression
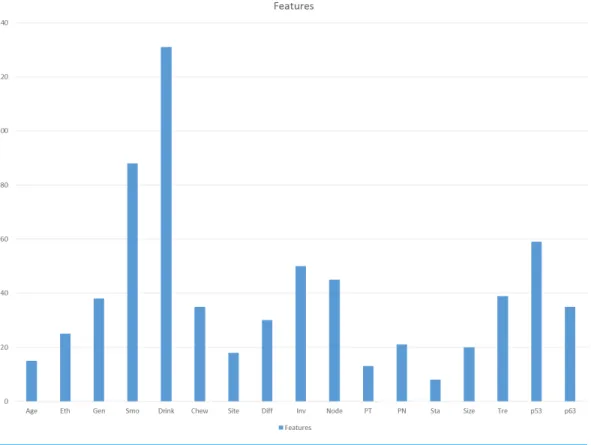
Figure 2 Frequency of each feature selected by GP in 20 runs.
RESULTS
Due to the automatic feature selection of GP, the features selected by GP in each run may not be the same. Therefore, in order to study the influence of each feature towards the prediction, a two-step method was used in this research.
First, the GP was tested for 20 times using all the features in the dataset and the frequency of the feature selected in 20 runs was calculated. Higher frequency of features selected by GP in 20 runs indicates that the features hold a more important rank in the prediction compared to the others.Figure 2shows the frequency of features selected by the GP in 20 runs. The top 10 features were selected for step 2. The 10 selected features areDri, Smo, p53, Inv, Node, Tre, Gen, p63, Chew andDiff.
Table 3 Best results on selected feature subsets using normal GP and Operator Equalisation GP.
No. of feature
Feature subset Normal GP OpEq GP
Average accuracy (%)
Root Mean Square Error (RMSE)
Average AUROC
Average accuracy (%)
Root Mean Square Error (RMSE)
Average AUROC
10 Eth Smo Dri Chew Diff Inv Node Tre p53 p63 67.74 0.4675 0.6477 67.74 0.5957 0.6559
9 Eth Smo Dri Chew Diff Inv Tre p53 p63 77.42 0.5165 0.7432 69.68 0.4069 0.6995
8 Eth Smo Dri Chew Diff Inv p53 p63 67.74 0.6947 0.6682 64.19 0.4478 0.6648
7 Eth Smo Dri Chew Diff Inv p63 80.65 0.5681 0.7786 78.39 0.6956 0.7589
6 Smo Dri Chew Diff Inv p63 64.52 0.5957 0.6432 63.87 0.5191 0.6300
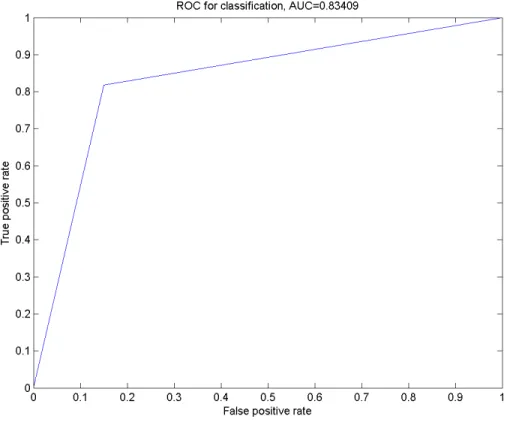
5 Smo Dri Chew Diff p63 83.87 0.4160 0.8341 81.29 0.5602 0.8100
4 Smo Chew Diff p63 67.74 0.4600 0.6886 57.42 0.5680 0.6270
3 Smo Diff p63 67.74 0.5598 0.6886 60.32 0.3548 0.6414
2 Smo p63 64.52 0.5161 0.5000 60.65 0.4366 0.5150
Figure 3 The ROC curve for the classification using Smo Dri ChewDiff p63 as the selected features.
Table 4 Best results of SVM on the selected feature subsets.
No. of feature Feature subset SVM
Average accuracy (%)
Root Mean
Square Error (RMSE)
Average AUROC
10 Eth Smo Dri Chew Diff Inv Node Tre p53 p63 64.76 0.4000 0.5000
9 Eth Smo Dri Chew Diff Inv Tre p53 p63 64.76 0.4000 0.5000
8 Eth Smo Dri Chew Diff Inv p53 p63 64.76 0.4000 0.5000
7 Eth Smo Dri Chew Diff Inv p63 64.76 0.4000 0.5000
6 Smo Dri Chew Sub Diff p63 61.43 0.6000 0.4750
5 Smo Dri Chew Diff p63 64.76 0.4000 0.5000
4 Smo Chew Diff p63 64.76 0.4000 0.5000
3 Smo Diff p63 64.76 0.4000 0.5000
2 Smo p63 61.43 0.4000 0.5000
Table 5 Best results of logistic regression for the selected feature subsets.
No. of feature Feature subset Logistic regression
Accuracy (%) Root Mean Square Error (RMSE) AUROC
10 Smo Dri Chew Site Diff Nodes PT Sta Size Tre 64.5161 0.7315 0.5
9 Smo Dri Chew Site Diff PN Sta Size Tre 64.5161 0.7304 0.5
8 Age Smo Site Sub Nodes PT PN Sta 64.5161 0.7303 0.5
7 Age Smo Site Nodes PT PN Sta 64.5161 0.7303 0.5
6 Chew PT PN Sta Tre p63 64.5161 0.7293 0.4545
5 Gen Chew Inv Nodes PN 61.2903 0.7265 0.7
4 Age Gen Chew Size 54.8387 0.7260 0.65
3 Eth Gen Inv 51.6129 0.7305 0.625
2 Inv p53 51.6129 0.7301 0.625
Besides that, each feature subset in Table 3were tested with SVM.Table 4shows the best results of SVM on the selected feature subsets. FromTable 4, it can be seen that the performance of SVM is slightly inferior compared to GP in oral cancer prediction as the best accuracy achieved is merely 64.76%, and there are not much differences in between the selected feature subsets.
Besides that, the performance of GP is also compared with the performance of the simple statistical method, which is logistic regression, using the same data. Combinations of feature subsets that ranged from 2∧17 until 10∧17 were tested accordingly in this study,
in order to obtain the subsets of features with the best accuracy, AUROC and also the lowest root mean square error (RMSE).Table 5shows the best result of logistic regression for the selected features subsets.
DISCUSSIONS
However, it can be seen that the accuracy of the prediction dropped to 64.52% when there is an extra feature included (Inv) and dropped to 67.74% when there is a feature excluded (Dri) from the optimal feature subset ofSmo, Dri, Chew,Diff and p63. This showed that these five features are correlated to each other in order to achieve the best result. Two of the features selected from this study are correspondent with the features selected by Chang et al. (2013), which areDriandp63. This further proved that GP is suitable to use in the oral cancer prognosis with its automatic feature selection function that could identify the optimal feature subset.
As seen inTable 4, when comparing the results of the stated methods, GP performed better than the SVM in all selected feature subsets and the best result was obtained from GP. This shows that GP outperforms SVM, even though SVM has been proven to be a good predictive technique in various previous researches (Sweilam, Tharwat & Moniem, 2010;Zheng, Yoon & Lam, 2014;Majid et al., 2014). However, in the case of predicting the survival of oral cancer, SVM is not an appropriate classification tool to be used together with a small dataset.
FromTable 5, the best accuracy obtained from logistic regression method is 64.5161% with AUROC of 0.5 and RMSE of 0.7303. By comparing the results of logistic regression method with GP, it can be clearly seen that the machine learning technique GP outperformed the logistic regression method when testing with small dataset.
Smoking is always associated with the poor prognosis of oral cancer. Based on previous studies, the probability of having oral cancer among smokers is higher than in non-smokers. Tobacco leaves that are used to make cigarettes contain radioactive materials and nicotine, an additive substance. Nicotine may cause cell mutation, damaging the DNA and thus causing oral cancer (Oral Cancer Foundation, 2016). Previous studies showed that some cellular functions such as mitogenic pathway activation, angiogenesis, and cell growth of various cell types, could be altered by nicotine (Xu et al., 2007;Arredondo et al., 2006). In fact, the risk of oral cancer gets even higher when the smoker is also an alcohol drinker at the same time (Wright et al., 1993;Blot et al., 1988;Vecchia et al., 1997). The association of drinking alcohol with oral cancer has been proven by many previous studies that showed that the excess intake of alcohol will decreases the endocytic activity of the buccal mucosa cell inside the mouth (Chang et al., 2013;Loyha et al., 2012). Furthermore, the chewing of betel quid is also often related to the occurrence of oral cancer, especially for the long-term chewer. It has been showed that the chemical component of the areca nut will trigger the carcinogenicity mechanism in the oral cavity (Ogden, 2005).
the histological differentiation of SCC, especially in the poorly differentiated group of SCC (Lee et al., 2008). Again, these proved that the factors are correlated to each other.
Finally, according toChang et al. (2013)andChoi et al. (2002), the over-expression of p63 gene is often associated with the poor prognosis of oral cancer. InMuzio et al. (2005), 10 cases of normal mucosa and ninety-four cases of oral squamous cell carcinoma were analyzed with active expression of p63 expression by immunohistochemistry technique. The study suggested that p63 expression is positively associated with the grade of neoplasm differentiation which support the use of p63 in diagnostic use of oral SCC as an additional marker. However,Oliveira, Ribeiro-Silva & Zucoloto (2007)found out that p63 positive tumor inversely had a higher Disease-Free-Survival (OS) and Overall Survival (OS) in OSCC patients. In our study, p63 is selected as one of the optimum features based on the weightage of each features that correlated to OSCC. Hence, we suggested that p63 could be employed as one of the markers in oral cancer prognosis.
CONCLUSION
In this study, we presented an oral cancer prognosis method using the GP approach. In addition, in order to consolidate the results obtained in our research, comparison of the prediction performance of GP, SVM and LR were also carried out. The results showed that GP stands out to be comparably better than SVM and LR with the highest accuracy of 83.87 and AUROC of 0.8341. Also, the unique features of GP in automatically selecting the features proofs that the correlation of the features are also crucial in the classification process. The optimal features that are obtained from the GP model isSmo, Dri, Chew, Diff and p63.
However, further studies need to be done especially on the biological perspective of the correlation between each feature to show how are these relationship can help in improving the prognosis of oral cancer.
ACKNOWLEDGEMENTS
The authors would like to thank the OCRCC, Faculty of Dentistry, University of Malaya for providing the dataset and the related documents for this project.
ADDITIONAL INFORMATION AND DECLARATIONS
Funding
This study was supported by the University of Malaya BKP Grant with the project number of BK041-2014. The funders had no role in study design, data collection and analysis, decision to publish, or preparation of the manuscript.
Grant Disclosures
Competing Interests
The authors declare there are no competing interests.
Author Contributions
• Mei Sze Tan conceived and designed the experiments, performed the experiments,
analyzed the data, wrote the paper, prepared figures and/or tables.
• Jing Wei Tan conceived and designed the experiments, wrote the paper.
• Siow-Wee Chang conceived and designed the experiments, analyzed the data, contributed
reagents/materials/analysis tools, wrote the paper, prepared figures and/or tables, reviewed drafts of the paper, data collection.
• Hwa Jen Yap analyzed the data, contributed reagents/materials/analysis tools, wrote the
paper, reviewed drafts of the paper.
• Sameem Abdul Kareem contributed reagents/materials/analysis tools, wrote the paper,
reviewed drafts of the paper.
• Rosnah Binti Zain contributed reagents/materials/analysis tools, wrote the paper,
reviewed drafts of the paper, data collection.
Human Ethics
The following information was supplied relating to ethical approvals (i.e., approving body and any reference numbers):
This research was approved by Medical Ethics Committee, Faculty of Dentistry, University of Malaya.
Data Availability
The following information was supplied regarding data availability:
The raw data was made available for peer review but cannot be published because it is owned, and restricted by, the Malaysia Oral Cancer Database and Tissue Bank System (MOCDTBS).
REFERENCES
Archetti F, Lanzeni S, Messina E, Vanneschi L. 2007.Genetic programming for compu-tational pharmacokinetics in drug discovery and development.Genetic Programming and Evolvable Machines8:413–432DOI 10.1007/s10710-007-9040-z.
Arredondo J, Chernyavsky AI, Jolkovsky DL, Pinkerton KE, Grando SA. 2006.
Receptor-mediated tobacco toxicity: cooperation of the Ras/Raf-1/MEK1/ERK and JAK-2/STAT-3 pathways downstream ofα7 nicotinic receptor in oral keratinocytes.
The FASEB Journal 20:2093–2101DOI 10.1096/fj.06-6191com.
Blake C, Merz CJ. 1998.UCI repository of machine learning databases. Irvine: Univer-sity of California. Department of Information and Computer Science, 55.Available athttp:// www.ics.uci.edu/ ~mlearn/ MLRepository.html.
Bundgaard T, Bentzen Søgaard H. 1995.Histological differentiation of oral squamous cell cancer in relation to tobacco smoking.European Journal of Cancer Part B: Oral Oncology31:118–121DOI 10.1016/0964-1955(94)00032-Y.
Chang S-W, Abdul-Kareem S, Merican AF, Zain RB. 2013.Oral cancer prognosis based on clinicopathologic and genomic markers using a hybrid of feature selection and machine learning methods.BMC Bioinformatics14:1
DOI 10.1186/1471-2105-14-170.
Choi H-R, Batsakis JG, Zhan F, Sturgis E, Luna MA, El-Naggar AK. 2002.Differential expression of p53 gene family members p63 and p73 in head and neck squamous tumorigenesis.Human Pathology33:158–164 DOI 10.1053/hupa.2002.30722.
Dong C. 2008.TH17 cells in development: an updated view of their molecular identity and genetic programming.Nature Reviews Immunology8:337–348.
Fang K-H, Kao H-K, Cheng M-H, Chang Y-L, Tsang N-M, Huang Y-C, Lee L-Y, Yu J-S, Hao S-P, Chang K-P. 2009.Histological differentiation of primary oral squamous cell carcinomas in an area of betel quid chewing prevalence.Otolaryngology-Head and Neck Surgery 141:743–749DOI 10.1016/j.otohns.2009.09.012.
Guo H, Nandi AK. 2006.Breast cancer diagnosis using genetic programming generated feature.Pattern Recognition39:980–987DOI 10.1016/j.patcog.2005.10.001.
Ho S-Y, Hsieh C-H, Chen H-M, Huang H-L. 2006.Interpretable gene expression classifier with an accurate and compact fuzzy rule base for microarray data analysis.
Biosystems85:165–176DOI 10.1016/j.biosystems.2006.01.002.
Hong J-H, Cho S-B. 2006.The classification of cancer based on DNA microarray data that uses diverse ensemble genetic programming.Artificial Intelligence in Medicine
36:43–58DOI 10.1016/j.artmed.2005.06.002.
Hsu C-W, Chang C-C, Lin C-J. 2003.A practical guide to support vector classification. Taipei City: Department of Computer Science National Taiwan University.
Huang TM, Kecman V. 2005.Gene extraction for cancer diagnosis by support vector machines—an improvement.Artificial Intelligence in Medicine35:185–194 DOI 10.1016/j.artmed.2005.01.006.
Ko YC, Huang YL, Lee CH, Chen MJ, Lin LM, Tsai CC. 1995.Betel quid chewing, cigarette smoking and alcohol consumption related to oral cancer in Taiwan.Journal of Oral Pathology & Medicine24:450–453DOI 10.1111/j.1600-0714.1995.tb01132.x.
Kohavi R. 1995.A study of cross-validation and bootstrap for accuracy estimation and model selection. In:International Joint Conference on Articial Intelligence (IJCAI), 1137–1145.
Koza J. 1992.Genetic programming: on the programming of computers by means of natural selection. Vol. 1. Cambridge: MIT Press.
La Vecchia C, Tavani A, Franceschi S, Levi F, Corrao G, Negri E. 1997.Epidemiology and prevention of oral cancer.Oral Oncology33:302–312
DOI 10.1016/S1368-8375(97)00029-8.
Loyha K, Vatanasapt P, Promthet S, Parkin DM. 2012.Risk factors for oral cancer in northeast Thailand.Asian Pacific Journal of Cancer Prevention13:5087–5090 DOI 10.7314/APJCP.2012.13.10.5087.
Magder L, Hughes J. 1997.Logistic regression when the outcome is measured with uncertainty.American Journal of Epidemiology146:195–203
DOI 10.1093/oxfordjournals.aje.a009251.
Majid A, Ali S, Iqbal M, Kausar N. 2014.Prediction of human breast and colon cancers from imbalanced data using nearest neighbor and support vector machines.
Computer Methods and Programs in Biomedicine113:792–808 DOI 10.1016/j.cmpb.2014.01.001.
Mitra AP, Almal AA, George B, Fry DW, Lenehan PF, Pagliarulo V, Cote RJ, Datar RH, Worzel WP. 2006.The use of genetic programming in the analysis of quantitative gene expression profiles for identification of nodal status in bladder cancer.BMC Cancer6:159 DOI 10.1186/1471-2407-6-159.
Muni DP, Pal NR, Das J. 2006.Genetic programming for simultaneous feature selection and classifier design.IEEE Transactions on Systems, Man, and Cybernetics, Part B (Cybernetics)36:106–117.
Muzio LL, Santarelli A, Caltabiano R, Rubini C, Pieramici T, Trevisiol L, Carinci F, Leonardi R, De Lillo A, Lanzafame S. 2005.p63 overexpression associates with poor prognosis in head and neck squamous cell carcinoma.Human Pathology36:187–194 DOI 10.1016/j.humpath.2004.12.003.
Nandi R, Nandi AK, Rangayyan RM, Scutt D. 2006.Classification of breast masses in mammograms using genetic programming and feature selection.Medical and Biological Engineering and Computing 44:683–694DOI 10.1007/s11517-006-0077-6.
National Institute of Dental and Craniofacial Research. 2016.Oral Cancer.Available at
http:// www.nidcr.nih.gov/ oralhealth/ topics/ oralcancer/ oralcancer.htm(accessed on 5 May 2016).
Ogden GR. 2005.Alcohol and oral cancer.Alcohol35:169–173 DOI 10.1016/j.alcohol.2005.04.002.
Oliveira L, Ribeiro-Silva A, Zucoloto S. 2007.Prognostic significance of p53 and p63 im-munolocalisation in primary and matched lymph node metastasis in oral squamous cell carcinoma.Acta Histochemica109:388–396DOI 10.1016/j.acthis.2007.03.006.
Omar Z, Ibrahim Tamin N. 2011.National cancer registry report: Malaysia cancer statistics-data and figure.Malaysia: National Cancer Registry85–87.
Oral Cancer Foundation. 2016.Available athttp:// oralcancerfoundation.org/(accessed on 27 April 2016).
Rosset S, Tibshirani R, Zhu J, Hastie TJ. 2004. The entire regularization path for the support vector machine. In:Advances in neural information processing systems, 561–568.
Scott A, Hosmer D, Lemeshow S. 1991.Applied logistic regression.Biometrics
47:1632–1635.
Silva S, Almeida J. 2003.GPLAB-a genetic programming toolbox for MATLAB. In:
Silva S, Dignum S, Vanneschi L. 2012.Operator equalisation for bloat free genetic programming and a survey of bloat control methods.Genetic Programming and Evolvable Machines13:197–238DOI 10.1007/s10710-011-9150-5.
Sweilam NH, Tharwat A, Moniem NA. 2010.Support vector machine for diagnosis cancer disease: a comparative study.Egyptian Informatics Journal11:81–92 DOI 10.1016/j.eij.2010.10.005.
Vanneschi L, Farinaccio A, Mauri G, Antoniotti M, Provero P, Giacobini M. 2011.A comparison of machine learning techniques for survival prediction in breast cancer.
BioData Mining 4:1–13DOI 10.1186/1756-0381-4-12.
Vanneschi L, Silva S. 2009.Using operator equalisation for prediction of drug toxicity with genetic programming. In:Portuguese conference on artificial intelligence. Springer, 65–76.
Vapnik V. 2000. The nature of statistical learning theory. New York: Springer Science & Business Media.
Varma S, Simon R. 2006.Bias in error estimation when using cross-validation for model selection.BMC Bioinformatics7:91DOI 10.1186/1471-2105-7-91.
Wang X, Xu J, Wang L, Liu C, Wang H. 2015.The role of cigarette smoking and alcohol consumption in the differentiation of oral squamous cell carcinoma for the males in China.Journal of Cancer Research and Therapeutics11:141–145
DOI 10.4103/0973-1482.137981.
Wright S, Zhong J, Zheng H, Larrick J. 1993.Nicotine inhibition of apoptosis suggests a role in tumor promotion.The FASEB Journal7:1045–1051.
Xu J, Huang H, Pan C, Zhang B, Liu X, Zhang L. 2007.Nicotine inhibits apoptosis induced by cisplatin in human oral cancer cells.International Journal of Oral and Maxillofacial Surgery36:739–744DOI 10.1016/j.ijom.2007.05.016.
Yu J, Yu J, Almal AA, Dhanasekaran SM, Ghosh D, Worzel WP, Chinnaiyan AM. 2007.
Feature selection and molecular classification of cancer using genetic programming.
Neoplasia9:292–IN293DOI 10.1593/neo.07121.