RESEARCH ARTICLE
Rational Design of Antibiotic Treatment
Plans: A Treatment Strategy for Managing
Evolution and Reversing Resistance
Portia M. Mira1, Kristina Crona2, Devin Greene2, Juan C. Meza1, Bernd Sturmfels3, Miriam Barlow1*
1School of Natural Science, University of California Merced, Merced, California, United States of America,
2Department of Mathematics and Statistics, American University, Washington, DC, United States of America,3Departments of Mathematics, Statistics, and EECS, University of California, Berkeley, California, United States of America
Abstract
The development of reliable methods for restoring susceptibility after antibiotic resistance arises has proven elusive. A greater understanding of the relationship between antibiotic administration and the evolution of resistance is key to overcoming this challenge. Here we present a data-driven mathematical approach for developing antibiotic treatment plans that can reverse the evolution of antibiotic resistance determinants. We have generated adap-tive landscapes for 16 genotypes of the TEMβ-lactamase that vary from the wild type geno-type“TEM-1”through all combinations of four amino acid substitutions. We determined the growth rate of each genotype when treated with each of 15β-lactam antibiotics. By using growth rates as a measure of fitness, we computed the probability of each amino acid sub-stitution in eachβ-lactam treatment using two different models named the Correlated Proba-bility Model (CPM) and the Equal ProbaProba-bility Model (EPM). We then performed an
exhaustive search through the 15 treatments for substitution paths leading from each of the 16 genotypes back to the wild type TEM-1. We identified optimized treatment paths that re-turned the highest probabilities of selecting for reversions of amino acid substitutions and returning TEM to the wild type state. For the CPM model, the optimized probabilities ranged between 0.6 and 1.0. For the EPM model, the optimized probabilities ranged between 0.38 and 1.0. For cyclical CPM treatment plans in which the starting and ending genotype was the wild type, the probabilities were between 0.62 and 0.7. Overall this study shows that there is promise for reversing the evolution of resistance through antibiotic treatment plans.
Introduction
Antibiotic resistance is an inevitable outcome whenever antibiotics are used. There are many reasons for this: 1) As humans (also as eukaryotes), we are vastly outnumbered by bacteria in nearly all measures, including total population size, biomass, genetic diversity, emigration, and OPEN ACCESS
Citation:Mira PM, Crona K, Greene D, Meza JC, Sturmfels B, Barlow M (2015) Rational Design of Antibiotic Treatment Plans: A Treatment Strategy for Managing Evolution and Reversing Resistance. PLoS ONE 10(5): e0122283. doi:10.1371/journal. pone.0122283
Academic Editor:Paul J Planet, Columbia University, UNITED STATES
Received:July 16, 2014
Accepted:February 19, 2015
Published:May 6, 2015
Copyright:© 2015 Mira et al. This is an open access article distributed under the terms of theCreative Commons Attribution License, which permits unrestricted use, distribution, and reproduction in any medium, provided the original author and source are credited.
Data Availability Statement:All relevant data are within the paper and its Supporting Information files.
Funding:The authors have no support or funding to report.
immigration [1]; 2) bacteria can use horizontal gene transfer to share resistance genes across distantly related species of bacteria, including non-pathogens [2]; 3) compared to humans, bac-teria have relatively few vulnerable target sites [3]; 4) microbes are the sources of nearly all anti-biotics that are used by humans [4]. Given the overwhelming numbers of bacteria, the limited number of target sites, the numerous ways that they can infect humans, and that they have been exposed to naturally occurring antibiotics for billions of years, resistance to antibiotics used by human populations is unavoidable.
Once resistance is present in a bacterial population, it is exceedingly difficult to remove for several reasons. If any amount of antibiotic is present in the environment, antibiotic resistance genes will confer a large fitness advantage [5], and even when antibiotics are not present in an environment, the fitness costs for carrying and expressing resistance genes are small to non-ex-istent [6]. In addition to it being difficult to remove antibiotics from the environment [7], even if humans were to completely abandon the use of antibiotics, resistance would persist for years [8].
Efforts to remove resistance genes from clinical environments by either discontinuing or re-ducing the use of specific antibiotics for some period of time, either through general reduction of antibiotic consumption or periodic rotations of antibiotics (cycling) have not worked in any reliable or reproducible manner [9]; indeed it would have been surprising if they had worked [10],[11].
Since antibiotic resistanceisunavoidable, it only makes sense to accept its inevitability and develop methods for mitigating the consequences. One reasonable approach is to rotate the use of antibiotics. This has been implemented in many ways and there are recent studies to model the optimal duration, mixing versus cycling, and how relaxed antibiotic cycles may be and still function as planned [12,13]. However, none of those models have focused on developing a method for designing an optimal succession of antibiotics.
In a previous publication [14], we proposed that susceptibility to antibiotics could be re-stored by rotating consumption of multiple antibiotics that are a) structurally similar, b) inhib-it/kill bacteria through the same target site, and c) result in pleiotropic fitness costs that reduce the overall resistance of bacteria to each other. We presented a proof-of-principle example [14] of how this might work with a series ofβ-lactam antibiotics in which some of them would select for new amino acid substitutions in the TEMβ-lactamase and others that would select rever-sions in TEM ultimately leading back to the wild type (un-mutated) state. We have focused particularly onβ-lactamases because there is often no fitness cost associated with their expres-sion, and they are particularly difficult to remove from clinical microbial populations.
analysis [18] and competition experiments [19] suggest that this is a valid model for TEM evolution.
The ability to apply selective pressures that favor reversions of substitutions within an evolved TEM genotype would increase the number of antibiotics that could be used. To embark upon our effort of determining the best way to do this, we decided to create a model system based upon the TEM-50 genotype, which differs from TEM-1 by four amino acid substitutions. All four substitutions by themselves confer clearly defined resistance advantages in the pres-ence of certain antibiotics. Additionally, TEM-50 is one of the few genotypes that simulta-neously confers resistance to cephalosporins and inhibitor combined therapies.
Results
From experimental data to mathematical models
We created all 16 variant genotypes of the four amino acid substitutions found in TEM-50 using site directed mutagenesis (Table 2) and measured the growth rates of 12 replicates ofE. Table 1. Distribution of substitutions among TEM enzymes.
Number of amino acid substitutions Number of identified TEM genotypes
1 53
2 53
3 37
4 31
5 10
6 2
7 2
8 0
9 0
10 1
11 1
doi:10.1371/journal.pone.0122283.t001
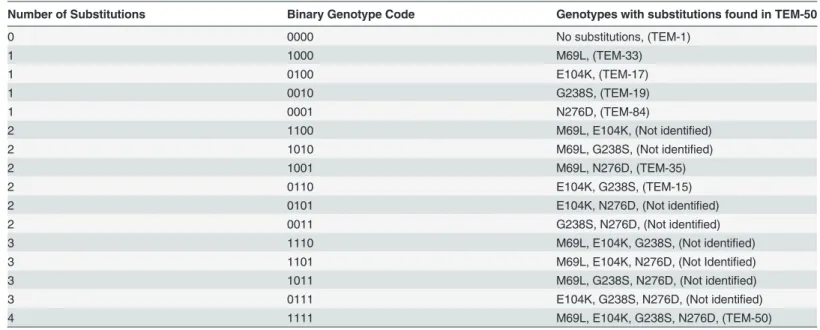
Table 2. Variant Genotypes Created, Binary Codes, Substitutions and (Names of Genotypes Identified in Clinical Isolates).
Number of Substitutions Binary Genotype Code Genotypes with substitutions found in TEM-50
0 0000 No substitutions, (TEM-1)
1 1000 M69L, (TEM-33)
1 0100 E104K, (TEM-17)
1 0010 G238S, (TEM-19)
1 0001 N276D, (TEM-84)
2 1100 M69L, E104K, (Not identified)
2 1010 M69L, G238S, (Not identified)
2 1001 M69L, N276D, (TEM-35)
2 0110 E104K, G238S, (TEM-15)
2 0101 E104K, N276D, (Not identified)
2 0011 G238S, N276D, (Not identified)
3 1110 M69L, E104K, G238S, (Not identified)
3 1101 M69L, E104K, N276D, (Not Identified)
3 1011 M69L, G238S, N276D, (Not identified)
3 0111 E104K, G238S, N276D, (Not identified)
4 1111 M69L, E104K, G238S, N276D, (TEM-50)
coliDH5α-E expressing each genotype in the presence of one of fifteenβ-lactam antibiotics
(Table 3). Each genotype was grown in each antibiotic in 12 replicates. We computed the mean
growth rate of those replicates (Table 4) and the variance of each sample, as well as the signifi-cance between adjacent genotypes that differed by one amino acid substitution. This was done using one-way ANOVA analysis.
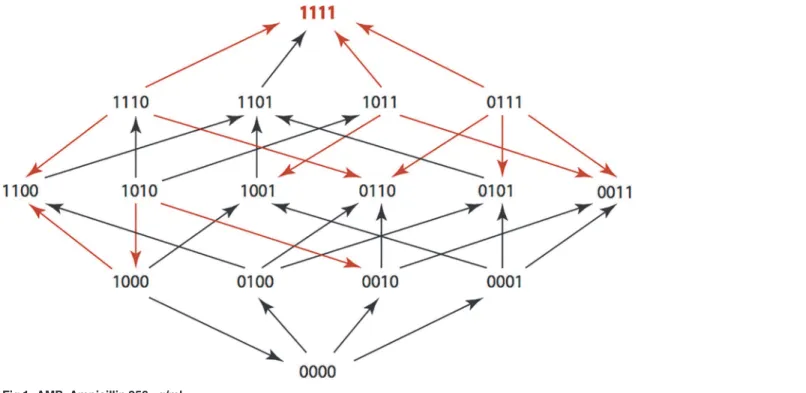
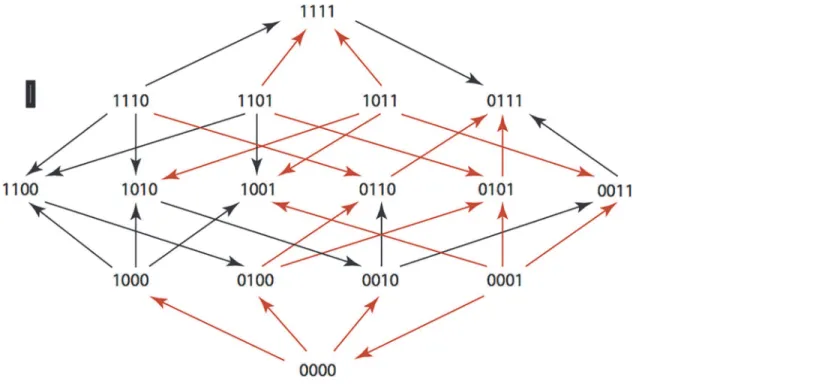
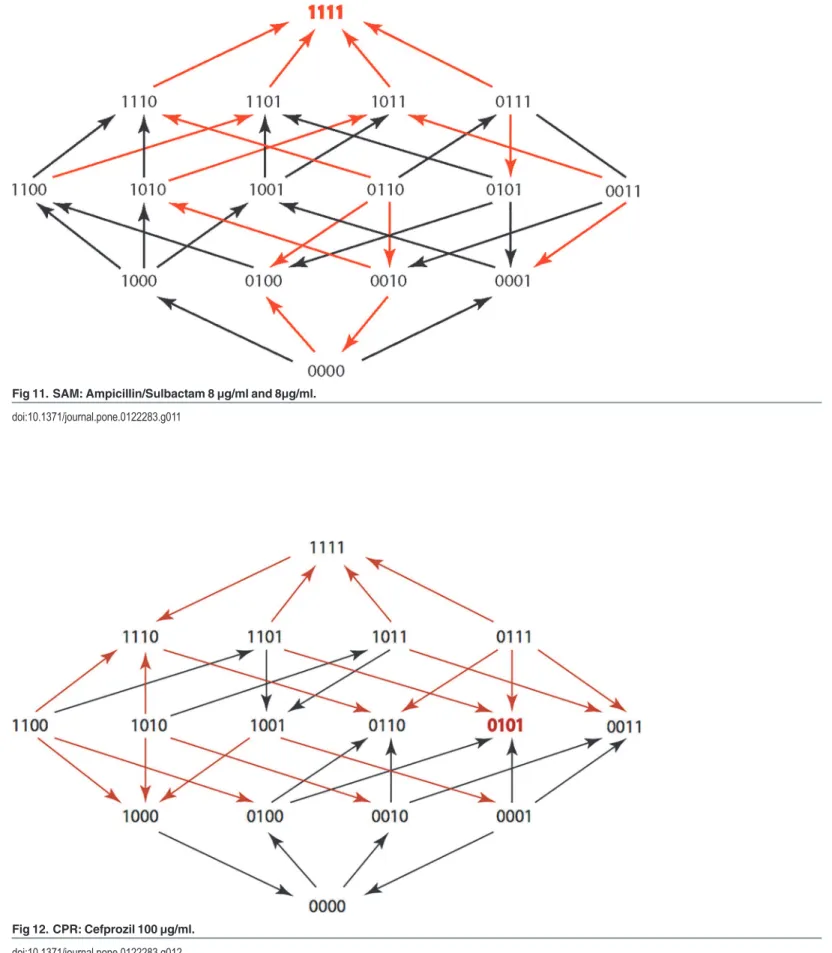
The results are summarized in Figs1–15, where the arrows in the fitness graphs connect pairs of adjacent genotypes. For each comparison of adjacent genotypes, we indicate the one whose expression resulted in the faster growth by directing the arrowhead towards that geno-type, and implying that evolution would proceed in that direction if the two genotypes oc-curred simultaneously in a population [20,21]. In other words, the node indicated by the arrowhead would increase in frequency and reach fixation in the population, while the other would be lost. Red arrows indicate significance, and black arrows indicate differences that were not statistically significant by ANOVA, but that may still exist if a more sensitive assay was used.
Figs1–15.These figures present fitness graphs, which are a visual summary of the adaptive
landscape 2x2x2x2 tensors in which each resistance phenotype conferred by each TEM geno-type is enumerated. Arrows pointing upward represent selection for the addition of a substitu-tion. Arrows pointing downward represent selection for reversions. Red arrows indicate significance between adjacent growth rates as determined by one way ANOVA. Genotypes that confer the most resistance to each antibiotic are shown in red.
We rank ordered the genotypes (Table 5) in each landscape diagram with a score from 1 to 16, with the genotype promoting the fastest growth receiving a score of“1”and the genotype with the slowest growth a score of“16”. This analysis shows that all genotypes have a score of 5 or better and a score of 13 or worse, in at least one landscape, indicating that there is abundant pleiotropy as antibiotic selective pressures change. That pleiotropy provides a basis for effec-tively alternating antibiotic to restore the wild type.
We considered the 15 antibiotics previously mentioned inTable 3: AMP, AM, CEC, CTX, ZOX, CXM, CRO, AMC, CAZ, CTT, SAM, CPR, CPD, TZP, and FEP and their interactions with a bi-allelic 4-locus TEM system {0,1}4where four functionally important amino acid resi-dues involved in the evolution of TEM-50 are considered. The number "1" denotes an amino Table 3. β-lactam Antibiotics used for this study.
β-lactam Antibiotic FDA approval Antibiotic Group
Ampicillin (AMP) 1963 Aminopenicillin
Amoxicillin (AM) 1972 Aminopenicillin
Cefaclor (CEC) 1979 Cephalosporin
Cefotaxime (CTX) 1981 Cephalosporin
Ceftizoxime (ZOX) 1983 Cephalosporin
Cefuroxime (CXM) 1983 Cephalosporin
Ceftriaxone (CRO) 1984 Cephalosporin
Amoxicillin + Clavulanic acid (AMC) 1984 Penicillin derivative +β-Lactamase inhibitor
Ceftazidime (CAZ) 1985 Cephalosporin
Cefotetan (CTT) 1985 Cephalosporin
Ampicillin + Sulbactam (SAM) 1986 Penicillin derivative +β-Lactamase inhibitor
Cefprozil (CPR) 1991 Cephalosporin
Cefpodoxime (CPD) 1992 Cephalosporin
Pipercillin + Tazobactam (TZP) 1993 Penicillin derivative +β-Lactamase inhibitor
Cefepime (FEP) 1996 Cephalosporin
doi:10.1371/journal.pone.0122283.t003
acid substitution, whereas "0" denotes no substitution at the site. We experimentally deter-mined growth rates for all genotypes in our TEM system at a selected concentration of each an-tibiotic. Those growth rates depend upon the states of the four amino acid residues. The growth rates for all genotypes in one antibiotic can be represented by a real 2×2×2×2 tensorf= (fijkl), wheref(ar) is the fitness landscape for the antibioticr. We can identifyf(ar) with a vector
whose coordinates are indexed by {0,1}4. The resulting 15 vectors, one for each antibiotic, are the rows inTable 4.
Our substitution modelM(f) is a functionM:R16
!R1616
that assigns a transition matrix to each fitness landscape. The rows and columns ofM(f) are labeled by the genotypes {0,1}4 ac-cording to the degree lexicographic order. The entries inM(f(ar))u,vrepresent the probability
that that genotypeuis replaced by genotypevunder the presence of antibioticar. For that
rea-son, the rows of our transition matrices have nonnegative entries and their rows sum to 1. We require that our transition matrices respect the adjacency structure of the 4-cube, that is,M(f)u,v= 0 unlessuandvare vectors in {0,1}4that differ in at most one coordinate. In other
Table 4. Average Growth Rates (x 10–3): the rows are the fitness landscapes.
0000 1000 0100 0010 0001 1100 1010 1001
AMP 1.851 1.570 2.024 1.948 2.082 2.186 0.051 2.165
AM 1.778 1.720 1.448 2.042 1.782 1.557 1.799 2.008
CEC 2.258 0.234 2.396 2.151 1.996 2.150 2.242 0.172
CTX 0.160 0.185 1.653 1.936 0.085 0.225 1.969 0.140
ZOX 0.993 1.106 1.698 2.069 0.805 1.116 1.894 1.171
CXM 1.748 0.423 2.940 2.070 1.700 2.024 1.911 1.578
CRO 1.092 0.830 2.880 2.554 0.287 1.407 3.173 0.540
AMC 1.435 1.417 1.672 1.061 1.573 1.377 1.538 1.351
CAZ 2.134 0.288 2.042 2.618 2.656 2.630 1.604 0.576
CTT 2.125 3.238 3.291 2.804 1.922 0.546 2.883 2.966
SAM 1.879 2.198 2.456 0.133 2.533 2.504 2.308 2.570
CPR 1.743 1.553 2.018 1.763 1.662 0.223 0.165 0.256
CPD 0.595 0.432 1.761 2.604 0.245 0.638 2.651 0.388
TZP 2.679 2.709 3.038 2.427 2.906 2.453 0.172 2.500
FEP 2.590 2.067 2.440 2.393 2.572 2.735 2.957 2.446
0110 0101 0011 1110 1101 1011 0111 1111
AMP 2.033 2.198 2.434 0.088 2.322 0.083 0.034 2.821
AM 1.184 1.544 1.752 1.768 2.247 2.005 0.063 2.047
CEC 2.230 1.846 2.648 2.640 0.095 0.093 0.214 0.516
CTX 2.295 0.138 2.348 0.119 0.092 0.203 2.269 2.412
ZOX 2.138 2.010 2.683 1.103 1.105 0.681 2.688 2.591
CXM 2.918 2.173 1.938 1.591 1.678 2.754 3.272 2.923
CRO 2.732 0.656 3.042 2.740 0.751 1.153 0.436 3.227
AMC 0.073 1.625 1.457 1.307 1.914 1.590 0.068 1.728
CAZ 2.924 2.756 2.688 2.893 2.677 1.378 0.251 2.563
CTT 3.082 2.888 0.588 3.193 3.181 0.890 3.508 2.543
SAM 0.083 2.437 0.094 2.528 3.002 2.886 0.094 3.453
CPR 2.042 2.050 1.785 1.811 0.239 0.221 0.218 0.288
CPD 2.910 1.471 3.043 0.963 0.986 1.103 3.096 3.268
TZP 2.528 3.309 0.141 0.609 2.739 0.093 0.143 0.171
FEP 2.652 2.808 2.832 2.796 2.863 2.633 0.611 3.203
doi:10.1371/journal.pone.0122283.t004
words, we reasoned that resistant strains are most likely to be in competition with those that express resistance genotypes that are immediately adjacent (vary by a single amino acid substitution).
Fig 1. AMP: Ampicillin 256μg/ml.
doi:10.1371/journal.pone.0122283.g001
Fig 2. AM: Amoxicillin 512μg/ml.
doi:10.1371/journal.pone.0122283.g002
Fig 3. CEC: Cefaclor 1μg/ml.
doi:10.1371/journal.pone.0122283.g003
Fig 4. CTX: Cefotaxime 0.05μg/ml.
doi:10.1371/journal.pone.0122283.g004
Fig 6. CXM: Cefuroxime 1.5μg/ml.
doi:10.1371/journal.pone.0122283.g006 Fig 5. ZOX: Ceftizoxime 0.03μg/ml.
doi:10.1371/journal.pone.0122283.g005
Fig 7. CRO: Ceftriaxone 0.045μg/ml.
doi:10.1371/journal.pone.0122283.g007
Fig 8. AMC: Amoxicillin/Clavulanate 512μg/ml and 8μg/ml.
doi:10.1371/journal.pone.0122283.g008
Fig 9. CAZ: Cefazidime 0.1μg/ml.
doi:10.1371/journal.pone.0122283.g009
Fig 10. CTT: Cefotetan 0.312μg/ml.
doi:10.1371/journal.pone.0122283.g010
Fig 11. SAM: Ampicillin/Sulbactam 8μg/ml and 8μg/ml.
doi:10.1371/journal.pone.0122283.g011
Fig 12. CPR: Cefprozil 100μg/ml.
doi:10.1371/journal.pone.0122283.g012
Fig 13. CPD: Cefpodoxime 2μg/ml.
doi:10.1371/journal.pone.0122283.g013
Fig 14. TZP: Pipercillin / Tazobactam 8.12μg/ml and 8μg.ml.
doi:10.1371/journal.pone.0122283.g014
Fig 15. FEP: Cefepime 0.0156μg/ml.
doi:10.1371/journal.pone.0122283.g015
Table 5. Rank Order of Genotypes in Eachβ-Lactam Antibiotic (Derived FromTable 4).
Antibiotic 0000 1000 0100 0010 0001 1100 1010 1001 0110 0101 0011 1110 1101 1011 0111 1111
AMP 11 12 9 10 7 5 15 6 8 4 2 13 3 14 16 1
AM 8 11 14 3 7 12 6 4 15 13 10 9 1 5 16 2
CEC 4 12 3 7 9 8 5 14 6 10 1 2 15 16 13 11
CTX 11 10 7 6 16 8 5 12 3 13 2 14 15 9 4 1
ZOX 14 11 8 5 15 10 7 9 4 6 2 3 12 16 1 3
CXM 11 16 2 7 12 8 10 15 4 6 9 14 13 5 1 3
CRO 10 11 4 7 16 8 2 14 6 13 3 5 12 9 15 1
AMC 9 10 3 14 6 11 7 12 15 4 8 13 1 5 16 2
CAZ 10 15 11 8 6 7 12 14 1 3 4 2 5 13 16 9
CTT 12 3 2 10 13 16 9 7 6 8 15 4 5 14 1 11
SAM 12 11 8 13 5 7 10 4 16 9 14 6 2 3 15 1
CPR 7 9 3 6 8 13 16 11 2 1 5 4 12 14 15 10
CPD 13 14 7 6 16 12 5 15 4 8 3 11 10 9 2 1
TZP 6 5 2 10 3 9 12 8 7 1 15 11 4 16 14 13
FEP 10 15 13 14 11 7 2 12 8 5 4 6 3 9 16 1
Best value 4 3 2 3 3 5 2 4 1 1 1 2 1 3 1 1
Worst value 14 16 14 14 16 16 15 15 16 13 15 14 15 16 16 13
Median value 10 11 7 7 9 8 7 12 6 6 4 6 5 9 15 2
Based on the strong patterns of pleiotropy we observed, we reasoned that the choice and the succession of antibiotics were at least as important as other cycling considerations. We formalized our approach to identifying optimal antibiotic treatment paths as follows.
doi:10.1371/journal.pone.0122283.t005
The combined effect of a sequencea1,. . .,akofkantibiotics is described by a new transition
matrix
Mðfa1Þ Mðfa2Þ :::MðfakÞ
obtained as the product of the transition matrices for each drug.
For any genotype u other than 0000, our goal is to find a sequence of antibiotics which max-imizes the probability of returning to the wild type. In other words, if we restrict to sequences of length k our goal is to find a sequence of antibioticsa1,. . .,akwhich maximizes the matrix
entryM(f(a1))M(f(a2)). . .M(f(ak))u,0000. For eachuthis requires searching over all 15k antibi-otic sequences of lengthk.
Finding optimal sequences of antibiotics
We used two substitution models to determine the optimal (highest probability) sequences of β-lactams for returning TEM genotypes back to their wild type state. Briefly, the Correlated Probability Model (CPM) allows probabilities to be based upon the actual growth rates. It is given by applying Eq (3) to the growth rates inTable 4. The Equal Probability Model (EPM) as-sumes that beneficial substitutions are equally likely and that only the direction of the arrows in Figs1–15is important. This means that the matrix entryM(f)u,vis 1/Nif genotypeuhasN
outgoing arrows and there is an arrow fromutov.
A visual summary of the highest probabilities according to the CPM is provided inFig 16. The CPM provides good estimates if fitness differences between genotypes are small [14,22– 24]. The EPM has been used in settings where only rank order (as inTable 5) is available [25].
From the graph, it is possible to find candidate treatment plans. For example, when starting at genotype 1010 the graph shows that the probability for ending at 0000 is 0.71for the se-quence ZOX-TZP (0.71 is the product of the arrow labels). Similarly, when starting at 1111 the probability for ending at 0000 is 0.62 for the sequence CEC-CAZ-TZP-AM. When starting at 0001 the graphs shows that a single drug gives probability at most 0.29, whereas the probability for ending at 0000 for the sequence AMC-CRO-AM (one arrow up, two arrows down) is at least 0.960.62 = 0.6.
This graph can also be used to generate treatment paths that start and end at the same geno-type, making possible the development of a fixed treatment plan. For example, from a starting point 0000, the probability for ending at 0000 is 0.62 for the sequence: CEC-CTX-ZOX-CPD-CPR-CAZ-TZP-AM
For all sequences of antibiotics of a fixed length (two, three, four, five, and six), we examined the probability that a given genotype is returned to the wild type state. It is worth noting that within these paths, a single genotype can be repeated consecutively with different antibiotics, thus making it possible to have an odd number of steps in the treatment paths when an even number of subtitutions are introduced. For every starting genotype, we found we were able to return to the wild type genotype with a probability between 0.6 and 1.0 when using the CPM model and a probability of 0.375 and 1.0 when using the EPM model. These results are summa-rized in Tables6–9andFig 17. These results show the number of paths and their probabilities (Tables6and7) and the substitutions selected through the optimal treatment plans (Tables8– 11) for returning to the wild type state from various starting points.
Fig 16. Summary of CPM Substitutions with the Highest Probabilities.Each arrow is labeled by the drug or drugs corresponding to the maximal transition probability, taken over all 15 drugs. Each arrow is also labeled by the maximal probability. The top panel shows which antibiotics selected the addition of substitutions and the bottom panel shows which antibiotics selected reversions. Unlabled arrows are those with low probabilities across all antibiotics.
doi:10.1371/journal.pone.0122283.g016
substitution before reverting back to the wild type state. However, when treatment plans with lower probabilities are considered, we find that more amino acid substitutions in the genotype are allowed.
Discussion
In this study, we have developed an experimental approach for measuring pleiotropy and a computational mathematical approach for optimizing antibiotic treatment paths. The experi-mental approach we developed is rapid and high throughput, consistent with previous work [26], and should be applicable to many species of resistant bacteria. The mathematical model
Table 7. Maximum Probability and Number of Paths Using EPM.
Starting Genotype 1 Step No. of paths 2 Step No. of paths 3 Step No. of paths 4 Step No. of paths 5 Step No. of paths
6 Step No. of paths
1000 1.0 1 1.0 3 1.0 7 1.0 15 1.0 31 1.0 63
0100 0.33 1 0.33 6 0.33 39 0.38 1 0.46 1 0.46 9
0010 0.50 1 0.50 4 0.50 6 0.50 8 0.50 10 0.50 12
0001 0.50 1 0.50 1 0.66 4 0.66 8 0.66 14 0.66 24
1100 - 0.33 27 0.39 1 0.39 1 0.39 4 0.46 5
1010 - 0.50 3 0.50 19 0.58 1 0.58 8 0.59 1
1001 - 0.66 2 0.66 4 0.66 7 0.66 12 0.69 1
0110 - 0.33 1 0.33 10 0.33 81 0.38 1 0.46 1
0101 - 0.29 1 0.38 1 0.46 1 0.46 4 046 1
0011 - 0.25 4 0.25 32 0.50 2 0.50 18 0.50 133
1110 - - 0.33 2 0.33 24 0.33 221 0.38 6
1101 - - 0.29 2 0.38 2 0.46 2 0.46 14
1011 - - 0.33 3 0.33 8 0.39 1 0.52 1
0111 - - 0.15 1 0.20 8 0.33 4 0.38 6
1111 - - - - 0.33 4 0.38 4 0.46 4
doi:10.1371/journal.pone.0122283.t007
Table 6. Maximum Probability and Number of Paths Using CPM.
Starting Genotype 1 Step No. of paths 2 Step No. of paths 3 Step No. of paths 4 Step No. of paths 5 Step No. of paths 6 Step No. of paths
1000 1.0 1 1.0 3 1.0 7 1.0 15 1.0 31 1.0 63
0100 0.617 1 0.617 6 0.617 36 0.617 219 0.617 1360 0.617 8568
0010 0.715 1 0.715 2 0.715 3 0.715 4 0.715 5 0.715 6
0001 0.287 1 0.287 1 0.592 2 0.592 8 0.726 2 0.726 4
1100 - 0.617 3 0.617 18 0.617 108 0.617 657 0.617 4110
1010 - 0.715 1 0.715 6 0.715 27 0.715 112 0.715 453
1001 - 0.559 1 0.559 4 0.726 1 0.726 2 0.729 1
0110 - 0.617 1 0.617 10 0.617 78 0.617 555 0.617 3805
0101 - 0.592 1 0.592 9 0.612 1 0.612 9 0.617 34
0011 - 0.361 1 0.361 9 0.586 2 0.600 2 0.617 8
1110 - - 0.617 2 0.617 24 0.617 215 0.617 1720
1101 - - 0.592 2 0.592 24 0.617 12 0.617 252
1011 - - 0.532 1 0.532 1 0.684 1 0.690 1
0111 - - 0.586 1 0.600 1 0.617 4 0.617 84
1111 - - - - 0.617 4 0.617 72 0.617 906
doi:10.1371/journal.pone.0122283.t006
we created expresses the problem of antibiotic resistance in general terms, and can therefore be applied to other resistance phenotypes where pleiotropy occurs to identify the antibiotic treat-ment plans that have the highest probability of reversing the evolution of resistance.
The purpose of this study was to determine whether it is possible to use selective pressures to return TEM-genotypes to the wild type state, as observed in 1963 when TEM-1 was original-ly isolated. The methods may also be used to select for any particular genotype within our data set. As such, we may select with reasonably high probabilities, resistance genotypes that existed at some prior point in time. To highlight this feature, we have named our software package “Time Machine”.
Once given growth rates of adjacent genotypes, Time Machine returned treatment plans that restored the wild type state as observed in 1963 with probabilities greater than 0.6 when using the CPM model and greater than 3/8 (>0.375) when using EPM. These results suggest
that when possible it is desirable to use actual growth rates rather than rough ranking data. Table 8. CPM Additions of Substitutions And Associatedβ-lactam Antibiotics From Optimal Six Step Treatment Plans (*Maximum Probability for Path).
Substitutions Drugs associated with substitutions in optimal paths (probability)
0000–1000 CTT(0.38*)
0000–0100 0000–0010 0000–0001 1000–1100 1000–1010 1000–1001
0100–1100 SAM(1.0*)
0100–0110 CTX(1.0*), CPD(1.0*) 0100–0101
0010–1010 CTT(0.22)
0010–0110 0010–0011
0001–1001 AM(1.0*), CTT(0.47), SAM(1.0*)
0001–0101 0001–0011
1100–1110 CAZ(0.85*), SAM(0.046), FEP(0.32) 1100–1101 AMP(1.0*),CAZ(0.15), SAM(0.95), FEP(0.68) 1010–1110 CEC(1.0*), CTT(0.47)
1010–1011 1001–1101
1001–1011 CTX(0.50*)
0110–1110 FEP(1.0*)
0110–0111 ZOX(1.0*), CXM(0.94), CPD(1.0*) 0101–1101 AMP(1.0*), FEP(1.0*)
0101–0111 CTX(0.58), ZOX(1.0*), CXM(0.59), CPD(0.85)
0011–1011 CTT(0.04)
0011–0111 ZOX(1.0*), CPD(1.0*)
1110–1111 AM(0.90), CRO(0.53), SAM(1.0*), CPD(0.39), FEP(0.72) 1101–1111 AMP(1.0*), SAM(1.0*), FEP(1.0*)
1011–1111 TZP(0.03)
0111–1111 CPD(1.0*)
doi:10.1371/journal.pone.0122283.t008
While these treatment methods may have clinical value, we have yet to determine the ideal duration of each therapy. Additionally the antibiotics included in our study may have different applications in the clinic. A further issue is that if new genotypes arise, the treatment plan may fail. The inclusion of more resistance genes in this type of approach may aid in the creation of robust treatment plans that are effective even when unexpected genotypes arise.
The discrete optimization problem motivated by our goal to reverse resistance, or the chal-lenge to build a better time machine, is of independent mathematical interest. Tables6and7 suggest that the maximum probabilities in each row stagnate after a limited number of steps. This is not always the case. We have created an example (see supplemental information) of two substitution matrices on a 3-locus system where the maximum probabilities can be increased indefinitely (S1 Fig).
These results show that great potential exists for remediation of antibiotic resistance through antibiotic treatment plans when pleiotropic fitness costs are known for an appropriate Table 9. CPM Reversions of Substitutions And Associatedβ-lactam Antibiotics From Optimal Six Step Treatment Plans (*Maximum Probability for Path).
Reversions Drugs associated with substitutions in optimal paths (probability)
1111–1110 CEC(1.0*), CAZ(0.74), CTT(0.29), CPR(1.0*), TZP(0.15) 1111–1101 AM(1.0*), AMC(1.0*), CAZ(0.26), TZP(0.85)
1111–1011
1111–0111 ZOX(1.0*), CXM(1.0*)
1110–1100 TZP(0.49*)
1110–1010 AM(0.10), CRO(0.47*), CPD(0.28), FEP(0.28) 1110–0110 CAZ(1.0*), CPR(1.0*), CPD(0.33), TZP(0.51) 1101–1100
1101–1001 1101–0101
1011–1010 TZP(0.30)
1011–1001 TZP(0.92*)
1011–0011 TZP(0.18)
0111–0110 0111–0101 0111–0011
1100–1000 CTT(0.25)
1100–0100 CTX(1.0*), ZOX(1.0*), CXM(1.0*) 1010–1000 CTT(0.53*), TZP(0.49)
1010–0010 ZOX(1.0*), TZP(0.43)
1001–1000 CTX(0.42), CTT(0.56)
1001–0001
0110–0100 CXM(0.58), TZP(1.0*) 0110–0010
0101–0100 CTX(0.42), CXM(0.41), CPD(0.15) 0101–0001
0011–0010 CTT(0.33), TZP(0.45)
0011–0001 CTT(0.20), TZP(0.55)
1000–0000 CPR(1.0*)
0100–0000 AM(0.62*)
0010–0000 TZP(0.71*)
0001–0000 CTT(0.092), CPR(0.14)
doi:10.1371/journal.pone.0122283.t009
set of antibiotics. While developed using a model of Gram-negative antibacterial resistance, this approach could also be used for Gram-positive bacteria and HIV treatment plans.
Methods
Experimental methods
Strains and Cultures. We expressed 16 mutant constructs of the blaTEMgene in plasmid pBR322 from strain DH5-αE. The 16 genotypes differ at all combinations of four amino acid residues and have been previously described [14]. We grew them overnight (16 hours) in standing cultures and diluted them to a concentration of 1.9X10⁵as described elsewhere [14].
We transferred 80μl of each culture to a 384-well plate with one genotype present in each of the 16 rows. The first 12 wells of each row were antibiotic free (controls) and the last 12 wells contained a single antibiotic at an inhibitory, sublethal concentration. We tested many concen-trations and used those that maximized our ability to make comparisons between alleles.
After plating, a membrane is placed over the plate and simultaneously incubated/measured in the Eon Microplate Spectrophotometer at a temperature of 25.1°C for 22 hours. This rela-tively cool (<37°) temperature is used because degradation of the antibiotics is much slower,
while the growth rate of the bacteria is still sufficient to capture the complete exponential peri-od of growth over the duration of the experiment. Overall, we have found that a temperature ~25°C yields more reliable and consistent measurement of growth rates in the presence of antibiotics.
Measurements of cell density (light scattering) at a wavelength of 600 nanometers were au-tomatically collected every 20 minutes after brief agitation to homogenize and oxygenate the culture.
Fig 17. Summary of Optimal 6 Step CPM and EPM Treatment Paths beginning at genotype 1111 and ending at genotype 0000.An arrow indicates that the substitution is included in a path that starts at 1111 and ends at 0000, where the pathway has non-zero probability. Black arrows show substitutions present in six step paths computed using both the CPM and the EPM. Red arrows signify substitutions found only in optimum paths computed using the CPM whereas blue signify substitutions only found using the EPM.
doi:10.1371/journal.pone.0122283.g017
Growth Rates. The data obtained from the microplate spectrophotometer is exported to the GrowthRates program to derive the growth rates. In essence, by measuring the optical den-sity at frequent intervals the GrowthRates program can estimate the growth rate,α, through a linear regression algorithm fitting the data from the exponential growth phase. Details can be found in [27] in the section entitled“The Growth Curve”located on pages 233–4. There is not a direct or simple correlation between this method and other methods such as minimum inhib-itory (MIC) or disk diffusion testing. The output of this program for the data we collected was a listf(a1),f(a2),. . .,f(ak) of 15 tensors, each of format 2×2×2×2. These are the rows inTable 4.
So ifu∊{0,1}4is a genotype, thenf(ai)uis the fitness of genotypeuin the presence of antibiotic ai. This fitness is a growth rate, so we are here using the letterffor a quantity often denoted
byα.
Table 10. EPM Additions of Substitutions and Associatedβ-lactam Antibiotics From Optimal Six Step Treatment Plans (*Maximum Probability for Path).
Mutations β-lactams associated with substitutions in optimal paths (probability)
0000–1000 0000–0100 0000–0010 0000–0001 1000–1100 1000–1010 1000–1001
0100–1100 SAM(1.0*)
0100–0110
0100–0101 TZP(1.0*)
0010–1010 0010–0110 0010–0011
0001–1001 AM(1.0*), SAM(1.0*)
0001–0101 TZP(1.0*)
0001–0011
1100–1110 CTT(1/4)
1100–1101 AMP(1.0*), CPR(1/4)
1010–1110 CTT(1/2)
1010–1011 1001–1101
1001–1011 CTX(1/2*)
0110–1110 CTT(1/3)
0110–0111
0101–1101 AM(1/2), AMC(1/2)
0101–0111
0011–1011 AMC(1/2*)
0011–0111
1110–1111 SAM(1.0*)
1101–1111
1011–1111 CTT(1/3)
0111–1111 SAM(1/2), CPD(1.0*)
doi:10.1371/journal.pone.0122283.t010
One-Way Analysis of Variance (ANOVA) was then used to compare the means of the growth rates obtained, and to determine if there were significant differences between the growth rates of adjacent genotypes.
Correlated Probability Model (CPM): Once the growth rates have been determined under various experimental conditions, the next step is to use them to compute fixation probabilities.
If the (multiplicative) absolute fitnessesWuandWvof two neighboring genotypesuandv,
differ by a small quantity then the (additive) relative fitnessln Wu Wv
can be approximated by
ln Wv
Wu
¼Tðfv fuÞ 1
Table 11. EPM Reversions of Substitutions and Associatedβ-lactam Antibiotics From Optimal Six Step Treatment Plans (*Maximum Probability for Path).
Reversions β-lactams associated with substitutions in optimal paths (probability)
1111–1110 CTT(1/3)
1111–1101 AM(1.0*), AMC(1.0*)
1111–1011 1111–0111
1110–1100 TZP(1/2*)
1110–1010
1110–0110 CAZ(1.0*), CPR(1.0*), TZP(1/2) 1101–1100
1101–1001 CPR(1/3*)
1101–0101 CAZ(1.0*), TZP(1.0*)
1011–1010 CTT(1/3*)
1011–1001 AM(1/2*), CTT(1/3) 1011–0011
0111–0110
0111–0101 SAM(1/2*)
0111–0011
1100–1000 CTT(1/4), CPR(1/4), TZP(1/3*) 1100–0100 CTX(1.0*), ZOX(1.0*), CXM(1.0*) 1010–1000 CTT(1/2*), TZP(1/3)
1010–0010
1001–1000 CEC(1/2*), CTX(1/2*), CTT(1/2*), CPR(1/2*), TZP(1/3)
1001–0001 CEC(1/2*), CPR(1/2*)
0110–0100 TZP(1.0*)
0110–0010
0101–0100 CEC(1/2*), AMC(1/2*)
0101–0001 AM(1/2*), CEC(1/2*)
0011–0010
0011–0001 AMC(1/2*)
1000–0000 CPR(1.0*)
0100–0000 FEP(1/4)
0010–0000 SAM(1/2*), TZP(1/2*) 0001–0000 CEC(1/2*), CPR(1/3), FEP(1/3)
doi:10.1371/journal.pone.0122283.t011
Table 12. Cyclical Treatment Paths showing Substitutions and Associatedβ-lactam Antibiotics.
Path length and probability (prob) 0000-0010/ 0010–0000 0000-0100/ 0100–0000 0100-0110/ 0110–0100 0100-1100/ 1100–0100
2-step (0.70)
Cycle 1 AM/TZP
4-step (0.62)
Cycle 2 CEC/AM CTX/TZP
Cycle 3 CEC/AM SAM/CTX
Cycle 4 CEC/AM SAM/ZOX
Cycle 5 CEC/AM SAM/CXM
Cycle 6 CEC/AM CPD/TZP
6-step (0.62)
Cycle 7 CEC/AM CTX/TZP(2x)*
Cycle 8 CEC/AM CTX/TZP SAM/CTX
Cycle 9 CEC/AM CTX/TZP SAM/ZOX
Cycle 10 CEC/AM CTX/TZP SAM/CXM
Cycle 11 CEC/AM CTX/TZP, CPD/TZP
*Steps visited twice along the paths
doi:10.1371/journal.pone.0122283.t012
Fig 18. Summary of Optimal CPM 2, 4, and 6 Step Antibiotic Cycles.In this figure, cycles are distinguished from paths in that TEM-1 (0000) is the first and last genotype visited, thus creating circular paths. An arrow indicates a substitution included in a mutational pathway which starts and ends at 0000, where the mutational pathway has a non-zero probability for the optimal treatment cycle. The substitutions that are included in optimal two steps cycles are shown in red. Substitutions that are included in optimal four and six step cycles are shown in blue. Four and six step cycles differ only in the number of substitutions and reversions that occur within each cycle. Their probabilities are identical.
doi:10.1371/journal.pone.0122283.g018
whereTis the generation time. Using a Taylor series approximation,
ln Wv
Wu
Wv
Wu
1: 2
IfWv>Wu, then
pu;v ¼
fv fu X
ðfuj fuÞ
3
is the probability forvto substituteu, whereujare the neighbors ofuwith higherfitness thanu
[23].
Equal Probability Model (EPM): According to the EPM model, the probabilities are equal for all beneficial substitutions, so that one needs the fitness graphs only for computing the probabilities. The matrix entryM(f)u,vis 1/Nif genotypeuhasNoutgoing arrows and there is
an arrow fromutov.
CPM is accurate if fitness differences between genotypes are small, while EPM may provide better estimates if fitness differences are substantial. Indeed, if the fitness effects of all available beneficial mutants exceed some threshold, then fixation probabilities are independent of fitness values [28]. We applied both CPM and EPM, since no complete theory for substitution proba-bilities exists. Additionally, comparison of two models is useful in learning how sensitive our results are for variation in substitution probabilities.
Time Machine Programs. Optimal antibiotic sequences and pathways of genotypes: LetM
(f(a)) denote the 16×16 transition matrix we derived for the antibiotic labeleda(S1 FileEPM Prepare andS2 FileCPM Prepare). For any sequencea1,a2,. . .akofkantibiotics, we consider
the matrix productM(f(a1))M(f(a2))M(f(a3)). This product is also a 16×16 transition matrix. Its entry in rowuand columnvis the fixation probability of genotypeumutating to genotype
vunder the antibiotic sequencea1,a2,. . .,ak. That probability is a sum of products of entries in
the individual matricesM(f(ai)), with one sum for each possible pathway of genotypes fromu
tov. The Time Machine enumerates all 15kantibiotic sequences of lengthk, and it selects all se-quences that maximize the entry in rowuand columnvof the matrix product (S3 FileEPM Run andS4 FileCPM Run). In a subsequent step we then analyze these optimal antibiotic se-quences, and for each such sequence, we extract the full list of genotype pathways that contrib-ute (S5 FileEPM Out andS6 FileCPM Out).
We implemented this algorithm in the computer algebra software Maple, and we ran it for
k= 2,3,4,5,6. The running time of the program is slow because of the exponential growth in the number of sequences. At present we do not know whether an efficient algorithm exists for solv-ing our optimization problem for larger values ofk.
Cycles of antibiotics: We also used this method to compute cyclical treatment paths in which the starting and ending genotypes were the wild type 0000 (S7 FileEPM CyclingOut andS8 FileCPM CyclingOut). The problem we solved was somewhat different from the previous one, in that we focused on obtaining the maximal probabilities of a cycle that includes some substi-tutions and then returns to the wild type without halting. Halting means that adjacent geno-types in a mutational pathway coincide, which is undesirable.
Supporting Information
S1 Fig. Locus Model.For any biallelic system and set of drugs, the maximum probabilities for returning to the wild-type depend on how many steps one allows in the treatment plan. The following example demonstrates that the maximum probabilities may increase by the number
of steps indefinitely. Consider a three-loci system where the genotypes are ordered as 000; 100; 010; 001; 110; 101; 011; 111: Assume that the starting point is the genotype 100 and that Drugs A and B (see the next page) are available. For the sequence A, the probability for ending at 000 is 0.9, for A-B-A 0.99, for A-B-A-B-A 0.999, and so forth.
(TIFF)
S1 File. EPM Prepare.File used to convert growth rate averages into data matrices. (TXT)
S2 File. CPM Prepare.File used to convert growth rate averages into data matrices. (TXT)
S3 File. EPM Run.Input file for computing the probabilities of all possible paths through the landscapes under the EPM Model.
(TXT)
S4 File. CPM Run.Input file for computing the probabilities of all possible paths through the landscapes under the CPM Model.
(TXT)
S5 File. EPM Out.Number of paths under the EPM model with the greatest probabilities and the antibiotics and genotypes included in those paths.
(TXT)
S6 File. CPM Out.Number of circular paths under the CPM model with the greatest probabil-ities and the antibiotics and genotypes included in those paths.
(TXT)
S7 File. EPM Cycling Out.Number of circular paths under the EPM model with the greatest probabilities and the antibiotics and genotypes included in those paths.
(TXT)
S8 File. CPM Cycling Out.Number of circular paths under the CPM model with the greatest probabilities and the antibiotics and genotypes included in those paths.
(TXT)
Author Contributions
Conceived and designed the experiments: PMM MB BS JCM DG KC. Performed the experi-ments: PMM BS JCM. Analyzed the data: MB PMM BS KC. Contributed reagents/materials/ analysis tools: MB BS JCM. Wrote the paper: MB PMM JCM BS KC DG.
References
1. Sears CL. A dynamic partnership: celebrating our gut flora. Anaerobe. 2005; 11(5):247–51. Epub 2006/ 05/17. doi:10.1016/j.anaerobe.2005.05.001PMID:16701579.
2. Syvanen M. Evolutionary implications of horizontal gene transfer. Annu Rev Genet. 2012; 46:341–58. Epub 2012/09/01. doi:10.1146/annurev-genet-110711-155529PMID:22934638.
3. Orr HA. Adaptation and the cost of complexity. Evolution. 2000; 54(1):13–20. Epub 2000/08/11. PMID: 10937178.
4. Tiwari K, Gupta RK. Rare actinomycetes: a potential storehouse for novel antibiotics. Crit Rev Biotech-nol. 2012; 32(2):108–32. Epub 2011/05/31. doi:10.3109/07388551.2011.562482PMID:21619453.
5. Kolar M, Urbanek K, Latal T. Antibiotic selective pressure and development of bacterial resistance. Int J Antimicrob Agents. 2001; 17(5):357–63. Epub 2001/05/05. PMID:11337221.
6. Gillespie SH. Antibiotic resistance in the absence of selective pressure. Int J Antimicrob Agents. 2001; 17(3):171–6. Epub 2001/04/03. PMID:11282261.
7. Kummerer K. Significance of antibiotics in the environment. J Antimicrob Chemother. 2003; 52(1):5–7. Epub 2003/06/14. doi:10.1093/jac/dkg293PMID:12805262.
8. Li WH. Retention of cryptic genes in microbial populations. Mol Biol Evol. 1984; 1(2):213–9. Epub 1984/ 02/01. PMID:6599964.
9. Shoja MM, Tubbs RS, Ansarin K, Varshochi M, Farahani RM. The theory of cycling antibiotic resis-tance. Med Hypotheses. 2007; 69(2):467–8. Epub 2007/02/07. doi:10.1016/j.mehy.2006.12.019 PMID:17280791.
10. Lipsitch M, Bergstrom CT, Levin BR. The epidemiology of antibiotic resistance in hospitals: paradoxes and prescriptions. Proc Natl Acad Sci U S A. 2000; 97(4):1938–43. Epub 2000/03/04. PMID: 10677558; PubMed Central PMCID: PMC26540.
11. Bergstrom CT, Lo M, Lipsitch M. Ecological theory suggests that antimicrobial cycling will not reduce antimicrobial resistance in hospitals. Proc Natl Acad Sci U S A. 2004; 101(36):13285–90. Epub 2004/ 08/17. doi:10.1073/pnas.0402298101PMID:15308772; PubMed Central PMCID: PMC516561.
12. Beardmore RE, Pena-Miller R. Rotating antibiotics selects optimally against antibiotic resistance, in theory. Math Biosci Eng. 2010; 7(3):527–52. Epub 2010/06/29. doi:10.3934/mbe.2010.7.527PMID: 20578784.
13. Beardmore RE, Pena-Miller R. Antibiotic cycling versus mixing: the difficulty of using mathematical models to definitively quantify their relative merits. Math Biosci Eng. 2010; 7(4):923–33. Epub 2010/11/ 17. doi:10.3934/mbe.2010.7.923PMID:21077716.
14. Goulart CP, Mahmudi M, Crona KA, Jacobs SD, Kallmann M, Hall BG, et al. Designing antibiotic cycling strategies by determining and understanding local adaptive landscapes. PLoS One. 2013; 8(2): e56040. Epub 2013/02/19. doi:10.1371/journal.pone.0056040PMID:23418506; PubMed Central PMCID: PMC3572165.
15. Jacoby GA. ß-Lactamase Classification and Amino Acid Sequences for TEM, SHV and OXA Extend-ed-Spectrum and Inhibitor Resistant Enzymes 2014. Available:http://www.lahey.org/Studies/.
16. Unckless RL, Orr HA. The population genetics of adaptation: multiple substitutions on a smooth fitness landscape. Genetics. 2009; 183(3):1079–86. Epub 2009/09/10. doi:10.1534/genetics.109.106757 PMID:19737750; PubMed Central PMCID: PMC2778961.
17. Schenk MF, Witte S, Salverda ML, Koopmanschap, Krug J, de Visser JA. Role of Pleiotropy During Ad-aptation of TEM-1 Beta-Lactamase to Two Novel Antibiotics. Evolutionary Applications. 2014. doi:10. 1111/eva12200
18. Barlow M, Hall BG. Predicting evolutionary potential: in vitro evolution accurately reproduces natural evolution of the tem beta-lactamase. Genetics. 2002; 160(3):823–32. PMID:11901104.
19. Mroczkowska JE, Barlow M. Fitness trade-offs in blaTEM evolution. Antimicrob Agents Chemother. 2008; 52(7):2340–5. Epub 2008/04/30. doi:10.1128/AAC.00018-08PMID:18443128; PubMed Central PMCID: PMC2443931.
20. Crona K, Greene D, Barlow M. The peaks and geometry of fitness landscapes. J Theor Biol. 2013; 317:1–10. Epub 2012/10/06. doi:10.1016/j.jtbi.2012.09.028PMID:23036916; PubMed Central PMCID: PMC3529755.
21. de Visser JA, Park SC, Krug J. Exploring the effect of sex on empirical fitness landscapes. Am Nat. 2009; 174 Suppl 1:S15–30. PMID:19456267. doi:10.1086/599081
22. Chevin LM. On measuring selection in experimental evolution. Biol Lett. 2011; 7(2):210–3. Epub 2010/ 09/03. doi:10.1098/rsbl.2010.0580PMID:20810425; PubMed Central PMCID: PMC3061150.
23. Gillespie JH. Molecular Evolution over the Mutational Landscape. Evolution. 1984; 38(5):1116–29. doi: 10.2307/2408444PMID:ISI:A1984TR39600017.
24. Haldane JBS. A mathematical theory of natural and artificial selection, Part V: Selection and mutation. P Camb Philos Soc. 1927; 23:838–44. PMID:ISI:000200163300095.
25. Weinreich DM, Delaney NF, Depristo MA, Hartl DL. Darwinian evolution can follow only very few muta-tional paths to fitter proteins. Science. 2006; 312(5770):111–4. PMID:16601193.
26. Kim S, Lieberman TD, Kishony R. Alternating antibiotic treatments constrain evolutionary paths to multi-drug resistance. Proc Natl Acad Sci U S A. 2014; 111(40):14494–9. Epub 2014/09/24. doi:10.1073/ pnas.1409800111PMID:25246554; PubMed Central PMCID: PMC4210010.
27. Hall BG, Acar H, Nandipati A, Barlow M. Growth rates made easy. Mol Biol Evol. 2014; 31(1):232–8. Epub 2013/10/31. doi:10.1093/molbev/mst187PMID:24170494.