129
NUTRITIONAL EVALUATION OF VARIOUS FEEDSTUFFS FOR LIVESTOCK PRODUCTION USING IN VITRO GAS METHOD
S. A. KHANUM, T. YAQOOB1, S. SADAF1, M. HUSSAIN, M. A. JABBAR1, H. N. HUSSAIN, R. KAUSAR AND S. REHMAN1
Nuclear Institute for Agriculture and Biology (NIAB) Faisalabad; 1
Livestock Production Research Institute Bahadarnagar, Okara, Pakistan
ABSTRACT
A study was undertaken to evaluate the nutritional quality of some conventional and non-conventional feed resources by using in vitro gas method. Samples of various feedstuffs were analyzed chemically, as well as by in vitro gas method. The feedstuffs having different digestibilities showed significant (P<0.05) differences in the rate and amount of gas production, metabolizable energy (ME) and digestibility of organic matter. Predicted metabolizable energy values were very low in feedstuffs having high fiber and low protein contents. These feedstuffs included various grasses, crop residues and wheal straw. Lowest ME value of 4.7 MJ/kg of dry matter (DM) was found in wheat straw. Many of the roughages (Sorghum vulgare, Kochia indica, Leptochloa fusca) studied were found to be deficient in fermentable carbohydrates, resulting in low organic matter digestibility. Concentrate feed stuffs like cotton seed meal, sunflower meal, cotton seed cakes, rice polish, rapeseed meal and Zea mays (maize) grains had higher ME values (9.27 – 12.44 MJ/kg DM). The difference of ME of various feedstuffs reflects different contents of fermentable carbohydrates and available nitrogen in cereals and protein supplements. Among the non-conventional feedstuffs, Acacia ampliceps, Acacia nilotica, Sesbania aculeata, Leptochloa fusca and Prosopis juliflora were found potential fodders. Extensive use of in vitro gas method proved its potential as a tool to evaluate various ruminant feeds for energy component.
Key words: Feed stuff, chemical composition, metabolizable energy, digestibility, in vitro gas method.
INTRODUCTION
Livestock industry is an important and integral part of agriculture sector in Pakistan. Livestock farming is vital for the supply of meat and milk and also a source of additional income for small farmers and livestock owners. Productivity of most of our animals is below their genetic potential, which is due to various factors like inadequate feeding, reproductive mismanagement, prevalence of diseases and lack of various support services such as artificial insemination. As population of Pakistan is increasing at a faster rate of 2.6 percent/year (Anonymous, 2005) the potential of livestock sub-sector needs to be exploited for meeting the requirements of meat and milk in the country. One of the major bottlenecks for fodder scarcity is shrinking of area under fodder cultivation as it is replaced by cash crops to meet the demand of human beings. Another constraint to livestock production is the scarcity and fluctuation of the quality and quantity of animal feed supply throughout the year. Quality and quantity of roughages vary seasonally. During the rainy season, plants grow rapidly, their quality may be good in the early season but they mature rapidly with a resulting decline in quality.
Ruminants are mostly fed on low quality roughages, which are poor in protein, energy, minerals and vitamin contents. Addition of foliage from tree species in ruminant diets can improve the utilization of low quality roughages mainly through supply of nitrogen to rumen microbes. The ruminants can make efficient use of mill by-products, crop residues and other non-conventional feed sources being equipped with rumen microbial ecosystem.
Various methods available for feed evaluation and digestibility studies through feeding experiments are expensive and require sophisticated laboratory equipment and animal keeping facilities. The diversity in the nutritive value of different feedstuffs needs some easy and efficient method of their nutritional evaluation; therefore, some alternative laboratory methods are required.
MATERIALS AND METHODS
Samples of various feedstuffs like grasses, cultivated fodders, salt tolerant plants, crop residues and browse plants, which are being used for feeding ruminants locally, were selected for nutritional evaluation. All the roughages were cut into small pieces so as to facilitate easy handling and uniform sampling for analysis. Samples were dried, grinded, passed through a 1 mm sieve and stored in polythene bags at room temperature. These samples were analyzed chemically, as well as by in vitro gas method after Menke and Steingass (1988).
Chemical analysis
Feed samples were analyzed for dry matter (DM), crude protein (CP), crude fiber (CF), ether extract (EE) and ash by standard analytical methods after AOAC (1990). The gross energy (GE) values of various feedstuffs were determined by using Bomb calorimeter (Sergio and Filho, 2005). Nitrogen free extract (NFE) was calculated by the following formula:
% NFE = 100-(%CP + %CF + %EE + %ash)
In vitro gas studies
Rumen fluid and particulate matter were collected from two Sahiwal cows kept on Sorghum vulgare fodder of the season and mixed ration. A mixture of rumen fluid and particulate matter was collected into pre-warmed CO2 filled beaker, transferred to the laboratory, homogenized in a laboratory blender and filtered through cheese cloth. All laboratory handling of rumen fluid was carried out under continuous flushing with CO2.
Feed samples (200 mg) were weighed in a small polypropylene weighing spoon, the spoon containing feed sample was fixed to a glass rod with a rubber adapter and finally the samples were transferred quantitatively to the closed end of the syringe. Each sample was taken in triplicate. With every batch of incubation, three syringes were taken as blank, 3 syringes for concentrate reference standard and 3 for roughage reference standard. The syringes were kept in an incubator set at 39°C. Media was prepared and kept in water bath at 39°C and bubbled with CO2 slowly for 15 to 20 minutes. A total of 30 ml media consisting of 10 ml rumen fluid and 20 ml of a bicarbonate-mineral-distilled water mixture was injected into the syringes through the silicon tube. The gas bubbles were pushed out and the silicon tube was closed with the clamps. The gas produced was recorded at 8 and 24 hours of incubation. After termination of the incubation,
contents of the syringes were emptied quantitatively in refluxing beakers, washed with two 20-ml portions of neutral detergent solution and digested for one hour. Then the contents were filtered, washed with hot water and transferred into crucibles. The crucibles were dried overnight and weighed after cooling in a desiccator. The crucibles containing the residue were transferred to a muffle furnace to ash the samples. After determining the weight of the ash, the organic matter content was calculated by difference.
Using chemical composition and net gas produced (GP, corrected for blank and the appropriate reference standard), at 24 hours incubation, metabolizable energy (ME, MJ/ kg dry matter) and digestibility of organic matter (DOM) were calculated by using the following mathematical equations adopted from Menke et al. (1979) and Menke and Steingass (1988).
For compound feed (cereals and byproducts):
DOM (%) = 9 + 0.9991 GP + 0.0595 CP + 0.0181 ash ME (MJ/Kg) = 1.06 + 0.1570 GP + 0.0084 CP + 0.0022 EE – 0.0081 ash
For roughages (forages and straws):
DOM (%) = 16.49 + 0.9042 GP + 0.0492 CP + 0.0387 ash
ME (MJ/Kg) = 2.20 + 0.1357 GP + 0.0057 CP + 0.0002859 EE
Statistical analysis
Treatment effects on random samples (in triplicate) were compared by the least significant difference (LSD) method. Significance of difference has been presented in the form of probability (P) values using MstatC software.
RESULTS
Crude protein in concentrate feedstuffs was found in the range of 38.3% (sunflower meal) to 12.4% (rice polish). The lowest value was found in wheat straw (2.6%) and in molasses (3.0%). The results revealed that CF, EE and NFE contents for roughages ranged from 13.8 to 35.1%, 1.0 to 4.8% and 29.5 to 62.9%, respectively, whereas in concentrate feed resources CF and EE were found to be 1.3 to 22.3 % and 1.0 to 15.9%, respectively.
Gas production (GP) at 24 hours incubation and
metabolizable energy contents of feed resources are shown in Tables 3, 4 and 5. The extent of gas volumes from the incubation of 200 mg feed sample for 24 hours ranged from 4.67 ml in wheat straw to 71.3 ml in Sesbania aculeata (Jantar). The concentrate feed resources had ME values in the range of 4.06-9.78 MJ/kg DM. These feedstuffs like cottonseed meal, sunflower meal, cottonseed cakes, rice polish and rapeseed meal showed low fiber (4.1-22.3%) and high protein contents (12.4-38.3%).
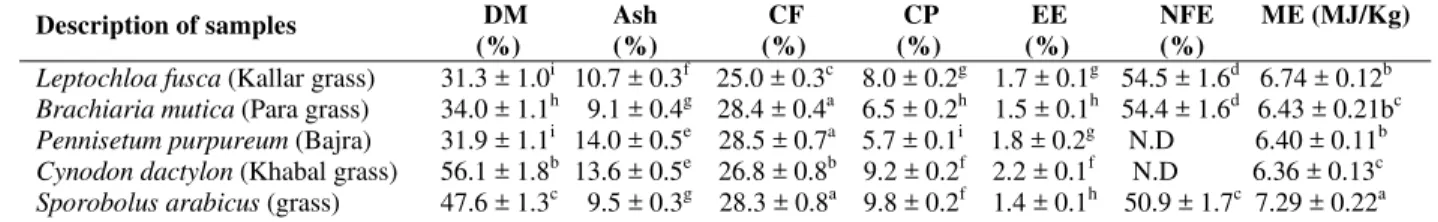
Table 1: Chemical composition and metabolizable energy (ME) of some salt- tolerant grasses on dry matter basis
Description of samples
DM Ash CF CP EE NFE ME (MJ/Kg) (%) (%) (%) (%) (%) (%)
Leptochloa fusca (Kallar grass) 31.3 ± 1.0i 10.7 ± 0.3f 25.0 ± 0.3c 8.0 ± 0.2g 1.7 ± 0.1g 54.5 ± 1.6d 6.74 ± 0.12b
Brachiaria mutica (Para grass) 34.0 ± 1.1h 9.1 ± 0.4g 28.4 ± 0.4a 6.5 ± 0.2h 1.5 ± 0.1h 54.4 ± 1.6d 6.43 ± 0.21bc
Pennisetum purpureum (Bajra) 31.9 ± 1.1i 14.0 ± 0.5e 28.5 ± 0.7a 5.7 ± 0.1i 1.8 ± 0.2g N.D 6.40 ± 0.11b
Cynodon dactylon (Khabal grass) 56.1 ± 1.8b 13.6 ± 0.5e 26.8 ± 0.8b 9.2 ± 0.2f 2.2 ± 0.1f N.D 6.36 ± 0.13c
Sporobolus arabicus (grass) 47.6 ± 1.3c 9.5 ± 0.3g 28.3 ± 0.8a 9.8 ± 0.2f 1.4 ± 0.1h 50.9 ± 1.7c 7.29 ± 0.22a
Values followed by different superscripts within each column differ significantly (P< 0.05). N.D = not determined.
Table 2: Chemical composition of some tree leaves and shrubs (salt-tolerant plants) capable of growing on saline wastelands (on DM basis)
Description of samples
DM Ash CF CP EE NFE (%) (%) (%) (%) (%) (%)
Leucaena leucocephala (Iple-iple) ` 38.4 ± 1.2f 8.4 ± 0.6h 15.7 ± 0.4f 19.9 ± 0.3a 4.3 ± 0.1a 51.7 ± 1.8e
Acacia ampliceps (Australian kekar) 22.0 ± 1.0j 20.7 ± 0.8d 19.6 ± 0.8d 10.3 ± 0.2e 3.2 ± 0.1c 46.1 ± 1.9f
Acacia nilotica (Desi kekar) 60.4 ± 1.9a 7.4 ± 0.6j 15.8 ± 0.6f 14.6 ± 0.4c 3.0 ± 0.2d 59.1 ± 2.1b
Kochia indica (Kochia) 19.5 ± 0.9k 22.9 ± 0.9c 19.5 ± 0.8d 11.6 ± 0.6e 1.5 ± 0.1h 44.5 ± 1.4f
Suaeda fruticosa (Lana) 33.5 ± 1.1h 38.5 ± 1.2a 13.8 ± 0.4h 7.0 ± 0.6b 1.1 ± 0.05i 29.5 ± 1.2g
Eucalyptus calmdulensis (Popular) 35.3 ± 1.0g 6.0 ± 0.3k 17.6 ± 0.3e 9.9 ± 0.2e 3.6 ± 0.1b 62.9 ± 2.3a
Azadirachta indica (Neem) 33.3 ± 1.0h 33.3 ± 1.0b 14.8 ± 0.8g 12.2 ± 0.4d 2.6 ±0.1e N.D
Eugenia fumbulina (Jaman) 40.5 ± 1.2e 7.9 ±.2i 15.7 ± 0.6f 7.5 ± 0.2g 2.1 ±0.2f N.D
Zizyphus jujuba (Beri) 56.3 ± 1.4d 8.5 ±.3h 15.2 ± 0.7f 12.5 ± 0.3d 1.4 ±0.1h N.D
Values followed by different superscripts within each column differ significantly (P< 0.05). N.D = not determined.
Table 3: Chemical composition and MEof various conventional fodders (on DM basis)
Description of samples
DM Ash CF CP EE ME (MJ/Kg) (%) (%) (%) (%) (%)
Saccharum officiniarum (Sugarcane top) 37.9 ±1.5a 9.5 ± 0.6d 25.8 ± 1.8f 6.7 ± 0.2g 1.3 ± .04g 5.89 ± 0.31g
Sesbania aculeata (Jantar) 17.2 ± 0.6e 10.8 ± 0.9c 17.0 ± 1.2h 20.5 ± 0.3a 4.8 ± .12a 7.96 ± .15d
Zea mays (Maiz fresh) 14.1 ± 0.5f 12.8 ± 0.8b 24.6 ± 1.3g 14.0 ± 0.2c 2.6 ± .09c 12.44 ± .21b
Zea mays fodder (Maiz old) 25.5 ± 0.9d 9.5 ± 0.6d 28.2 ± 1.3e 8.5 ± 0.3e 2.1 ±.05d 9.24 ± 0.22b
Sorghum vulgare (Chari) 28.8 ± 1.2c 6.8 ± 0.4f 28.3 ± 1.1e 4.6 ± 0.2i 1.6.04 ± .04f 9.90 ± 0.14a
Sadabahar 629/2002 28.8 ±1.2c 8.9 ± 0.6e 29.9 ± 1.2d 4.0 ± 0.2j 1.0 ±. 02h 7.00 ± 0.19e Sadabahar 637/2002 N.D 10.9 ± 0.7c 31.6 ± 1.3c 6.1 ± 0.2h 1.4 ±. 03g 8.17 ± 0.18b Sadabahar 638/2002 N.D 12.1 ± 0.9b 34.3 ± 1.4b 7.5 ± 0.2f 1.7 ± .03f 8.15 ± 0.22b Sadabahar 639/2002 N.D. 12.9 ± 1.1b 35.1 ±1.4a 9.3 ± 0.3d 1.8 ± .01e 8.47 ± 0.19b Sadabahar 640/2002 N.D. 13. ± 1.2a 34.1 ± 1.3b 6.6 ± 0.2h 1.6 ± .02f 7.23 ± 0.11c
Echinochloa crusgalli (Swank) 29.3 ±1.6b 13.4 ± 1.0a 25.7 ± 1.2f 15.6 ± 0.4b 2.8 ± .03b 9.46 ± 0.25a
Phragmites Straws (Nara) 31.6 ±1.3 12.6 ± .9b 34.1 ± 1.3b 14.9 ± 0.3c 2.1 ± .04d 6.53 ± 0.21f
DISCUSSION
The nutrient composition of many feed resources used in the present study is within the range of reported values in the literature for similar stuffs (Sayed et al., 1986). Dry matter and crude protein contents of different fodders showed wide variations. These variations could be a result of agronomic factors such as application of various levels of nitrogen fertilizers, time of harvest, ensiling, field drying and storage. Similar findings have been reported in Italian rye grass for its dry matter yield, which varied from 18.8 to 75.5% mainly due to different harvesting time (Bittante and Andrightto, 1982). Like DM and CP, other nutrients could also vary in different feeds due to agro-climatic conditions, cultural practices and post-harvest processing and storage conditions.
In general, predicted metabolizeable energy values were very low in the feedstuffs having high fiber and low protein contents. These feedstuffs included various grasses, crop residues and some tree leaves. Lower
metabolizeable energy values (4.7 and 5.8 MJ/kg) were found in wheat straw and Saccharum officiniarum (sugarcane tops), respectively. These roughages are deficient in fermentable carbohydrates, reflected by relatively low organic matter digestibility (Jayasuriya, 2000). Chemical treatment of feedstuffs like crop residues increases their feeding potential. Alkali treatment of fibrous materials has been well investigated and the possibility of using urea as a source of ammonia is documented (Owen and Jayasuriya, 1989).
The difference of metabolizeable energy of various feedstuffs reflects different contents of fermentable carbohydrates and available nitrogen in cereals and protein supplements. While fermentable carbohydrates increase gas production, it has been reported that addition of degradable nitrogen compounds to fiber rich feeds decreased gas production due to better or improved capturing of nutrients and higher production of microbial protein. The carbon source is diverted from gas to microbial protein (Menke and Steingass, 1988).
Table 4: Chemical composition (%) and ME of some concentrates (on DM basis)
Description of samples DM Ash CF CP EE ME (MJ/Kg)
UMMB block 90.3 ± 1.8c 11.2 ± 0.4b 09.9 ± 1.0d 31.5 ± 0.8d 01.01 ± 0.04e 4.06 ± 0.10d Sunflower meal 89.5 ± 1.0d 06.1 ± 0.3e 13.7 ± 0.6b 38.3 ± 1.5a 07.07 ± 0.90c 9.27 ± 0.12b Rapeseed meal 93.0 ± 0.9a 08.3 ± 0.5d 11.6 ± 0.4c 37.1 ± 1.3b 08.02 ± 0.65b 9.78 ± 0.24a Maize gluten 92.9 ± 1.0b 07.8 ± 0.2d 01.3 ± 0.1f 21.9 ± 0.9e 07.00 ± 0.23c 9.06 ± 0.20b Cottonseed cakes 92.5 ± 1.2b 06.0 ± 0.5f 22.3 ± 1.2a 21.1 ± 0.7e 08.05 ± 0.56b 7.77 ± 0.23c Rice polish 92.6 ± 0.78b 11.9 ± 0.5a 04.2 ± 0.2e 12.4 ± 0.8f 15.09 ± 1.25a 7.87 ± 0.12c Cottonseed meal 86.3 ± 1.1e 08.2 ± 0.6d 12.2 ± 0.3c 34.3 ± 1.1c 04.05 ± 0.45d 9.74 ± 0.26a
Molasses 82.3 ± 1.2f 10.3 ± 0.9c N.D 03.0 ± 0.04g N.D N.D
Values followed by different superscripts within each column differ significantly (P<0.05). N.D = not determined.
Table 5: Energy potential of various salt tolerant plants used as fodder for goat and sheep rearing on saline waste lands
Salt tolerant plants GE ME TD GP (MJ/kg DM) (MJ/kg DM) (g/kg) (ml/200mg DM) Acacia ampliceps (Australian kekaer) 18.04 ± 1.1h 7.26 ± 0.26d 713.5 23.67 ± 1.2g Sesbania aculeata (Jantar) 22.34 ± 1.0d 7.96 ± 0.24c 700 71.03 ± 1.6a Leucaena leucocephala (Iple iple) 22.66 ± 1.1c 8.71 ± 0.29b 596.5 38.17 ± 1.1c Acacia nilotica (Desi kekar) 25.76 ± 1.2b 7.09 ± 0.23e 589 28.17 ± 1.0e Wheat straw 13.93 ± 0.8j 4.70 ± 0.14h 384.7 04.67 ± 1.1h Kochia indica (Kochia) 17.61 ± 0.9i 6.41 ± 0.20g 404.5 26.67 ± 0.9f Sorghum vulgare (Charay) 21.59 ± 1.2e 9.91 ± 0.32a 473 49.03 ± 1.3b Leptochloa fusca (Kallargrass) 20.24 ± 1.3g 6.75 ± 0.28f 330.5 34.17 ± 1.2d Pennisetum purpureum 19.66 ± 0.9g 6.02 ± 0.19g 482 26.00 ± 1.1g Brachiaria mutica (Para grass) 29.29 ± 1.3a 6.44 ± 0.23f N.D 27.17 ± 1.2f Sporobolus arabicus (grass) 20.56 ± 1.2f 7.29 ± 0.32d 467 N.D
Although the predictive metabolizeable energy values were found within the range of reported values for a large number of feedstuffs (Sen et al.,1978; Krishnamurthy et al., 1995), yet some feedstuffs showed a significant variation in metabolizeable energy values, e.g., different varieties of sorghum resulted in metabolizeable energy values of 7.0-9.9 MJ/kg dry matter. A wide range in predicted metabolizeable energy among the varieties of sorghum may be due to different agronomic conditions at different farms. These variations may also be due to low quality of samples or different origins or areas, used in these studies. However, some of the differences in the predicted metabolizeable energy values are difficult to explain at this stage like urea molasses multinutrient blocks. A
low predicted metabolizeable energy for fresh maize fodder in comparison to mature maize may be attributable to an early stage of harvest as the samples obtained were from fodder harvested before the formation of grain.
Except a few feeds, the energy values and rate of organic matter fermentation calculated from in vitro gas method seems to be quite comparable with the values available in the literature for different feedstuffs. Extensive use of this technique could prove its potential as a tool to evaluate various ruminant feeds for energy component.
Acknowledgements
These studies were conducted under IAEA/RCA project (RAS05/035). The authors would like to express their sincere thanks to International Atomic Energy Agency (IAEA) for financial and technical support. Our sincere thanks are also due to those who, in one way or the other, contributed greatly to the accomplishment of the study.
REFERENCES
Anonmyous, 2005. Global network on integrated soil management for sustainable use of salt affected soils. FAO and Plant Nutrition Management Service, Rome, Italy.
AOAC, 1990. Official Methods of Analysis. Association of Official Analytical Chemists, Washington, DC, USA.
Bittante G. and I. Andrightto, 1982. Preservation of Lolium multrlorum Lam. 1. Quantitative and qualitative changes during hay making and ensiling. Inst. Zootocnica, Univdegli Studi, Via, Gradentigo, Italy, 8: 44-45.
Getachew, G., M. Blummel., H. P. S. Makkar and K. Becker, 1998. In vitro gas measuring techniques for assessment of nutritional quality of feeds. Anim. Feed Sci. Technol., 72: 261-281.
Jayasuriya, M. C. N., 2000. Principles of ration formulation for ruminants. Proceedings of the final review and planning meeting of an IAEA Technical Cooperation Regional AFRA Project organized by Joint FAO/IAEA Division of Nuclear Techniques in Food and Agriculture, Cairo, Egypt, 25-29.
Krishnamurthy, U., H. Soller, H. Steingass and K. H. Menke, 1995. Energy and protein evaluation of tropical feed stuffs for whole tract and ruminal digestion by chemical analysis and rumen inoculum studies in vitro. Anim. Feed Sci. Technol., 52: 177-188.
Menke, K. H. and H. Steingass, 1988. Estimation of the energetic feed value from chemical analysis and in vitro gas production using rumen fluid. Anim. Res. Develop., 28: 7-55.
Menke, K. H., L. Raab, A. Salewski, H. Steingass, D. Fritz and W. Schneider, 1979. The estimation of the digestibility and metabolizable energy contents of ruminant feedstuffs from the gas production when they are incubated with rumen liquor in vitro. J. Agri. Sci. Camb., 92: 217-222.
Owen, E. and M. C. N. Jayasuriya, 1989. Use of crop residues as animal feeds in developing countries. Res. Develop. Agri., 6: 129-138.
Sen, K., S. N. Ray and S. K. Ranjhan, 1978. Nutritive value of Indian cattle feeds and the feeding of animals. Indian Council of Agri, Res., New Delhi, India.
Sayed, S. A. R., Aurangzeb, M. Ahmad, S. B. A. Shah and I. Khan, 1986. Nutrient composition of some common feeds available in the North West Frontier Province of Pakistan. The Nucleus, 23: 27-32. Sergio, L. G. and N. Filho, 2005. The effects of