www.ijpes.com
International Journal of Psychology and Educational
Studies
The impact of interdependent cross-age peer tutoring on social and
mathematics self- concepts
Mirjan Zeneli
1, Peter Tymms
2and David Bolden
31,2,3Durham University, United Kingdom
AR TICL E IN FO A BS TRA CT
Article History: Received 02.02.2016 Received in revised form 10.02.2016
Accepted 24.03.2016 Available online 01.05.2016
This paper adds to the limited body of literature and concentrates on investigating the impact of a new peer tutoring framework, ‘Interdependent Cross Age-Peer Tutoring’ (ICAT), on the socio-academic process of learning of self-concepts. ICAT is informed by Social Interdependence Theory, a socio-psychological perspective which aims to make cross-age peer tutoring more cooperative. The intervention took place in 2013 with three schools in England: Two of the schools adopted a pre-post-test quasi experimental design and one school (school C) adopted a single group design. In school A Year 8 students tutored Year 6 (n=201), in school B Year 9 students tutored Year 7 (n=115), and in school C Year 10 students tutored Year 8 (n=102). ICAT was applied once a week for a period of 35-40 minutes across six weeks, covering school-planned mathematic topics. For school A, which implemented ICAT according to programme specifications, some positive and significant effect sizes were observed.
© 2016 IJPES. All rights reserved Keywords:1
Social Interdependent Cross-Age Peer Tutoring, Mathematics Self-Concept, Social Interdependence, Cooperative Learning.
1. Introduction
Peer tutoring is a form of peer learning intervention which takes place in an academic context, it can be one-to-one or one-to-many (Topping & Ehly, 1998). It has been applied to improve the self-concept of children within various core curriculum areas such as literacy (Gisbert & Font, 2008; Miller, Topping, & Thurston, 2010; Sporer, & Brunstein, 2009; Thurston, Duran, Cunningham, Blanch, & Topping, 2009; Tymms, Merrell, Thurston, Andor, Toping & Miller, 2011; Yarrow & Topping, 2001) or mathematics (Bar-El & Raviv, 1982; Fantuzzo, King, & Heller, 1992; Ginsburg-Block, & Fantuzzo 1998; Sharpley, Irvine, & Sharpley 1983; Tymms, et al, 2011). The method has been reported in several meta-analyses to be an effective education intervention in improving not only academic performance (Zeneli, Thurston & Roseth, 2016), but also in improving students’ academic and social self-concepts (Cohen, Kulik & Kulik, 1982; Leung, Marsh, Craven, Yeung & Abduljabbar, 2013).
A meta-analysis has also shown that peer tutoring interventions in which students are interdependent by goals and rewards, as set by students themselves, and informative/autonomous structures have high effect sizes for self-concept variables (Ginsburg-Block, et al., 2006).
Some of the most common peer tutoring interventions are: Class-wide peer tutoring (CWPT) (Delequari, Greenwood, Streeton & Hall 1983), reciprocal peer tutoring (RPT) (Fantuzzo, King, & Heller 1992), paired
1 Corresponding author’s address: Leazes Road, Durham University, Durham, United Kingdom, DH1 1TA
Telephone: (0044) 078 078 55353 Fax: +00 44 (0) 191 334 8311 e-mail: [email protected]
4This is an ESRC funded research, DTC grant number: ES/I007296/1 http://dx.doi.org/10.17220/ijpes.2016.02.001
assisted learning (PALS) (Mathes & Simon, 1997; Fuchs, Fuchs, Karns, Hamlett, Katzarokt & Dudka, 1998; Fuchs, S.L, Fuchs, D, Kazdan, Allen, 1999), and cross-age peer tutoring (Fitz-Gibbon, 1990; ‘Author, Date’). Interventions such as CWPT, RPT and PALS have been applied to a same-age context. All have a reciprocal dimension, and all consist of goal and reward interdependence elements as well as a structured format. The interventions differ mainly in how the pairs are created, who sets the goals and rewards, and the interactions of the tutee with the tutor.
Most peer tutoring interventions have to date concentrated on exploring the impact of the intervention on performance improvement as opposed to investigating wider process of learning variables such as social or academic attitudes. It is the aim of this paper to concentrate on investigating the impact of peer tutoring on such process of learning variables.
2. Significance for this study
There are strong theoretical and empirical claims that cross-age peer tutoring improves process of learning elements related to social and academic attitudes. These claims have emerged from various theories such as: Role Theory (Sarbin, 1976), Social Constructivism (Topping & Ehly 1998) and the broader framework of Social Interdependence Theory (Johnson, D.W., & Johnson, R., T, 1987; 1989; Roseth, Johnson, D,W., & Johnson, R.T., 2008). With social interdependence perspectives incorporating elements from both Role Theory and Social Constructivism, while emphasising positive interdependence with the purpose of enhancing process of learning elements, such as cooperation within a group.
Past research has already investigated the impact of peer tutoring on socio-psychological process of learning characteristics related to self-perceptions. However, this paper is still significant for at least three reasons: Firstly, the peer tutoring intervention adopted here combines characteristics that have been identified as effective in terms of improving both, performance as well as attitude elements. Specifically, ‘Interdependent Cross-Age Peer Tutoring’ (ICAT) is the first method to adopt a cross-age peer tutoring intervention influenced by social interdependence concepts, which aims to improve broader aspects of learning as opposed to only performance. Many interdependent elements such as goal interdependence or informative/autonomous structure have to date only been applied in a reciprocal, same-age as opposed to a cross age context (Author, Date). Therefore the impact of ICAT on broader process of learning elements is not yet known.
Secondly, the paper contributes to what is called ‘secondary analyses’ or process of learning analyses in peer learning. It provides additional views on the wider influence of peer tutoring, which can then further strengthen debates and inform academics, policy-makers and teachers. The majority of studies which have investigated the impact of peer tutoring on attitude variables have either concentrated on its impact on academic or social aspects, as opposed to both.
Finally, one of the most established relationships in education is the reciprocal relationship of subject-specific academic self-concept and academic performance (Marsh W., & O’Mara 2008). Therefore, if researchers are able to identify interventions which have an impact on such self-concept variables, then this can aid the understanding of how specifically peer tutoring improves academic performance.
3. Aim and research questions
The aim of this research was to investigate the impact of ICAT on a range of attitude variables, both social as well as academic. Specifically the research answered these five questions:
1) Does ICAT improve mathematics self-concept?
2) Does ICAT improve mathematics intrinsic motivation?
3) Does ICAT improve how students perceive their level of choice when doing mathematics? 4) Does ICAT improve how students relate to people in mathematics classes?
4. Method
4.1 Participants
A total 550 students from three schools across England participated in the study; two schools in the North East of England and one in the South East. For an expected effect size of 0.55, which is the average effect size found in peer tutoring interventions in mathematics (Zeneli, 2015), a significance level of 0.05 (one tailed t-test), and a power of 0.8, the total sample requirement for each school is 84, or 42 per each group.
School A involved Year 8 tutoring Year 6, with ages ranging from 9-13 in this school. For school B Year 9 tutored Year 7, with an age range of 11-16 for the entire school. And school C Year 10 tutoring Year 8, consisted of an age range from 11-19.
There were in total 24 teachers who participated in the project, with an age range of 25-56, and a teacher experience range of to3-25 years.
4.2 Design
Schools A and B adopted a pre/post-test quasi experimental design and school C adopted a pre/post-test single group design.
Table one presents the design and the data collected and table three presents the gender composition of each group:
Table 1. Design and data collected
Schools Length & control groups. Attitude Data
A
Six weeks, pre-post-test quasi experimental design.
Pre-post, for all Year 6s and Year 8s.
B
Six weeks, pre/post-test quasi experimental design.
Pre-post, for all Year 9s and Year 7s.
C
Six weeks, pre-post-test single group design.
Pre-post, for peer tutoring Year 10s and Year 8s.
In school A the control group consisted of 8 free school meal students (FSM), and 6 for the peer tutoring group. For school B, the control group contained 17 FSM students, and the peer tutoring group 15 students, while for or school C, the single group design, there were 19 FSM students. In other words, for schools A and B, which adopted a quasi-design, the groups within each school were approximately balanced in terms of FSM students.
4.3 Intervention Procedures
Materials/exercises. The topics were chosen and created by the school personnel and the researchers to
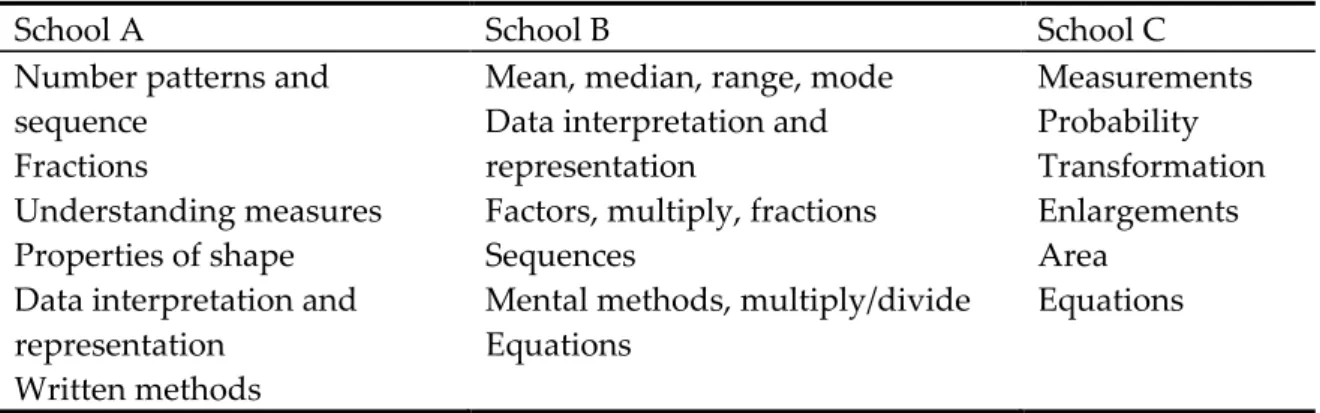
reflect their lessons, with the control group concentrating on the same topic as the intervention group. Table two below provides a list of topics covered by each school during the 6 weeks project.
Table 2. Topics by schools
School A School B School C
Number patterns and sequence
Fractions
Understanding measures Properties of shape Data interpretation and representation
Written methods
Mean, median, range, mode Data interpretation and representation
Factors, multiply, fractions Sequences
Mental methods, multiply/divide Equations
Measurements Probability Transformation Enlargements Area
Organisation. All school participating in the programme agreed to 35-40 minutes of ICAT for a period of six weeks, and an additional 45 minutes of student training. The project commenced during the last term of the 2012-3 school year. The short questionnaires were administered and collected by the teachers.
Consent. An opt-out ethics consent form was presented to students and their parents. Teachers who did
not wish to participate in the ICAT intervention were given the choice to serve in the control group. Ethical approval was gained from Durham University. Also, USB sticks with the ICAT framework were provided to each school for future professional developments, and the schools were assured that if they required any future assistance help would be provided.
Pair and Class set up.The pairings of the students were conducted by the mathematics head teachers
within each school in the following way: The highest performer of the older age male students paired with the highest performer of the younger male age, and so on down the line, the same for the girls. Same sex pairings were carried out, considering that same sex grouping provide higher effect sizes (Rohrbeck, et al., 2003). The two year age gap is consistent with past cross age peer tutoring interventions (Topping, et al, 2003; Tymms, et al, 2011), and recommended by many experts in peer tutoring (Thurston, 2014; Tymms & Merrell, 2015). The pairs then worked together for the six week duration of the project.
4.4 Teacher and Student Training
Training was conducted in a top-down small group cascade model: The researcher trained head teachers and facilitators, who trained the teachers, and the teacher trained the students. Training was provided to mathematics head teachers and in-house facilitators in these areas:
Theory. This section covered the logic behind peer tutoring and the body of literature which aims to
explain its functioning.
Practicing ICAT. Teachers and facilitators engaged in individual role-play on the ICAT framework.
How to conduct training of the teachers and the students to cover on both academic and social communication skills:
The trained staff were advised to carry out role play with the teachers and the students for both: the academic framework and interpersonal communication skills, such as providing praise accurately and synchronising the tone of voice with the body language and the context overall.
Teachers and students received one full session of 45 minutes on the ICAT and interpersonal communication skills. It is argued that training of the students is essential in the success of peer tutoring (Harrison & Cohen, 1971; Barron & Foot, 1991; Leung, 2014).
4.5 ICAT intervention framework
The ICAT framework, to which the students worked, consisted of four parts, together creating an informative/autonomous structure with the tutor providing implicit and explicit help:
In the first part, ‘Goal’, the students set an academic goal in pairs. This is a number threshold which becomes the performance goal they wish to achieve in a turn-taking test at the end.
During the second part, ‘Practice-Test’ the tutor prompts the tutee to answer various mathematics questions from very easy to very challenging. New mathematics concepts are introduced at this stage and maximum interaction is expected.
In the third part, ‘Connect’, the tutee is prompted by the tutor to connect/link the new concepts to previous mathematics concepts (Mevarech & Kramarski, 1997) as well as to real life events (Tymms, et al, 2011). This part was aimed to help students improve cognitive and meta-cognitive engagement in mathematics. During the second and the third stages the tutor is asked to provide implicit and then explicit help to the tutee, rather than show the answer to the tutee, similar to RPT interventions (Fantuzzo & Ginzburg-Block, 1998).
to the students for each correct exercise in the turn-taking test, is intentionally generous, therefore enhancing the chances for the pair to meet their goal and consequently improve their mathematics self-concept.
4.6 Instruments
The questionnaire contained five sub-scales:
The mathematics self-concept sub-scale was adopted from Marsh’s ‘Academic Self-Description Questionnaire 1’ (ASDQ-1) (1990). Four items were chosen from this sub-scale. Three sub-scales were adopted and modified from Ryan and Deci’s (2012) ‘Intrinsic Motivation Instrument’ (IMI) (IMI website): a) mathematics intrinsic motivation (enjoyment), with three items, b) relating to people in mathematics classes, with four items, and c) choice of how to do mathematics in class, consisting of three items. Finally, the social self-concept scale was a researcher-adapted instrument, inspired by Harter (1985), consisting of three items.
Consent was obtained from the authors for all the instruments.
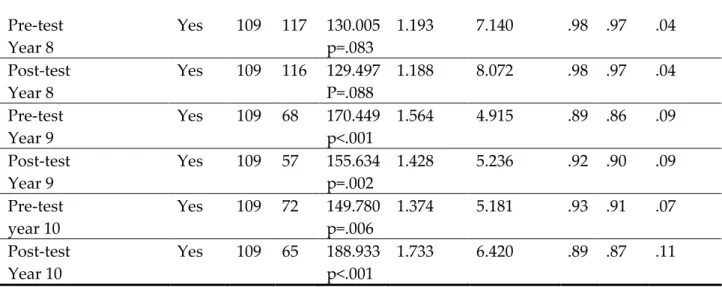
Exploratory and confirmatory factor analyses were conducted with the instruments, to re-test for reliability. It was predicted that apart from two sub-scales, mathematics intrinsic motivation and mathematic self-concept which are similar in nature, the remaining sub-scales would not strongly correlate with one another, however each item would relate strongly to their sub-scale. The analyses were conducted by AMOS 20 and diagram outputs showed that the model was mostly confirmed. Table 3 on the next page presents the model indices on various age groups:
Table 3. Instrument development and CFA coefficients by year and school
Assumptions CMIN CFI TLI RMSEA
Nor- malit-y
DF N Chi Default
Model
Independent Model
Tutees:
Pre-test year 6 (First model development)
Yes 219 101 345.702
p<.001
1.579 6.813 .91 .90 .08
CFA: Confirming the Model
Pre-test Year 6 (Final model 17 items)
Yes 109 101 131.964
p=.067
1.21 7.40 .97 .97 .05
Post-test Year 6
Yes 109 99 165.558
p<.001
1.519 8.769 .95 .93 .07
Pre-test Year 7
Yes 109 66 149.793
p=.006
1.374 4.955 .92 .91 .08
Post-test Year 7
Yes 109 66 182.470
p<.001
1.674 6.521 .90 .88 .10
Pre-test Year 8
Yes 109 43 139.954
p=.024
1.284 4.798 .94 .93 .08
Post-test Year 8
Yes 109 44 162.029
p=.001
4.7 Analysis
Performance was analysed by using SPSS 20:
Analysis of Covariance (ANCOVA) was used for schools A and B, which adopted the pre/post-test quasi experimental designs, since the design controls for pre-test score differences. For the single group design, school C, a dependent t-test was applied.
For the quasi-experimental designs, schools A and B, the effect size was calculated by using Cohen’s d technique with the square root of the MSerror as the denominator. For school C, Hedge’s g pooled standard deviation was used to calculate the effect size, since the design in this school differed from schools A and B.
5. Findings
5.1 Attrition rate and implementation
Table four reports the attrition rates by data collection type. As can be seen, school B’s control group and school C in general showed a large attrition rate, in total ranging from 25-43%.
Detailed implementation data are reported in a separate study currently in the publication process. However, classroom and student pair observation as well as analysis of ICAT lesson materials of the six weeks’ materials indicated that school A implemented ICAT better than schools C and D, and school C implemented it better than school B.
Tutors:
Pre-test Year 8
Yes 109 117 130.005
p=.083
1.193 7.140 .98 .97 .04
Post-test Year 8
Yes 109 116 129.497
P=.088
1.188 8.072 .98 .97 .04
Pre-test Year 9
Yes 109 68 170.449
p<.001
1.564 4.915 .89 .86 .09
Post-test Year 9
Yes 109 57 155.634
p=.002
1.428 5.236 .92 .90 .09
Pre-test year 10
Yes 109 72 149.780
p=.006
1.374 5.181 .93 .91 .07
Post-test Year 10
Yes 109 65 188.933
p<.001
Table 4. Attrition rate % for each data collection type by group and school for the tutees and tutors
Schools Year Groups Attitude
questionnaires %*
School A
Year 8 students
tutoring Year 6 students
8
Peer Tutoring 6 missing 6/54=11%
Control 3 missing 3/62=5%
6
Peer Tutoring 8 missing 8/54=15%
Control 10 missing 10/58=17%
School B
Year 9 students tutoring Year 7 students
9
Peer Tutoring 8 missing 8/36=22%
Control 17 missing 17/42=40%
7
Peer Tutoring 2 missing 2/36=6%
Control 11missing 11/39=28%
School C
Year 10 students tutoring Year 8 students
10
Peer Tutoring 20 missing 20/80=25%
8 Peer Tutoring 32 missing 32/74=43%
5.2 Regression to the mean
Also, a point to discuss is the regression to the mean concept. The phenomenon could be a problem when conducting quasi-experimental designs. It emerges when the groups, intervention or control, fall at the extreme end of the entire samples’ mean during the pre-test, and then adjusts itself during the post-test. This leads to the groups not being equal on pre-test scores. This situation is usually eliminated by strict randomisation or performance matching. Hence, it is generally the case that the control or the intervention group result in bias due to chance (Trochim, 2012).
Trochim (2012) suggests that one way to establish whether there was a regression to the mean is to look at the relationship of the pre-test and the post-test scores for each group, intervention and control, and see if the students who scored high in the pre-test also scored high in the post-test, hence establishing that the results were not by chance. The formula for measuring the amount of regression to the mean is 100(1-r), where r is the correlation. The higher the correlation, the lower the percentage of the regression to the mean (Trochim, 2012).
Regression to the mean analyses were undertaken for all self-concept variables in the project, performance and attitude variables, for both schools A and B. Most variables showed a 20-30% regression to the mean, however, since this phenomenon appeared for both groups in all variables, control and intervention groups, the threat to inflating the effect size is extremely small, as regression to the mean for any variable has cancelled itself out, and therefore poses no danger to the results.
5.3 Statistical requirements
Statistical requirement investigations for ANCOVAS were also conducted, and many of the variables showed violated statistical assumptions. However, since the sample size for the schools was higher than 30 participants, the violated assumptions should not have majorly implicated the final results (Howell, 2010).
5.4 Attitude Variables
Table 5. Pre-test score differences by variables and schools
Student Attitude Pre-test
mean peer tutoring
Std.Dev n
Pre-test mean control
Std. Dev
n Sig
two tailed
School A Year 6 (Tutees)
Mathematics self-concept 17.91 5.02 46 19.81 4.09 48 .047
Mathematics enjoyment 11.85 4.89 46 13.60 4.79 48 ns
Relating to people in mathematics classes 19.15 5.61 46 20.29 4.25 48 ns
Social self-concept 14.41 4.66 46 14.35 3.84 48 ns
Choice 11.20 4.6 46 10.83 4.60 48 ns
School B Year 7 (Tutees)
Mathematics self-concept 16.65 5.37 34 16.36 5.96 28 ns
Mathematics enjoyment 10.21 4.73 34 10.42 5.55 28 ns
Relating to people in Mathematics classes 17.62 4.58 34 19.04 5.44 28 ns
Social self-concept 13.09 3.5 34 14.04 3.99 28 ns
Choice 12.94 4.19 34 12.14 4.61 28 ns
School A Year 8 (Tutors)
Mathematics self-concept 19.65 3.8 48 17.75 4.13 59 .016
Mathematics enjoyment 13.58 4.88 48 12.32 3.80 59 ns
Relating to people in mathematics classes 19.25 3.91 48 18.64 5.06 59 ns
Social self-concept 13.81 4.12 48 14.54 4.33 59 ns
Choice 12.77 2.77 48 10.67 3.99 59 .003
School B Year 9 (Tutors)
Mathematics self-concept 18.00 3.24 28 16.20 2.46 25 .029
Mathematics enjoyment 11.14 5.13 28 9.28 3.93 25 ns
Relating to people in mathematics classes 18.17 4.97 28 14.28 3.72 25 .002
Social self-concept 14.16 3.82 28 13.96 3.95 25 ns
Choice 13.04 4.30 28 10.88 3.10 25 .043
Tables 6 and 7 report the effect sizes and the significance level for each variable and school:
School A - Attitude findings are reported for both tutee and tutor, with the effect sizes being higher for
the tutors:
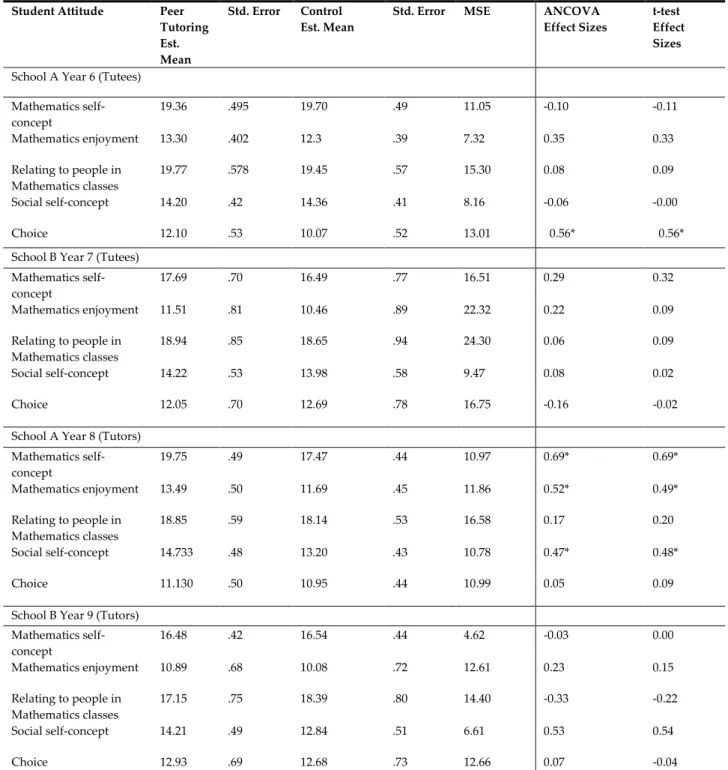
Year 6 (tutees). - There was no significant main effect for the Year 6 students on; a) mathematics concept, b) mathematics intrinsic motivation, c) relating to people in mathematics classes, and d)social self-concept.
There was, however, a significant main effect on the level of choice perceived in mathematics classes for the Year 6 students, F(1, 93)= 7.37, significant at (p=.008), effect size 0.56. Year 6 peer tutoring students gained significantly more scores in choice of how to do mathematics in class (Mean 12.09) relative to the control group (mean 10.07), Mse=13.01 with mean difference=2.02.
Year 8 (tutors). - There was no significant main effect for how Year 8 students related to people in mathematics classes or choice of how mathematics was conducted in class.
There was also a significant main effect for treatment on mathematic enjoyment for the Year 8 students, F(1, 106)=7.12, significant at (p=.009), effect size 0.49. The treatment group gaining significantly higher mathematic enjoyment scores (mean 13.49) than the control group (mean 11.69), Mse=11.86 mean difference=1.80.
Finally, there was a significant main effect for the social self-concept of the Year 8 students, F(1, 106)=5.72, significant at (p=.05), effect size 0.48; with the treatment group having gained a significantly higher social self-concept score (mean 14.73) than the control group (mean 13.20), Mse=10.78, mean difference=1.53.
School B: For the Year 9 student tutoring a Year 7 student, none of the attitude variables were statistically
significant for the tutors or the tutees. Overall most of the effect sizes were positive.
Table 6. School A and B effect sizes
Student Attitude Peer Tutoring Est. Mean
Std. Error Control Est. Mean
Std. Error MSE ANCOVA Effect Sizes
t-test Effect Sizes
School A Year 6 (Tutees)
Mathematics self-concept
19.36 .495 19.70 .49 11.05 -0.10 -0.11
Mathematics enjoyment 13.30 .402 12.3 .39 7.32 0.35 0.33
Relating to people in Mathematics classes
19.77 .578 19.45 .57 15.30 0.08 0.09
Social self-concept 14.20 .42 14.36 .41 8.16 -0.06 -0.00
Choice 12.10 .53 10.07 .52 13.01 0.56* 0.56*
School B Year 7 (Tutees)
Mathematics self-concept
17.69 .70 16.49 .77 16.51 0.29 0.32
Mathematics enjoyment 11.51 .81 10.46 .89 22.32 0.22 0.09
Relating to people in Mathematics classes
18.94 .85 18.65 .94 24.30 0.06 0.09
Social self-concept 14.22 .53 13.98 .58 9.47 0.08 0.02
Choice 12.05 .70 12.69 .78 16.75 -0.16 -0.02
School A Year 8 (Tutors) Mathematics self-concept
19.75 .49 17.47 .44 10.97 0.69* 0.69*
Mathematics enjoyment 13.49 .50 11.69 .45 11.86 0.52* 0.49*
Relating to people in Mathematics classes
18.85 .59 18.14 .53 16.58 0.17 0.20
Social self-concept 14.733 .48 13.20 .43 10.78 0.47* 0.48*
Choice 11.130 .50 10.95 .44 10.99 0.05 0.09
School B Year 9 (Tutors) Mathematics self-concept
16.48 .42 16.54 .44 4.62 -0.03 0.00
Mathematics enjoyment 10.89 .68 10.08 .72 12.61 0.23 0.15
Relating to people in Mathematics classes
17.15 .75 18.39 .80 14.40 -0.33 -0.22
Social self-concept 14.21 .49 12.84 .51 6.61 0.53 0.54
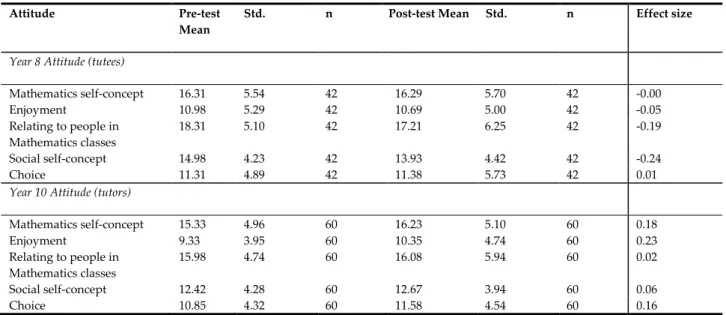
Table 7. School C effect sizes
Attitude Pre-test
Mean
Std. n Post-test Mean Std. n Effect size
Year 8 Attitude (tutees)
Mathematics self-concept 16.31 5.54 42 16.29 5.70 42 -0.00
Enjoyment 10.98 5.29 42 10.69 5.00 42 -0.05
Relating to people in Mathematics classes
18.31 5.10 42 17.21 6.25 42 -0.19
Social self-concept 14.98 4.23 42 13.93 4.42 42 -0.24
Choice 11.31 4.89 42 11.38 5.73 42 0.01
Year 10 Attitude (tutors)
Mathematics self-concept 15.33 4.96 60 16.23 5.10 60 0.18
Enjoyment 9.33 3.95 60 10.35 4.74 60 0.23
Relating to people in Mathematics classes
15.98 4.74 60 16.08 5.94 60 0.02
Social self-concept 12.42 4.28 60 12.67 3.94 60 0.06
Choice 10.85 4.32 60 11.58 4.54 60 0.16
School C: Also, for the Year 10 student tutoring a Year 8 student none of the attitude variables were
statistically significant for the tutors or the tutees of school C. Most of the tutee effect sizes were negative although very low, while for the tutors they were positive.
6. Discussion
Overall the tutors seemed to have gained more than the tutees in terms of attitude, especially for school A and C, with school A showing significant effect sizes for three out of five tutors’ attitude variables: Mathematics self-concepts, mathematics enjoyment, and social self-concept. The only other attitude variables that was significant was that of school A’s choice of how mathematics was done in schools (locus of control) for the tutees.
What explains the findings on significant variables? One element which can shed light on the findings in
terms of explaining why there were significant effect sizes for school A, is that school A implemented ICAT better than schools B and C. As mentioned, detailed implementation data are reported in a separate study currently in the publication process. The findings are also congruent with past research on the impact of peer tutoring on mathematics attitudes (Topping, et al 2003; Tymms, et al, 2011) and social attitudes (Ginzburg-Block, et al, 2006) or the impact of peer tutoring on the locus of control/perception of choice of how mathematics is conducted in the classroom (Winter, 1988).
Another element to consider is that the findings could have been biased by the Hawthorne effect (Slavin & Madden, 2008), specifically the students simply perceiving benefits due to the fact that they undertook an intervention as opposed to the workings of the intervention itself. A common phenomenon with short trials.
What explains the insignificant findings for most variables? The first issue to consider when discussing this
question is that the intervention was too short, and therefore it is possible that a longer time frame was required to make any change to the students’ attitude.
Secondly, although not reported here, the implementation analysis of the classroom observation, pair observation and ICAT lesson material observation, showed that schools B and C did not fully incorporate some of the main elements of the ICAT framework, specifically students setting goals. Consequently there was not enough goal interdependence to keep students engaged in their learning activities.
What explains the findings that the tutor gained more than the tutee? The findings that the tutors usually gain more from peer tutoring than the tutees in mathematics are consistent with previous research (Tymms, et al, 2011). This is probably due to the fact that in a peer tutoring situation the tutors seem to slightly dominate the interactions (Hausmann, Chi & Roy 2004). This is especially the case when cooperative elements have not been properly implemented at the pair and classroom level.
Limitations. In terms of limitations it is necessary to point out that the findings from this research cannot
be generalizable for a variety of reasons: First the sample in this study was neither randomly selected nor randomly allocated, therefore generating great internal and external validity issues. Also, as already mentioned, the study was very short and therefore the influence of the Hawthorne effect is unknown.
How can ICAT be better tested? A clustered (at the school level) randomly allocated controlled trial across
two years, with a large sample size of schools also being randomly selected from the population, would be the way forward to assess the impact of ICAT on attitude variables. The length of two years would counter Hawthorne effect concerns (Clark & Sugrue, 1991), and randomisation would ensure group equalisation in unknown characteristics (Holland, 1986).
Future research would also benefit from developing a model to explain how attitude variable improvements deriving from ICAT link to or predict academic performance. Such investigation would shed more light on how peer tutoring works, and be used to persuade teachers, academics and policymakers.
How can ICAT be improved? Another way to improve cross age peer tutoring is to add to the existing ICAT
structure the choice of reward interdependence; so that students can have a choice whether they would like a reward or not, and if so what reward they would like. The reward can vary from acknowledgment in the form of applause in front of the classroom, a certificate or other examples that can be covered by the individual school’s resources, as is the case with reciprocal-same age peer tutoring interventions.
Also, ICAT can be applied to different contexts, such as science education, since the framework is extremely flexible. For example, in the second stage of ICAT the teachers can have a set of science concepts ranging in the level of difficulty and the students have to solve them or develop definitions, and in the third stage, connect section, the students can link the concepts to previous science knowledge or apply the concepts to real life situations.
As illustrated in this study, when implemented correctly, as in school A, ICAT can have a positive impact on broader social-psychological process of learning elements such as academic attitude, locus of control and social self-concept. Therefore we highly recommend ICAT to teachers who need to improve students’ psychological aspects of learning as well as social se
This is an ESRC funded research, DTC grant number: ES/I007296/1
References:
Allan, R. (2008). MathsLinks 1; Year 7. Oxford, Oxford University Press.
Bar-Eli, Nurit and Raviv, Amiram. (1982). Underachievers as tutors. The Journal of Educational Research, Vol. 75(3), pp. 139-143.
Barron. A-M., & Foot. H. (1991). Peer tutoring and tutor training. Educational Research, 33(3), 174-185.
Clark, R. E. & Sugrue, B. M. (1991). Research on instructional media, 1978-1988, in Anglin, G. J. (ed.) Instructional
technology: past, present, and future. Englewood, Colorado: Libraries unlimited.
Cohen, P.A., Kulik, J.A., & Kulik, C-L.C. (1982). Educational outcomes of tutoring: A meta-analysis of findings.
American Educational Research Journal, 19, 237–48.
Delquadri, J.C., Greenwood, C. R., Stretton, K., & Hall, R.V. (1983). The peer tutoring spelling game: A classroom procedure for increasing opportunity to respond and spelling performance. Education and Treatment of Children, 6, 225-239.
Fantuzzo, J.W., King, J.A., & Heller, L.R. (1992). Effects of reciprocal peer tutoring on mathematics and school adjustment: A component analysis. Journal of Educational Psychology, 84 (3), 331-339.
Fitz-Gibbon, C.T. (1990). Success and failure in peer tutoring experiments. In Goodland, S., & Hirst, B., (Eds.).
Explorations in Peer Tutoring (pp. 26-57), Oxford: Basil Blackwell.
Fuchs, S.L., Fuchs, D., Karns, K., Hamlett, C.L., Katzaroff, M., & Dutka, S. (1998). Comparisons among individual and cooperative performance assessments and other measures of mathematics competence. The Elementary School Journal, 99(1), 23-51.
Fuchs, S.L., Fuchs, D., Kazdan, S., & Allen, S. (1999). Effects of peer-assisted learning strategies in reading with and without training in elaborated help giving. The Elementary School Journal, 99 (3), 201-219.
Ginsburg-Block, M. D., & Fantuzzo, J.W. (1998). An evaluation of the relative effectiveness of NCTM standards-based Interventions for low-achieving urban elementary students. Journal of Educational Psychology, 90 (3), 560-569.
Ginsburg-Block, M., Rohrbeck, B., Cynthia, A., Fantuzzo, J. W. (2006). A meta-Analytic review of social, self-concept, and behavioral outcomes of peer-assisted learning. Journal of Educational Psychology. 98(4), Nov 732-749.
Gisbert , D.D. & Font, C.M. (2008). The impact of peer tutoring on the improvement of linguistic competence self-concept as a writer and pedagogical satisfaction. School of Psychology International, 29 (4), 481-499.
Harrison, G. Von & Cohen, A. M. (1971). Empirical Validation of Tutor-Training Procedures. Annual Meeting of the
California Education Association, San Diego, California, April 1971. Retrieved November, 10, 2012, from:
http://www.eric.ed.gov/ERICWebPortal/search/detailmini.jsp?_nfpb=true&_&ERICExtSearch_SearchValue_0=ED0 58283&ERICExtSearch_SearchType_0=no&accno=ED058283.
Harter, S. (1985). Competence as a dimension of self-evaluation: Toward a comprehensive model of self-worth. In R. Leahy (Ed.), The development of the self. NY: Academic Press.
Hausmann, R.G.M., Chi, M. T. H., & Roy, M. (2004). Learning from collaborative problem solving: An analysis of three dialogue patterns. In the Twenty-sixth Cognitive Science Proceedings.
Holland, P. W. (1986). ‘Statistics and Causal Inference’. Journal of the American Statistical Association, 81 (396), 945-960.
Howell, David, C. (2010). Statistical Methods for Psychology. Wadsworth: Belmont.Johnson, D.W., & Johnson, R.T. (1987). Learning together & alone: Cooperative, competitive & individualistic learning. New Jersey: Prentice-Hall, Inc.
Johnson, D.W., & Johnson R, T. (1989). Cooperation and Competition: Theory and Research. Edina, MN: Interaction Book Company.
Leung, K. C., Marsh, H. W., Craven, R. G., Yeung, A. S., & Abduljabbar, A. S. (2013). Domain specificity between peer support and self-concept. Journal of Early Adolescence, 33(2), 227-244.
Marsh, H. W. (1990). The structure of academic self-concept: The Marsh/Shavelson model. Journal of Educational
Psychology, 82, 623-636.
Marsh, H. W., & O’Mara, A. (2008). Reciprocal effects between Academic Self-concept, Self-esteem, Achievement and Attainment over seven adolescent years: Unidimensional and Multidimensional perspectives of Self-concept. Personality
and Social Psychology Bulletin, 34, 542-552.
Mevarech, Z., & Kramarski, B. (1997). IMPROVE: A multidimensional method forteaching mathematics in heterogeneous classrooms. American Educational Research Journal, 34, 365-394.
Miller, D., Topping, K., & Thurston, A. (2010). Peer tutoring in reading: The effects of role and organization on two dimensions of self-esteem. British Journal of Educational Psychology, 80(3), 417–433.
Roseth, C. J., Johnson, D.W., & Johnson, R.T. (2008). Promoting early adolescents, achievement and peer relationships: The effects of cooperative, competitive, and individualistic goal structures. Psychology Bulletin, 134 (2), 223-246.
Ryan, R., & Deci, E. (2012). Intrinsic Motivation Scale. Retrieved from Self Determination Theory Website, visited on the 12-11-2012 at: http://selfdeterminationtheory.org/questionnaires/10-questionnaires/50#getScale.
Sarbin, T. R. (1976). Cross-Age Tutoring and Social Identity. In Allen, V. L. (Ed.) Students as Teachers: Theory and
Research on Tutoring (pp. 27-40). Academic Press, London: INC.
Sporer, N., & Brunstein, J.C. (2009). Fostering the reading comprehension of secondary school students through peer-assisted learning: Effects on strategy knowledge, strategy use, and task performance. Contemporary Educational Journal, 34
(4), 289-297.
Slavin, R. E., & Madden. N. A. (2008). Understanding bias due to measures inherent to treatments in systematic
reviews in Education. Retrieved March 20th,2015 from:
http://www.bestevidence.org/methods/understand_bias_Mar_2008.pdf.
Thurston, A. (2014). Manual to help develop peer tutoring in the school classroom. Retrieved January 15th, 2015 from:
http://pure.qub.ac.uk/portal/files/12775117/LT_Mathematics_PackVQUB.pdf.
Thurston, A., Duran, D., Cuningham, E., Blanch, S., & Topping, K. (2009). International online reciprocal peer tutoring to promote modern language development in primary schools. Computers & Education, 53 (2), 462–472.
Topping, K.J., & Ehly, S. (1998). Introduction to peer learning. In Topping, K.J., & Ehly(Eds.). Peer Assisted Learning. London UK: Lawrence Erlbaum.
Topping, K. J., Campbell, J., Douglas, W. & Smith, A. J. (2003). Cross-age peer tutoring in mathematics with 7 & 11 year olds: Influence on mathematical vocabulary, strategic dialogue and self-concept. Educational Research, 45, 287-308.
Tymms, P., Merrell, C., Thurston, A., Andor, J., Topping, K. & Miller, D. (2011). Improving attainment across a whole district: School reform through peer tutoring, a randomized controlled trial. School Effectiveness and School Improvement, 22, 265-289.
Tymms, P. B. & Merrell, C. (2015). Cross-age Peer Learning. Better Evidence-based Education, 7(1), 18-19.
Trochim, W. (2012), Design, the research method knowledge base. Retrieved January, 14th, 2012 from:
http://www.socialresearchmethods.net/kb/design.php.
Winter, Sam. (1988). Paired Reading: a study of process and outcome. Educational Psychology, 8(3), 135-151. DOI: 10.1080/0144341880080301
Webb, N. M. (1991). Task-related verbal interaction and mathematics learning in small groups, Journal for Research in
Mathematics Education. 22 (5), 366–89.
Yarrow, F., Topping, K. (2001). Collaborative writing: The effects of metacognitive prompting and structured peer interaction. British Journal of Educational Psychology, 71(2), 261-282.
Zeneli, M (2015). Developing, Testing and Interpreting a Cross Age Peer Tutoring Intervention for Mathematics: Social Interdependence, Systematic Reviews and an Empirical Study. Doctoral thesis, Durham University. Retrieved January, 10th, 2016 from http://etheses.dur.ac.uk/11367/.
Zeneli, M., Thurston. A., and Roseth, C. (2016). The influence of experimental design on the magnitude of the effect size -peer tutoring for elementary, middle and high school settings: A meta-analysis. International Journal of Educational
Research. In press.