www.nat-hazards-earth-syst-sci.net/9/1277/2009/ © Author(s) 2009. This work is distributed under the Creative Commons Attribution 3.0 License.
and Earth
System Sciences
Coupled modelling of subsurface water flux for an integrated flood
risk management
T. Sommer1, C. Karpf2, N. Ettrich3, D. Haase4, T. Weichel4,*, J.-V. Peetz5, B. Steckel5, K. Eulitz1,**, and K. Ullrich6
1Dresden Groundwater Research Centre, Meraner Straße 10, 01187 Dresden, Germany 2TU Dresden, Institute for Urban Water Management, 01062 Dresden, Germany
3Fraunhofer Institut f¨ur Techno- und Wirtschaftsmathematik (ITWM), Fraunhoferplatz, 67663 Kaiserslautern, Germany 4Helmholtz Centre for Environmental Research – UFZ, Permoserstraße 15, 04318 Leipzig, Germany
5Fraunhofer Institute for Algorithms and Scientific Computing (SCAI), Schloss Birlinghoven, 53754 Sankt Augustin, Germany
6Environmental Office of Capital Dresden, Grunaer Straße 2, 01069 Dresden, Germay *now at: Landesbetrieb f¨ur Hochwasserschutz und Wasserwirtschaft, Magdeburg, Germany **now at: Ingenieurb¨uro f¨ur Grundwasser, Leipzig, Germany
Received: 27 February 2009 – Accepted: 27 May 2009 – Published: 29 July 2009
Abstract. Flood events cause significant damage not only
on the surface but also underground. Infiltration of surface water into soil, flooding through the urban sewer system and, in consequence, rising groundwater are the main causes of subsurface damage. The modelling of flooding events is an important part of flood risk assessment. The processes of subsurface discharge of infiltrated water necessitate cou-pled modelling tools of both, surface and subsurface water fluxes. Therefore, codes for surface flooding, for discharge in the sewerage system and for groundwater flow were coupled with each other. A coupling software was used to amalga-mate the individual programs in terms of mapping between the different model geometries, time synchronization and data exchange. The coupling of the models was realized on
twoscales in the Saxon capital of Dresden (Germany). As a result of the coupled modelling it could be shown that surface flooding dominates processes of any flood event. Compared to flood simulations without coupled modelling no substan-tial changes of the surface inundation area could be deter-mined. Regarding sewerage, the comparison between the flux of groundwater into sewerage and the loading due to in-filtration by flood water showed inin-filtration of surface flood water to be the main reason for sewerage overloading. Con-current rainfalls can intensify the problem. The infiltration of the sewerage system by rising groundwater contributes only marginally to the loading of the sewerage and the distribu-tion of water by sewerage has only local impacts on
ground-Correspondence to:T. Sommer
water rise. However, the localization of risk areas due to rising groundwater requires the consideration of all compo-nents of the subsurface water fluxes. The coupled modelling has shown that high groundwater levels are the result of a multi-causal process that occurs before and during the flood event.
1 Introduction
2004), recontamination of soils and sediments by polluted groundwater, remobilization of pollutants and the endanger-ing of drinkendanger-ing water (Marre et al., 2005).
The impact of both surface flooding and discharge in the sewerage system on the groundwater were studied in Dres-den after the flood of August 2002. These investigations focussed on the impact of surface flooding and the flooded sewer network on groundwater dynamics and groundwater quality. It was shown, that the processes of the water dy-namics were the most important factor of the flooding on the groundwater (LH DD, 2005).
Thus, more detailed knowledge of the interaction of all three zones of the urban water system, the surface flood-ing, the sewer network and the groundwater was necessary. The modelling of flooding events is an important part of risk assessment (e.g. Oberle et al., 2000; Nieschulz et al., 2001; Oberle, 2004; B¨uchele et al., 2006). Whereas individ-ual solutions for one or at most two coupled processes exist (Gustafsson et al., 1997; Yang et al., 1999; Nieschulz et al., 2001; Lerner, 2002; Hsu et al., 2002), there is still a lack of modelling more complex systems integrating the three flow regimes.
Whereas many cities situated alongside rivers have models simulating surface flooding and discharge in the sewerage system only few cities also have groundwater models. So the aim of this project is to connect the existing models using a coupling software.
The forecasting of groundwater flood events with regard to the maximum groundwater level and the development of the groundwater table is not congruent with the forecasting of riverine surface flood propagation. Multiple factors affect-ing groundwater dynamics such as the pre-event groundwa-ter level, the pre-event soil moisture, groundwagroundwa-ter recharge and characteristics of the flood event itself, as well as the re-sponse of tributary streams, determine the groundwater dy-namics during and after flood events. Therefore, the pre-diction of groundwater has to be based on scenarios which include the various boundary conditions.
This paper concentrates on the main water fluxes and in-teractions between surface flooding, sewerage and ground-water by applying a coupled modelling system. The cou-pling method and it’s application to the case study of the Ger-man city of Dresden, which was strongly affected by floods in August 2002 and spring 2006 (Engel, 2004; Belz et al., 2006), are described. The evaluation of the modelling results leads to general conclusions for flood control strategies that include groundwater.
2 Subsurface water fluxes and their effects
during a flood
The first step in coupling models is to identify the coupling parameters. Therefore, it is necessary to identify relevant water fluxes between surface flooding and subsurface water.
The influence of surface water on groundwater is observable in data from groundwater measuring wells. Figure 1 shows two types of groundwater hydrographs in Dresden during the August 2002 flood. Depending on the distance to the re-ceiving stream the groundwater rises either fast or slowly. Close to the receiving stream the groundwater dynamics cor-respond with the dynamics of the flood, the dominating effect being a direct water flux from the surface flood into ground-water. Further away from the flooded river and the flooding areas the groundwater rises slowly but the groundwater table can remain on a high level for a considerable amount of time. The analysis of rising groundwater levels helps with the development of maps depicting maximum groundwater lev-els and minimum depth to groundwater table. These maps provide a first overview of areas outside the flooded area where there is a risk of groundwater influence on subsurface building structures and infrastructure in general.
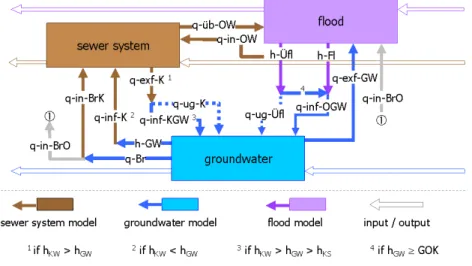
Interaction between the various subsurface water fluxes means either infiltration into the sewerage network due to risen groundwater or a rise in exfiltration of sewage water into the aquifer or unsaturated zone due to increased water levels in the sewerage system. Altogether, the coupled mod-elling has to consider a number of water fluxes between sur-face flood and subsursur-face water (Fig. 2).
Infiltration of groundwater and inflow of drainage and sur-face water sources into the sewerage systems form a basic component of the flow in sewerage system. These inflows in-fluence significantly the costs and the operation of drainage systems and waste water treatment plants. It is necessary to distinguish between short and long term impacts.
Short term effects of the overloading of the sewerage sys-tems are the flooding of the surface area as well as backwater effects, which in turn can endanger the urban infrastructure and eventually lead to the break down of system structures (pumping stations, pipes). On the one hand, the capacity overload during floods is a result of the increased inflows due to infiltration in leaky sewers and the inflow of surface water via openings of the system (man holes, out- and inlets). On the other hand ways of discharge and overflow of sewage water during flood events are reduced and in effect shortened due to increased water levels in the receiving stream. Even-tually discharges and overflows are attainable only by means of using pumping stations. Furthermore rain events concur-rent with floods can cause an accentuation of the capacity overload.
0 1 .0 8 .0 2 0 1 .0 9 .0 2 0 1 .1 0 .0 2 0 1 .1 1 .0 2 0 1 .1 2 .0 2 0 1 .0 1 .0 3 0 1 .0 2 .0 3 0 1 .0 3 .0 3 Calender date
Groundwater (M. P. 3516) Elbe River 0 1 .0 8 .0 2 0 1 .0 9 .0 2 0 1 .1 0 .0 2 0 1 .1 1 .0 2 0 1 .1 2 .0 2 0 1 .0 1 .0 3 0 1 .0 2 .0 3 0 1 .0 3 .0 3 Calender date W a te r le v e l (m H N )
Groundwater (M.P. 3538) Elbe River 103.00 104.00 105.00 106.00 107.00 108.00 109.00 110.00 111.00 112.00 113.00
Fig. 1. Hydrographs of groundwater and of the Elbe River in Dresden from summer 2002 to spring 2003. Left: measuring point<100 m from flood area; right: measuring point approx. 1 km from flood area. Data source: Environmental Office of Capital Dresden and Saxon Regional Agency of Environment and Geology.
Fig. 2.Relevant water fluxes as coupling quantities.
3 Coupling of models
The strategy of this project is to use established simulation programs for each of the three domains (surface water, sewer and groundwater). These programs are widely recognized for their particular area of application. They are coupled with each other by the MpCCI software (http://www.mpcci.de). MpCCI manages the communication between the individual programs, i.e., mapping between the different model geome-tries, time synchronization and data exchange.
Depending on the task, two different codes were used for each of the surface flooding (RisoSurf: Ettrich, 2003, TrimR2D: Fulford, 2003) and the sewerage systems (HAMOKA: Universtiy of Kaiserslautern, Hystem-Extran: Fuchs et al., 2004). Because the groundwater code (PCGE-OFIM: Sames et al., 2005) is able to calculate selected re-gions with a finer spatial resolution, it can be used for large scale simulations, coupling TrimR2D and Hystem-Extran. For small scale simulations, Risosurf and Hamoka were cou-pled.
Due to its flexible grid structure, RisoSurf is especially suited for small scale simulations and was used in local study areas. Since the sewer model HAMOKA and the RisoSurf system had already been coupled (Ettrich, 2003), HAMOKA was also chosen for modeling in the local scale.
RisoSurf and TrimR2D are based on the 2-dimensional Shallow Water Equations. Adaptive Triangles (RisoSurf) and a Cartesian grid (TrimR2D) are used for the discreti-sation in space. Hamoka and Hystem Extran use the 1-dimensional Shallow Water Equations. PCGEOFIM simu-lates the groundwater flow described by Darcy’s Law; the grid consists of 3-dimensional Cartesian cubic volumes with different mesh sizes.
3.1 Software
3.1.1 The hydrodynamic model TrimR2D
this study. It solves the two-dimensional depth-averaged shallow water equations for unsteady flow, which is based on the conservation of mass and momentum. The numerical solution uses a semi-implicit, semi-Lagrangian finite differ-ence approach and applies a Manning-Chezy type expression for the bed friction factor in bottom-stress term. A complete description of the equations used is detailed in Casulli (1990) and Fulford (2003).
The code of TrimR2D is a further development of a model, which was originally developed for coastal and estuarine en-vironments (Casulli, 1990; Cheng et al., 1993). The per-formance of the model is documented for the uniform depth flows, laboratory dam-break flows and large-scale riverine flows (Fulford, 2003). The US Geological Survey uses the model for near-real-time flood forecasting (USGS).
The advantage of this model is the free access to the source code which allows a flexible integration/modification of fur-ther parameters. As the roughness parameter was not spa-tially differentiated in the original source code, Weichel et al. (2007) upgraded the model to include this functionality. Corresponding with the spatial resolution of the topographic input on a grid, the distributed roughness was also integrated in the code. The roughness term in the code was expanded by adding an array dimension for the distributed values for roughness into the appropriate variable. Two different types of roughness are applied (Table 1), with type 1 being the best parameter set after Werner et al. (2005) and type 2 being an aggregated spatial distributed set based on the Saxon biotope map. The spatial resolution was set to a cell size of 20 m. Figure 3 shows the calibration of the model for the flood 2002 (Weichel et al., 2007).
3.1.2 The sewerage model HYSTEM EXTRAN
The sewer network software HYSTEM-EXTRAN (Fuchs et al., 2004) consists of two modules which are coupled in se-ries. The module HYSTEM is used to calculate the rainwa-ter inflow into the sewer system based on several selected precipitation-runoff approaches. With the module EXTRAN the hydrodynamic transport processes in the sewer system are simulated. The basis of the sewer hydraulics is the Saint Venant (1871) equation consisting of the equation of motion and the continuity equation.
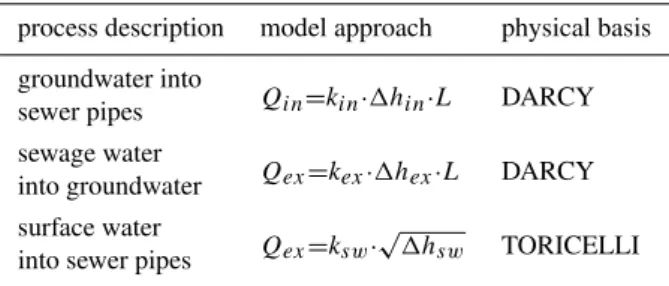
HYSTEM EXTRAN was extended with a wrapper soft-ware in order to integrate the interface for the connection of groundwater and surface water models via the coupling soft-ware MpCCI. Furthermore the wrapper code includes model approaches to calculate the exchange fluxes between sewer system, groundwater and surface water (Table 2).
The main force of the fluxes between the different domains is the hydraulic potential (1hin,1hex,1hsw). Further
co-efficients (kin, kex,ksw) describe specific conditions of the
particular process. The infiltration coefficient (kin) integrates
shape and area of sewer leaks, hydraulic conditions near the leaks (pressure loss) and soil characteristics in the vicinity of
Table 1. Values of Mannings roughness (m1/3s−1) in the model calibration.
Type 1 Type 2
Channel 0.022 0.025
Floodplain
0.015 (pavement)
0.033 (grassland, arable land) 0.044 0.040 (fouling)
0.050 (fouling)
0.066 (forests, buildings)
the leaks (e.g. conductivity of the soil). The exfiltration coef-ficient (kex) describes similar characteristics but is different
from the infiltration coefficient due to the influence of the sewage water causing clogging of the soil in the vicinity of the sewer leaks. The surface water coefficient (ksw) includes
the characteristics of the inflow points, e.g. shape and area of openings.
3.1.3 The modelling system RisoSim
High-resolution models form the basis of the detailed inves-tigations into target areas of Dresden that were identified as regions suffering from particular flooding problems on the surface. The degree of detail needed in the models has to be related to the water levels and the expected water level uncertainties. Therefore, the effect of rainfall on the surface must be modelled taking into account small elements such as curbs and walls.
For that purpose, the RisoDGM software generates tri-angulated digital elevation models for multi-connected ar-eas under the constraint that polygonal lines, e.g. represent-ing curbs, are preserved (Ettrich and Sieh, 2005; Ettrich, 2007). Elevations from densely sampled high-precision laser-scanner data are mapped into triangles after triangula-tion involving a fault-line preserving smoothing process for reducing measurement errors. Owing to additional features like elliptically shaped smoothing operators for stronger smoothing along a preferred direction, the detection of out-liers, the topographical filling of artificial small-scale syn-clines, the models generated are very close to reality.
Simulations are carried out by the RisoSim software (Et-trich, 2003) that involves tools for simulating runoff, flow through the sewer and input from roofs into the sewer. Cal-culations for the first two regimes are based on approxima-tions of the shallow water equaapproxima-tions whereas the latter uti-lizes standard storage cascade technology.
Fig. 3. Model calibration at the Dresden gauge with two different sets of roughness values (Table 1). Differences are calculated be-tween the observed data and simulated results.
which are time-dependent, can be provided for the upstream and downstream boundary manholes, respectively. Further boundary conditions come from the level of the groundwater that may lead to in-/exfiltration to/from the sewer system and also to/from the surface. While the coupling of surface water with sewer is fully dynamic, the coupling with groundwa-ter is viewed as stationary due to the slow groundwagroundwa-ter flow processes.
3.1.4 The groundwater model PCGEOFIM
The modelling of the unsteady groundwater flow was done with the modelling software PCGEOFIM (Sames et al., 2005). This modelling software calculates the groundwa-ter flow in the saturated zone and the migration of pollu-tants in groundwater (M¨uller et al., 2003). The simulation code calculates the groundwater filtration by the finite vol-ume method. Since the finite volvol-ume may be calculated in x-direction or only in x, y-direction or only in x, z-direction or in x, y, z-direction, the modelling of groundwater filtration in the aquifer can be done 1-dimensionally, horizontal-flat 2-dimensionally or 3-2-dimensionally (Sames et al., 2005). The model works with a regular Cartesian grid. Many special boundary conditions, such as connections between aquifer and rivers, lakes and pipelines with control mechanisms can be used to provide a high level of likeness of the real system (M¨uller et al., 2008). There are various ways to specify the groundwater recharge, i.e. keeping it constant over time or associating it with the depth to groundwater table (M¨uller et al., 2008). A special dynamic boundary condition was devel-oped for the illustration of the effect of flooding. This allows the assimilation of the inflow of surface water through the unsaturated zone onto the groundwater table. As soon as the groundwater table reaches the terrain surface, the exchange with the surface is calculated as a Cauchy boundary condi-tion. The adjustment of the groundwater model to allow cou-pling with flood events requires careful pre-processing, par-ticularly regarding the formation of the top layer, which is the
Table 2. Approaches to simulation of the water exchange between groundwater, surface water and sewerage system.
process description model approach physical basis
groundwater into
Qin=kin·1hin·L DARCY sewer pipes
sewage water
Qex=kex·1hex·L DARCY into groundwater
surface water
Qex=ksw·√1hsw TORICELLI into sewer pipes
relevant model layer for the infiltration processes. Therefore, this layer included both the introduction of the seepage area units per model element and the mapping of the unsaturated zone by a simplified conceptual approach. Furthermore, the high velocities of the runoff processes on the surface and in the sewerage network require a high temporal resolution and very small simulation time steps. This was also necessary for the groundwater flow simulation.
3.2 Spatial coupling
Figure 2 shows the interaction between the three different simulation domains relevant to the coupling. Each of them works with its own boundary conditions and will send one quantity to each of the other components and in turn, receive one quantity from each of the other components back.
In order to establish communication in the coupled compu-tation, the geometrical part of the simulation model on each side and the quantities to be exchanged have to be specified for each of the bilateral exchanges. For example, for the cou-pling between the surface water code and the groundwater code the geometrical part of the model result from the poten-tially flooded elements (triangles or rectangles) of the surface water model and the top side of the cells nearest to the sur-face of the groundwater model.
The quantity sent by the surface water code is the water level above ground measured in meters in the center of the cell. The quantity sent in return by the groundwater code is the water velocity (or water flux per area) measured in meters per second. The same procedure is applied to each of the other two combinations: surface code and sewerage program as well as groundwater code and sewerage simulation.
3.3 Time-step coupling
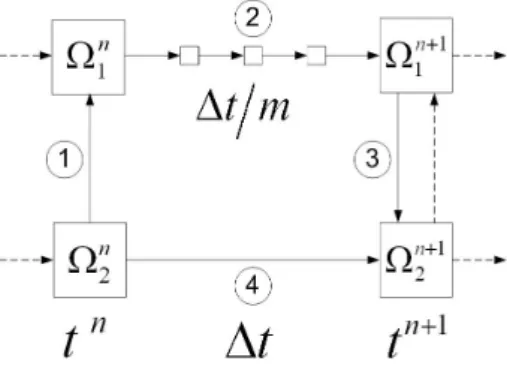
Fig. 4.Exemplary Computation Flow for 3-Code Coupling.
timetn quantities for the surface water and for the sewer-age system (n1) as well as for the groundwater (n2) on their respective domains are already calculated.
Then the figure has to be interpreted in the following way. 1. At time tn the groundwater code stipulates the time
tn+1(timestep1t
=tn+1
−tn) and transfers its coupling quantities to the surface water code and to the sewerage code.
2. The surface water code and the sewerage code calculate up totn+1with some intermediate coupling (indicated by, time step1t /m, dependent on the time-step stip-ulated by the groundwater code).
3. The surface water code and the sewerage code trans-fer their coupling quantities attn+1to the groundwater code.
4. The groundwater code calculates the time step fromtn totn+1.
In this algorithm the codes for the surface runoff and the sewerage system with their faster dynamics couple more fre-quently with each other before they both couple with the groundwater code.
3.4 Coupling software
MpCCI (Mesh-based parallel Code Coupling Interface) pro-vides an application independent interface for the coupling of different simulation codes. MpCCI is a software envi-ronment which enables the exchange of data between the meshes of two or more simulation codes in the coupling re-gion. Since meshes belonging to different simulation codes are not compatible in general, MpCCI performs a suitable interpolation.
For this application a driver for MpCCI was developed, that provides a simple interface consisting of a software li-brary for codes that are to be coupled. However, each code has to be extended for the coupling. The extension is realized by means of a loop around the underlying simulation code.
Inside this loop, in addition, the coupling time steps are ne-gotiated and the coupling quantities are exchanged. Further-more, an API needs to be added to each code in order to access the code’s internal data. For more details about the implementation of the coupling see Peetz et al. (2007).
4 The case study of the city of Dresden
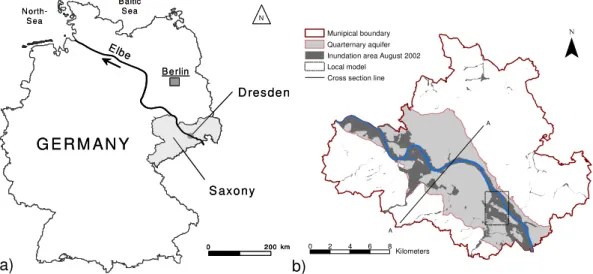
Dresden, capital of the Free State of Saxony (Germany) is situated in the Elbe valley. It serves as the study area for the flood modelling and model coupling (Fig. 5). The Holocene river valley is tectonic of origin (“Elbe basin”) and cov-ers a width of 10 km. In the Elbe valley Cretaceous sedi-ments (sandstone, limestone) are the footwall of the Quater-nary aquifer. The main sediments of this aquifer are gravel and sand of the glacio-fluviatile series of Elsterian (Mindel), Saalian (Riss) and Weichselian (W¨urm) with a less than 10 m to 60 m thickness from south to north.
The lowest layers are fluviatile and glacio-fluviatile gravel with a thickness of about 15 m. The permeability of this layer is about 1·10−3m s−1. Sand and fine gravel with a thick-ness less than about 10 m and permeability between 2·10−4 and 1·10−5m s−1lay below. The upper sediments consisting of sand and fine gravel form the low-terrace with a thick-ness of about 12 m. Aquicludes between the glacio-fluviatile sand and gravel mostly consist of silt with fine sand, with a thickness of up to 2 m. The aquifer can be seen as a uniform sediment complex since the aquicludes are not widespread over the whole area of quaternary aquifer. Silt of Pleistocene low-terrace and Holocene alluvial clay with a thickness of 1– 4 m represent the upper end of the Quaternary profile. These sediments are not widespread over the aquifer either. The existence of alluvial clay and silt of the lower terrace have an important effect on the infiltration of flood water into the aquifer. Figure 5 shows the general geological situation of the quaternary aquifer in the Elbe valley of Dresden (LH DD, 2005; LfULG, 2005).
The depth to the groundwater table is an important pa-rameter for subsurface flood risk assessment in urban areas. Normally in Dresden the depth to the groundwater table is between 3 und 8 m. During the August 2002 flood event the depth to the groundwater table decreased from 4 to 0 m.
G E R M A N Y
D resde n
S axon y
B e rlin Elbe
N
0 2 00 km
N orth-S ea
B altic S ea
G E R M A N Y
D resde n
S axon y
B e rlin Elbe
N
0 2 00 km
0 2 00 km
N orth-S ea
B altic S ea
a)
A
A Munipical boundary
Quarternary aquifer Inundation area August 2002 Local model
Cross section line
0 2 4 6 8
Kilometers
b)
Fig. 5.Map of Germany with study area(a)and map of Dresden(b)with line of geological cross section (Fig. 6). The quaternary aquifer is the area of the groundwater model and the coupled entire model. Data source: Environmental Office, City of Dresden.
−
Fig. 6.Schematic geological cross section through Elbe river valley (after LH DD, 2007).
The coupling of the models was realized on two scales. The full model extends over the entire area of the quaternary aquifer. In this scale the models of TrimR2D (surface wa-ter flood), HYSTEM-EXTRAN (sewerage) and PCGEOFIM (groundwater) were coupled. For detailed conclusions, espe-cially concerning the interaction between surface water flood and sewerage the models of RisoSim (surface water flow and sewerage) und PCGEOFIM (groundwater) were coupled in a local model in the south eastern part of Dresden (Fig. 5).
Coupled modelling in the study area of Dresden was ap-plied to three scenarios, which reflect extreme flood situa-tions. As a test and calibration scenario the August 2002 flood event was used. This flood has the typical summer flood characteristic with a relatively narrow peak, triggered by a short time rainfall event. The maximum water level at
the Dresden gauge was 9.40 m. A second scenario was a 100-year-flood (HQ 100) with a maximum water level of 9.24 m at Dresden gauge and with similar runoff characteristics to the August 2002 flood. This scenario was modified with two variations, simulating flood protection as well as and no flood protection. In order to describe the effects on the sewerage system, the 100-year-flood-scenario was combined with a lo-cal 1-year-rain event with a duration of 12 h.
5 Results and discussion
Legend:
Fig. 7.Simulation of the flood 2002 using TrimR2D.
There is good agreement between the simulation results and the observed flood data (Fig. 8).
However, major uncertainties in surface flood modelling are to be found in the parameters of the model. In particu-lar, resulting inundation areas depend on the quality of input data such as land cover or surface roughness (Weichel et al., 2007).
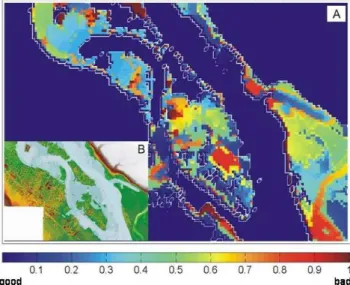
In order to determine the optimum parameter set for mod-elling, a Monte-Carlo (MC) based sensitivity and uncertainty analysis was conducted. This is a type of sensitivity analy-sis (Saltelli et al., 2000) which performs multiple simulations with randomly selected model inputs for defined parameters. The comparison is based on a reduction of the observed and simulated data to spatially distributed discrete binary patterns with similar extent and cell size. The correctly or incor-rectly classified dry and wet areas are then identified by a contingency table (Aronica et al., 2002; Hunter, 2005; Pap-penberger et al., 2007; Fig. 8).
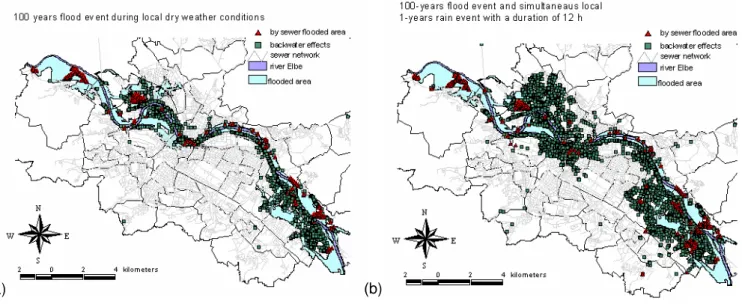
Concerning the sewerage system, the flooding areas and backwater-influenced areas of a 100-year-flood event are il-lustrated in Fig. 9. The scenarios describe the situation in the catchment area without any safety measures against surface flooding. One simulation shows the situation with a simul-taneous rain event (duration: 12 h, frequency 1a−1, constant intensity).
It appears that under dry weather conditions the backwa-ter effects and the flooding via manholes cause no broaden-ing of the flood. The area flooded by surface water from the river is approximately congruent to the area where an over-load of the sewerage system can be expected. By contrast a simultaneous rain event during the flood can endanger ar-eas which are normally not affected by the river flood. As pointed out above the backwater effects and the flooding of back areas are caused by an array of conditions: less overflow and discharge capacity, simultaneous rain events, surface
wa-Fig. 8a.Comparison of the simulation results using TrimR2D and the observed extent of the flood in 2002. Dark blue: simulation TrimR2D; light blue: observed flooding area at 17 August 2002 (Weichel et al., 2007).
Fig. 8b.The error plot (A) represents a spatial classification of the simulation quality with a diminishing performance from 0 to 1. The reference map (B) is an overview of the domain (DEM) with the observed inundation area (light blue).
ter inflows and groundwater infiltration. The quantity of sur-face water inflow is increased compared to the quantity of infiltration (Fig. 10).
(a) (b)
Fig. 9.Backwater effects and flooded areas during a 100-year flood event in Dresden (scenario without any safety measures on the surface) (a): without additional rain event;(b): with additional rain event.
0.0 1.0 2.0 3.0 4.0
1 25 49 73 97 121 145 169 193 217
time (h)
in
fi
lt
ra
ti
o
n
(m
³s
-1)
with precipitation dry weather -2.0
-1.0 0.0
e
x
fi
lt
ra
ti
o
n
(m
³s
-1)
0.0 10.0 20.0
in
fl
o
w
s
u
rf
a
c
e
w
a
te
r
(m
³s
-1)
0 500 1000
w
a
te
r
le
v
e
l
ri
v
e
r
(c
m
)
0 20 40
p
re
c
ip
it
a
ti
o
n
ru
n
o
ff
(
m
³s
-1) water level river
precipitation runoff
Fig. 10.Dynamics of the cumulated exchange rates during a 100-year flood event (scenario without any safety measures on the surface).
of rainfall-runoff. Contrary to the temporary decrease of in-filtration, exfiltration increases due to rising water levels in the sewerage system.
The coupled modelling also allows a comprehensive de-scription of the impact of floods on the groundwater. The fo-cus of the groundwater modelling is on the description of the rising groundwater and maximum groundwater levels. Maps of minimum depth to groundwater table after a flood and maximum groundwater rise1are important results aiding risk management of the subsurface water dynamics.
1“maximum groundwater rise” means the difference between depth of the groundwater table at the beginning of the flood and minimum depth of the groundwater table during the flood event
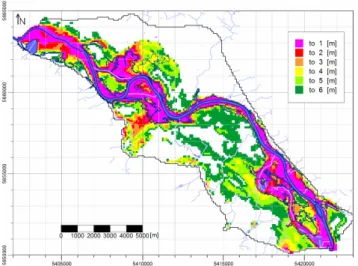
Figure 11 shows a map of the minimum depth to the groundwater table along the river Elbe for the 100-year sce-nario without flood protection. The flood-influenced area in the aquifer with groundwater depth less than 3 m makes up around 110% of the inundation area. In the 100-year scenario without pre-event precipitation and flood protection the flood impact on the groundwater (=rise until 1 m) ranges up to be-tween 800 and 1000 m far from the river (Fig. 12).
Fig. 11. Map of minimal depth to groundwater table at 100-year-flood scenario without 100-year-flood protection.
Fig. 12. Map of flood-influenced area in the aquifer and value of maximal groundwater rise after flood (100-year-flood without flood protection).
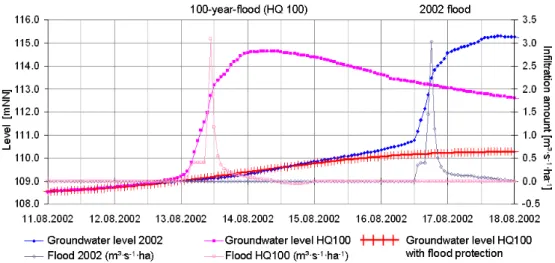
the area of Laubegast. Different time lags are caused by dif-ferentiating the soil conditions and the sealing level of the terrain. The velocity of the propagation of the flood-induced groundwater rise amounts to 50 to 100 m/d in the phreatic groundwater, dependent on the soil condition. The results of the modelling are comparable to phreatic groundwater condi-tions in other river catchment areas e.g. the Danube (Fig. 14). Furthermore, with the modelling of the groundwater flow it is possible to describe the effects of flood protection on the groundwater. The 100-year-flood scenario was modelled with and without flood control measures. Dependant on the soil condition the effect of the flood control on groundwater can be significant. Figure 15 shows an example of a ground-water observation well approximately 200 m from the inun-dation border of the 2002 flood.
Fig. 13. Map of time lag of minimal depths to groundwater table after flood peak (100-year-flood, blue line: border of inundation area).
0 2000 4000 6000 8000
Distance from river [m]
0 10 20 30 40 50 60 70
L
a
g
[
d
a
y
]
Danube - confined aquifer Danube - phreatic aquifer Dresden/Elbe
Fig. 14.Dependence of characteristic time lag on the distance from river (values of the Danube River from Vekerdy and Meijerink, 1998).
Fig. 15. Flood induced groundwater dynamic for 100-year-flood scenario without and with flood protection (compared with 2002 flood scenario).
expected water level, although the water surface is not a plane surface. Flood protecting walls can be planned accordingly. Likewise, the sewerage system that is typically designed for heavy rainfall of few years return period cannot cope with the floods and will fail. Due to the networked pipes it will trans-port water to remote parts of the surface that are below the surface water table. Measures to prevent this effect can be planned easily and do not need dynamic simulations either.
An important aspect to consider is how the measures against floods influence the drainage behaviour of the area under investigation in the case of heavy rainfall.
Closing off drainage pipes leading towards the river and other measures may reduce the onslaught of the rainfall the system can cope with under exceptional circumstances. Therefore, it was investigated to which extend in the district of Dresden Laubegast rainfall of return periods between 2 and 100 years drained under different conditions.
Within short simulation periods, the infiltration/ exfiltra-tion effect of groundwater to/from the sewer can be neglected assuming realistically smallkf-parameter values. It was
as-sumed that the flood-protecting walls are already established and that the sewer system inside the protected area is closed against its outer parts. Consequently, water from the Elbe can be neglected in the simulations.
Figure 16 shows a typical result for such simulations. Rainfalls with return period of 100 years lead to a strong overload of the sewerage system.
Even the 2 years rainfall results in the failure of a sewerage system. The failure is severely augmented if the discharge outfalls to the Elbe river are closed.
Thus, for the planning of the sewerage system scenarios that involve both high water levels in the river and heavy rainfalls must be taken into account.
Due to the high accuracy of the elevation model used in the simulation, the focus of Fig. 17 allows for a more detailed
in-terpretation of the results. Yellow circles mark areas where the surcharge water from the manholes leads to surface water levels that may cause damage. The area within the left circle is a local elevation minimum and therefore very difficult to protect against flooding. For the area within the right circle, however, the weakest point is easily identified and it should therefore be possible to take appropriate measures, poten-tially on the surface to improve the situation by increasing curb heights or similar. There is no need for any measures in the area marked in white in Fig. 17 because either the street is capable of keeping the surcharge water away from private properties or, in case of flooding no valuable infrastructure is affected.
In essence, these considerations show that the high-resolution elevation model is not only necessary to obtain reliable simulation results but also allows for a precise inter-pretation of the results.
6 Conclusions
The surface flood dominates any flood event. Compared to flood simulations without coupled modelling no substantial changes of the surface inundation area could be determined. The main reason is the enormous difference in quantity of surface flood water compared to the water volume discharged within the sewerage system and the groundwater. Therefore, the feedback from the groundwater and the sewerage has no substantial influence on the spatial and temporal distribution of the surface inundation during the flood event.
Fig. 16.Water levels on the surface (dark blue for levels>0.2 m) and surcharging manholes (red lines) for rain with return period 100 a.
Fig. 17.Left: zoom into Fig. 16. Right: elevation model for the area within the right yellow area.
intensify the problem. The infiltration due to rising ground-water only marginally contributes to the loading of the se-werage network.
Furthermore, coupled modelling emphasises the basic principle of consistency of flood protection for both, surface and subsurface. Protection measures in the sewerage sys-tem are successful if infiltration from the surface beyond the protection line into the sewerage system can be prevented. In addition, subsurface flooding only can be effectively pro-tected against, if protection measures against discharge in the sewerage network are underneath the flood protection line.
The micro-scale modelling has identified an increase of flood risk in the case of the simultaneous occurrence of heavy rainfalls and high water levels in an adjacent river that does not allow the discharge of surplus water from the sewerage system. Consequently, additional water will flood the surface and will need to be managed there in such a way that the potential damage can be reduced. The micro-simulation of surface runoff water is an appropriate method for planning effective measures as it can identify areas where the streets
have enough capacity to keep the water away from valuable infrastructure or where the raising of curbs can substantially increase this capacity. Potential further measures to be mo-delled are small-scale retention basins that only cover a small effective area in contrast to large-scale basins that are often impossible to construct in existing urban areas.
Acknowledgements. The investigations were undertaken within the project 3ZM-GRIMEX – Development of a Three Zone Model for Flood, Infrastructure and Groundwater Management in Urban Areas. This project was part of the founding priority RIMAX. We thank the German Ministry for Education and Research (BMBF) (No. 02WH0557) for the financial support given. Furthermore, we thank the reviewers for their helpful comments as well as Karla and Graeme McCabe for editing the English text.
Edited by: A. Schumann
Reviewed by: two anonymous referees
References
Aronica, G., Bates, P. D., and Horritt, M. S.: Assessing the uncer-tainty in distributed model predictions using observed binary in-formation within GLUE, Hydrol. Process., 16, 2001–2016, 2002. Belz, J. U., Burek, P., Matth¨aus, H., Rudolf, B., Vollmer, S., and Wiechmann, W.: Das Hochwasser der Elbe im Fr¨uhjahr 2006 (The Elbe Flood at Spring 2006), Report, Federal Agency of Hy-drology, Koblenz, Germany, Report No. BFG-1514, 2006. Beyer, K.-D.: Erhalt der Geb¨audesicherheit – Sofortmaßnahmen
und Dauerl¨osung Beispiel St.-Benno Gymnasium Dresden, in: Hochwassernachsorge – Grundwasser Dresden, Proceedings of the Scientific Workshop at 8th of October 2003 in Dresden, edited by: DGFZ (Dresden Groundwater Research Center) and Landeshauptstadt Dresden (Federal State Capital Dresden), Dresden, Germany, 63–68, 2003
B¨uchele, B., Kreibich, H., Kron, A., Thieken, A., Ihringer, J., Oberle, P., Merz, B., and Nestmann, F.: Flood-risk mapping: contributions towards an enhanced assessment of extreme events and associated risks, Nat. Hazards Earth Syst. Sci., 6, 485–503, 2006, http://www.nat-hazards-earth-syst-sci.net/6/485/2006/. Casulli, V.: Semi-implicit finite difference methods for the
twodi-mensional shallow water equations, J. Comput. Phys., 86(1), 56– 74, 1990.
Cheng, R. T., Casulli, V., and Gartner, J. W.: Tidal, Residual, In-tertidal Mudflat (TRIM) Model and its applications to San Fran-cisco Bay, Estuar. Coast. Shelf. S., 36, 235–280, 1993.
Ellis, J. B.: Sewer infiltration/exfiltration and interactions with sewer flows and groundwater quality. interactions between sew-ers, treatment plants and receiving waters in urban areas – IN-TERUBA II, Lisbon, 311–319, 2001.
Engel, H.: The flood event 2002 in the Elbe river basin: causes of the flood, its course, statistical assessment and flood damages, Houille Blanche, 2004(6), 33–36, 2004.
Ettrich, N. and Sieh, W.: Detaillierte st¨adtische H¨ohenmodelle aus Laserscannerdaten zur Simulation oberfl¨achigen Wasser-abflusses, Zeitschrift f¨ur Geod¨asie, Geoinformation und Land-management, 2/131, 53–60, 2005.
Ettrich, N.: RiSurSim – Risk management for urban drainage systems – simulation and optimization, Subproject surface water (Risikomanagement f¨ur urbane Entw¨asserungssysteme – Simulation und Optimierung (RisUrSim) Teilprojekt Oberfl¨ache, Abschlussbericht), Final report, http://www.itwm.fraunhofer. de/sks/projects/sks hochwasser und risikomanagement/media/ Risursim rep itwm.pdf, (access: 23 October 2007), ITWM, Kaiserslautern, 2003 (in German).
Ettrich, N.: Surface-sewer coupling and detailed elevation models for accurate urban drainage modelling, Proceedings Cost Session AquaTerra Conference: Special aspects of urban flood manage-ment Institut f¨ur Wasserbau, TU Hamburg-Harburg, 183–195, 2007
Fuchs, L., Scheffer, C., and Verworn, H.-R.: Modellbeschreibung: Hystem-Extran 6. Institut f¨ur technisch wissenschaftliche Hy-drologie GmbH (ITWH), Hannover, 2004
Fulford, J. M.: Computational Technique and Performance of Tran-sient Inundation Model for Rivers – 2 Dimensional, Report, USGS, Open-File Report No. 03-371, 2003.
Gustafsson, L. G., Winberg, S., and Refsgaard, A.: Towards a dis-tributed physically based model description of the urban aquatic environment, Water Sci. Technol., 36(8–9), 89–93, 1997 Hsu, M. H., Chen, S. H., and Chang, T. J.: Dynamic inundation
simulation of storm water interaction between sewer system and overland flows, J. Chin. Inst. Eng., 25(2), 171–177, 2002. Hunter, N. M., Bates, P. D., Horritt, M. S., De Roo, A. P. J., and
Werner, M. G. F.: Utility of different data types for calibrat-ing flood inundation models within a GLUE framework, Hydrol. Earth Syst. Sci., 9, 412-430, 2005,
http://www.hydrol-earth-syst-sci.net/9/412/2005/.
Karpf, C. and Krebs, P.: Sewers as drainage systems – quantifica-tion of groundwater infiltraquantifica-tion, 5th int. conference NOVATECH, Lyon, 969–976, 2004.
Lerner, D. N.: Identifying and quantifying urban recharge, Hydro-geol. J., 10(1), 143–152 2002.
LfULG: Hydrogeological Mapping, Map L4948 Dresden (Ger-man), Freiberg/Torgau, 2004.
LH DD: Influence of Flood Event 2002 on Groundwater, Re-search Report Environmental Office, Dresden, 68 pp., ISBN 3-00-016634-9, http://www.dresden.de/media/pdf/umwelt/gw forschungsbericht.pdf, 2005 (in German).
LH DD: Environmental atlas – Map 4.2: Groundwater distribution (German), Dresden, 05/2007, http://www.dresden.de/media/pdf/ umwelt/ua 4 2 text.pdf, (access: 27 January 2008), 2007. Marre, D., Walther, W., and Ullrich, K.: Influence of the Flood 2002
on Groundwater Chemistry in Dresden, Germany, Grundwasser, 10(3), 146–156, 2005 (in German).
M¨uller, M., Sames, D., and Mansel, H.: PCGEOFIM – A Finite Volume Model for More?, MODFLOW and More 2003: Under-standing through Modeling, Conference in Golden, CO, USA, 16–19 September 2003.
M¨uller, M., Werner, F., Eulitz, K., and Graupner, B.: Water Quality Modeling of Pit Lakes: Development of a Multiply-Coupled Groundwater Lake Circulation and Chemical Model, Proceedings of IMWA2008, http://www.imwa.info/docs/imwa 2008/IMWA2008 063 Mueller.pdf, (access: 28 January 2009), 2008.
Nieschulz, K.-P., Milina, J., Schilling, W., Schmitt, T.-G., M¨uller, M., and Zimmermann, J.: Gekoppelte Kanal- und Oberfl¨achenstr¨omung – Entwicklung eines EDV – Werkzeuges als Planungshilfe in Stadtentw¨asserung und Hochwasserschutz. 2. Hannoversche Software-Tage f¨ur die Wasserwirtschaft, 27 and 28 March 2001, Hannover, Technische Akademie Hannover e.V., 2001.
Wasser-wirtschaft, 90(7–8), 368–373, 2000.
Oberle, P.: Integrales Hochwassersimulationssystem Neckar – Verfahren, Werkzeuge, Anwendungen und ¨Ubertragung (Inte-gral flood simulation system Neckar – methods, tools, applica-tions and transfer), Mitteilungen des Instituts f¨ur Wasser und Gew¨asserentwicklung, Heft 226, 2004.
Pappenberger, F., Frodsham, K., Beven, K., Romanowicz, R., and Matgen, P.: Fuzzy set approach to calibrating distributed flood inundation models using remote sensing observations, Hydrol. Earth Syst. Sci., 11, 739–752, 2007,
http://www.hydrol-earth-syst-sci.net/11/739/2007/.
Peetz, J.-V., Steckel, B., Sommer, T., Eulitz, K., Ettrich, N., and M¨uller, M.: 3-Code Coupling in Flood Simulation, Proceedings MpCCI 8th User Forum, Bonn, 108–117, http://www.mpcci.de/ fileadmin/mpcci/Userforum/MpCCI 8th UserForum.pdf, 13–14 February 2007.
Penning-Rowsell, E. C., Fordham, M., Correia, F. N., Gardiner, J., Green, C., Hubert, G., Ketteridge, A.-M., Klaus, J., Parker, D., Peerbolte, B., Pfl¨ugner, W., Reitano, B., Rocha, J., Sanchez-Arcilla, A., Saraiva, M. d. G., Schmidtke, R., Torterotot, J.-P., van der Veen, A., Wierstra, E., and Wind, H.: Flood hazard assessment, modelling and management: Results from the EU-ROflood project, in: Floods across Europe: Flood hazard assess-ment, modelling and manageassess-ment, edited by: Penning-Rowsell, E. C. and Fordham, M., Middlesex University Press, London, 37–72, 1994.
Saltelli, A., Chan, K., and Scott, E. M.: Sensitivity analysis, Wiley, 2002.
Sames, D., Boy, S., and Br¨uckner, F.: PCGEOFIM, Programsys-tem for Computation of GEOFIltration and GeoMigration, un-published, 2005 (in German).
Vekerdy, Z. and Meijerink, A. M. J.: Statistical and analytical study of the propagation of flood-induced groundwater rise in an allu-vial aquifer, J. Hydrol., 205, 112–125, 1998.
Weichel, T., Pappenberger, F., and Schulz, K.: Sensitivity and un-certainty in flood inundation modelling - concept of an analysis framework, Adv. Geosci., 11, 31–36, 2007,
http://www.adv-geosci.net/11/31/2007/.
Werner, M. G. F., Hunter, N. M., and Bates, P. D.: Identifiability of distributed floodplain roughness values in flood extent estima-tion, J. Hydrol., 314, 139–157, 2005.