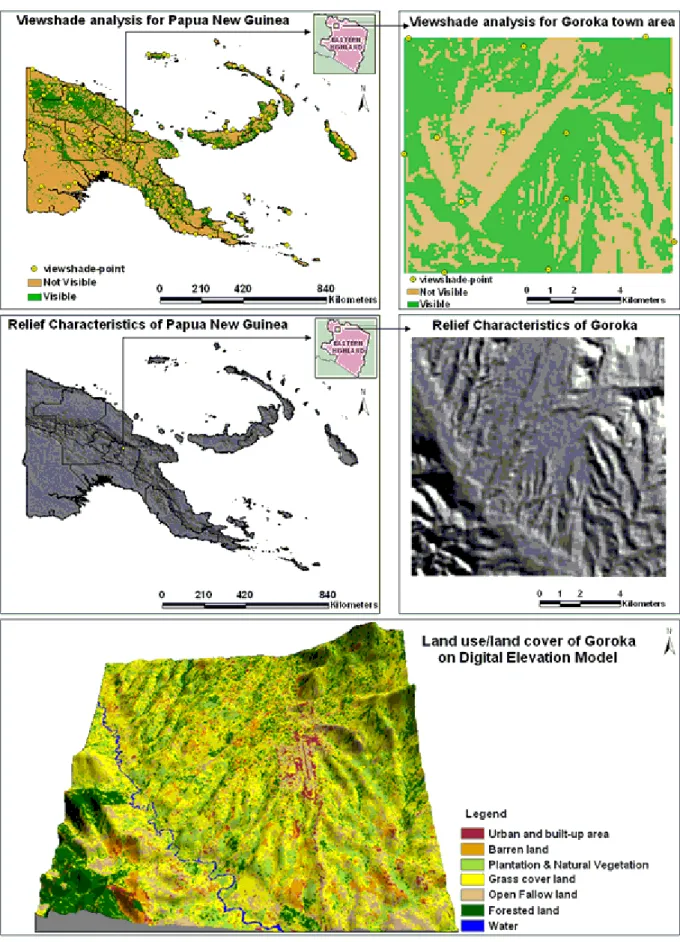
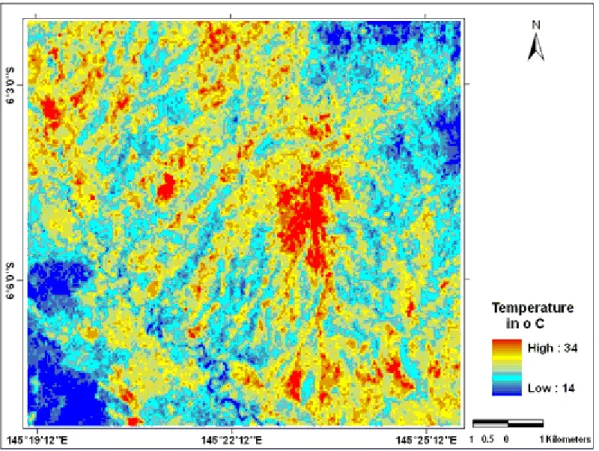
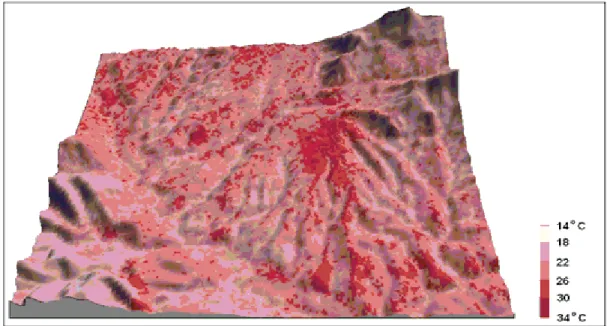
Topography and Land Temperature Investigation Using Arc GIS 10
Texto
Imagem
Documentos relacionados
In what follows, we are going to present some results of our model (Temperature distribution, moisture content profiles and stresses) and to discuss the influence of some
In this work, we model the temperature variation (frequency variation) due to the Doppler effect and apply the new temperature distribution in the thermal re-emission model. The
Finally, we presented numerical implementations for a two-dimensional model, using Taylor-Hood elements for the velocity-pressure and bilinear elements for the temperature, to
When data are available from nearby streams, the local data can help define the annual cubic pattern in the model, but when they are not available the higher variability in daily
This study introduces a quasi-global (hereafter, global) landslide moni- toring model using satellite precipitation data, land-use land cover maps, and 250 m topography
Using satellite-based MODIS data (land surface temperature data, EVI, etc.), and ground-based on-site soil moisture data and meteorological data (air tempera- ture, relative
To overcome the defects of the models mentioned above, refined rank set pair analy- sis (RRSPA) model is proposed in the paper. First, the three-element connection number is
We used to detect the baroclinic motion in this reservoir using a two-layered internal wave model and the spectral analysis of temperature series of thermocline depth,
