IJER@2013
Page 219
Global Maximum Power Point Tracking of Photovoltaic Array under Partial
Shaded Conditions
G. Shobana, P. Sornadeepika, Dr. R. Ramaprabha
Department of Electrical and Electronics Engineering
SSN College of Engineering, Rajiv Gandhi Salai, Kalavakkam-603110, Chennai, Tamilnadu, India.
1[email protected], 2 [email protected], 3 [email protected]
Abstract - Efficiency of the PV module can be improved by operating at its peak power point so that the maximum power can be delivered to the load under varying environmental conditions. This paper is mainly focused on the maximum power point tracking of solar photovoltaic array (PV) under non uniform insolation conditions. A maximum power point tracker (MPPT) is used for extracting the maximum power from the solar PV module and transferring that power to the load. The problem of maximum power point (MPP) tracking becomes a problem when the array receives non uniform insolation. Cells under shade absorb a large amount of electric power generated by cells receiving high insolation and convert it into heat which may damage the low illuminated cells. To relieve the stress on shaded cells, bypass diodes are added across the modules. In such a case multiple peaks in voltage-power characteristics are observed. Classical MPPT methods are not effective due to their inability to discriminate between local and global maximum. In this paper, Global MPPT algorithm is proposed to track the global maximum power point of PV array under partial shaded conditions.
Key Words - PV systems, Boost power converters, MPPT, MATLAB
I. INTRODUCTION
Photovoltaic power generation systems have infinite energy resources and are environment friendly technology. But low efficiency and high cost per unit output power is the biggest problem of these systems. Accommodation of PV panels in the
roof top creates a practical constraint of “partially shaded condition” or “Non uniformly illuminated array condition”. The power-voltage characteristic of photovoltaic arrays operating under partial shading conditions exhibits multiple local maximum power points due to the usage of bypass diodes [1]-[2]. The bypass diode is connected in parallel with each PV module/ group of cells to protect the PV cells against efficiency degradation and hot-spot failure effects. So the MPP tracking algorithm which is able to track global MPP (GMPP) is essential to improve the efficiency of PV arrays. Choice of the apt algorithm from all that available is the biggest challenge.
The MPPT algorithm that is based on a Fibonacci sequence does not provide accurate GMPP [3]. The particle swarm optimization (PSO) [4], Genetic algorithms [5] and differential evolution [6] global MPPT are complex, increase the implementation cost and are unable to guarantee the discrimination between local and global MPP, unless the PV array output power is measured at a large number of operating points. A new method to track the GMPP of PV array operating under
partial shading conditions of standalone system is done by iteratively controlling the voltage input to the converter using improved perturb and observe ( P&O) algorithm. The PV array is connected to a Boost power converter, which is controlled by a microcontroller based control unit to produce pulses for making load matching. This method guarantees convergence to the global MPP under any partial shading conditions, with significantly less PV array power perturbation steps than those obtained using other techniques. This method can easily be incorporated into any existing MPPT control system in both high and low-power energy harvesting applications.
II.SYSTEM DESCRIPTION
This section provides the modelling of PV system and design of the converter with MPPT.
A.MATHEMATICAL MODEL OF PVSYSTEM
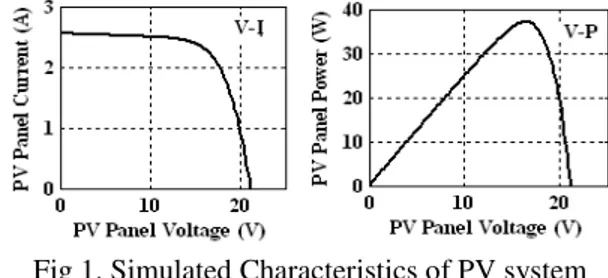
A group of solar PV cells together form the PV power generation system. The modelling of PV system has been done using the equations presented in [1], [3]. Simulation model has been developed using MatLab-Simulink. For isolation, G = 1000 W/m2 and temperature, T = 370C the characteristics of PV panel consisting of 36 cells in series with peak watt of 37.08 W is shown in Fig 1.
Fig 1. Simulated Characteristics of PV system
B.DESIGN OF CONVERTER FED FROM MPPTALGORITHM
The boost converter fed from the MPPT algorithm is used to provide a load matching. The proposed GMPP algorithm is used to feed the load with a fixed reference value from the given set of insolation and temperature conditions. The relationship between the output voltage and the input panel voltage is given by (1).
) D 1 (
PV V o V
(1)
IJER@2013
Page 220
period of IGBT (T=Ton+Toff). So the boost converter is fed bymeans of a control pulse from the pulse width modulated signal obtained by the comparison of the triangular voltage waveform and the error signal from the proportional integral (PI) controller.
III. PROPOSED GLOBAL MAXIMUM POWER POINT TRACKING SYSTEM
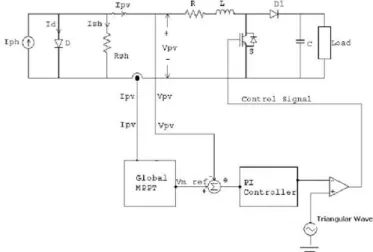
Schematic diagram of the proposed global MPPT system is depicted in Fig 2. Depending on the PV system application domain, boost type dc-dc power converter is used to interface the PV array output power to load. PV array consisting of three panels is connected to a dc-dc boost converter [7]-[10], which is controlled by a microcontroller based control unit, such that it behaves as a constant input-power load. The proposed GMPPT provides a reference voltage. This voltage is compared with the terminal voltage of the PV array under partial shade. This error
voltage is applied to the PI Controller to improve the system’s
gain and steady state tracking accuracy. The output voltage of the PI Controller thus produced is compared with a triangular input and given to the boost converter as input voltage to be boosted. The continuous tracking of the maximum power point of the power voltage characteristics is taken care of by the GMPPT algorithm that decides the reference voltage to the be compared with PV output voltage.
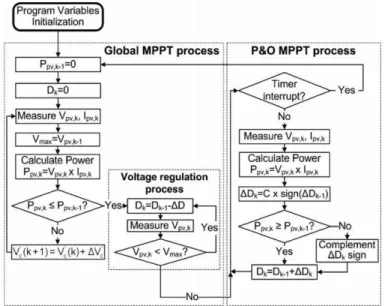
Fig 2. Schematic diagram of the proposed model
The Proposed algorithm does not require the knowledge of electrical characteristics of PV modules and their configuration within PV array. The use of specialized sensors for the measurement of PV array open circuit voltage or short circuit current is not required. The cost of implementation is reduced. This algorithm guarantees the discrimination between local and global maximum power points thereby preventing losses. Flowchart of the proposed global MPPT control algorithm is shown as in Fig.3. Initially, the global MPPT process is performed in order to detect the position of the global MPP of the PV array [1]. During that phase of the proposed algorithm, the power converter control method is set such that the power converter operates as an adjustable constant input-power load. The power drawn by the dc-dc Boost converter is iteratively increased by appropriately adjusting the amplitude of the Vic control signal output by the D/A converter is given in (2)
) k ( c V ) 1 k ( c V ) k ( c
V
(2)
Vc (k) and Vc (k − 1) are the Vc signal values at steps k and k−1, respectively (initially Vc (0) = 0), and ΔVc is the constant perturbation applied [1].
Fig 3. Flowchart of MPPT algorithm
Increasing the value of ΔVc results not only in a reduction of time required to detect the PV array global MPP , but also reduce the ability of the algorithm to discriminate local and global MPP s of similar power levels. At each step, the PV array operating voltage is measured and stored in the microcontroller memory. This process is repeated until the maximum voltage point is reached, where the PV array output power increment is inhibited. This condition indicates that photovoltaic array output power measured during the previous step of the algorithm corresponds to the global MPP. Then, the dc-dc converter duty cycle is iteratively reduced until the PV array output voltage is regulated to the global MPP. Only Photo voltaic array output voltage is measured in order to perform this process. The procedure presented previously is applied periodically (e.g., 1–15 min) to detect the position of the global MPP of the PV array. Then, the P&O MPPT algorithm is executed in order to maintain operation at the previously detected global MPP during the short-term variations of solar irradiation and the ambient temperature conditions. During the P&O MPPT process, the dc-dc converter average input power is calculated by measuring the PV array output voltage and current. The resulting value is compared with the input power measured during the previous iteration of the algorithm. The duty cycle of the converter is computed by (3) and (4). k D 1 k D k
D (3)
) 1 k , pv P k , pv P ( sign ) 1 k D ( sign C k
D
(4)
IJER@2013
Page 221
0 x , 1
0 x , 1 ) x (
sign (5)
The duty cycle is changed continuously according to the P&O algorithm, resulting in steady-state operation around the global MPP. It is observed that compared with past-proposed methods, using the algorithm presented will result in a much faster convergence to the global MPP.
IV. RESULTS AND TABLES
Under non-uniform insolation condition, the P-V characteristic of PV array exhibits a multiple local maxima and only one of them corresponds to global MPP. The non-uniform insolation condition is obtained by giving three different insolation condition (G1=1000 W/m2, G2=800 W/m2, G3=500W/m2) and constant temperature T=37oC to each PV panel. The following electrical characteristics were observed. PV array characteristics under non-uniform insolation condition are shown in Fig 4.
Fig 4. Characteristics of PV array under non-uniform insolation condition
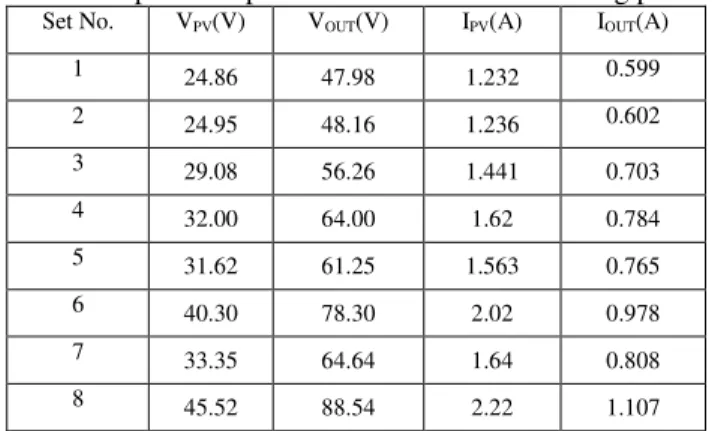
Similarly the simulation is performed for various insolation pattern and the desired values of panel voltage (Vm), panel current (Im), panel power (Pm) is found. Various shading patterns are tabulated in table as shown in Table 1. The corresponding voltage, current and power at both PV side and load side are tabulated in Table 2 and Table 3. From these tables, it is observed that for different insolation set, the proposed algorithm tracks the maximum power. Also it is inferred from the Table 3, the losses occur in the MPP tracker and it is approximately 2 W.
Table 1. Set values under various non uniform insolation conditions
Set No. G1(W/m2) G2(W/m2) G3(W/m2)
1 700 500 300
2 800 300 500
3 900 300 600
4 1000 500 800
5 1000 700 300
6 1000 800 900
7 1000 900 500
8 1000 1000 1000
Table 2.Output Vs Input Values for different shading pattern Set No. VPV(V) VOUT(V) IPV(A) IOUT(A)
1 24.86 47.98 1.232 0.599
2 24.95 48.16 1.236 0.602
3 29.08 56.26 1.441 0.703
4 32.00 64.00 1.62 0.784
5 31.62 61.25 1.563 0.765
6 40.30 78.30 2.02 0.978
7 33.35 64.64 1.64 0.808
8 45.52 88.54 2.22 1.107
Table 3. Output Power Vs Input Power for different shading pattern
Set No. Pm(W) PPV(W) P0(W)
1 38 30.61 28.78
2 35 30.83 28.99
3 42 41.89 39.57
4 56 52.87 50.23
5 51 49.43 46.9
6 83 81.01 76.63
7 56 54.49 52.23
8 102 101 97.99
The simulation of proposed algorithm is done. The panel is subjected to various non-uniform insolation conditions are performed. The non-uniform insolation condition is obtained by giving three different insolation condition (G1=1000 W/m2, G2=800 W/m2, G3=500W/m2) and constant temperature T=37o C to each PV panel. Fig 5, Fig 6 and Fig 7 represent the voltage, current and power.
Fig 5. PV Array and Output voltages for Set 4
IJER@2013
Page 222
Fig 7. PV Array and Output powers for Set 4V.THE HARDWARE IMPLEMENTATION
Fig 8 shows the schematic diagram of the proposed model where the solar photovoltaic panel is replaced by the equivalent circuit model with the five parameters of VPV, IPV, VSH, ISH, ID. Thus the constant power is delivered to the load (that is constant power that the panel is capable of producing is delivered to the load) by means of this MPPT tracker. The Hardware implementation is shown in Fig 9.
Fig 8. Schematic diagram of the proposed model
Fig 9. Hardware set up of Fig 8
The hardware implementation is done for the same non - uniform insolation level (i.e. G1=920W/m2 , G2=510W/m2 , G3=602W/m2 ) using Digital Signal Oscilloscope is shown in the Fig 13. The output Voltage measured from DSO is 89.18 V as shown in Fig 14. PV array power and output power are measured by flukemeter. Flukemeter readings are shown in the Fig 12.
Fig 10. Hardware result obtained from the Digital Signal Oscilloscope.
Fig 11. Output voltage obtained from DSO
Fig 12. Power at PV side and Output side
From Fig 12, it is observed that the proposed algorithm tracks the maximum power that is input power is equal to output power which in turn equal to maximum power for that particular condition. Also it is observed that there is 2 W converter losses.
VI. CONCLUSION
The developed GMPPT will be available to apply for a large scale industrial application in roof top as well as domestic applications due to its adaptability under both high and low power applications including the factors of frequently changing ambient temperature and solar irradiation. This algorithm seems to be a more efficient method compared with other conventional algorithm because it does not need the knowledge of the electrical characteristics unlike the classical algorithms. With a large number of real time data, the proposed method can be converted as a neural network trained method with proper training and tuning of the network.
VII.ACKNOWLEDGEMENT
IJER@2013
Page 223
REFERENCESi. Eftichios Koutroulis and Frede Blaabjerg, “A New Technique for Tracking the Global Maximum Power Point of PV Arrays Operating Under
Partial-Shading Conditions”, IEEE Journal of Photovoltaics, Vol. 2 , No. 2 , pp. 184-190, 2012.
ii. P. Sharma, B. Patnaik, S. P. Duttagupta, and V. Agarwal, “Dynamic power optimization of contoured flexible PV array under non-uniform
illumination conditions,” in Proc. 35th IEEE Photovoltaic Spec. Conf., pp. 968–972, 2010.
iii. R. Ramaprabha, B. L. Mathur, Arthi Ravi and S. Aventhika, “Modified Fibonacci search based MPPT scheme for SPVA under partial shaded
conditions,” in Proc. 3rd Int. Conf. Emerging Trends Eng. Technol., pp.
379–384, 2010.
iv. M. Miyatake, M. Veerachary, F. Toriumi, N. Fujii, and H. Ko, “Maximum
power point tracking of multiple photovoltaic arrays: A PSO approach”,
IEEE Trans. Aerosp. Electron. Syst., Vol. 47, No. 1, pp. 367–380, Jan.2011.
v. K. Odagaki, “Practical study on 5.2MWPVsystem in Sharp’s Kameyama
plant,” in Proc. Power Convers. Conf. Nagoya, pp. 1212–1216, 2007.
vi. H. Taheri, Z. Salam, K. Ishaque, and Syafaruddin, “A novel maximum power point tracking control of photovoltaic system under partial and
rapidly fluctuating shadow conditions using differential evolution,” in
Proc. IEEE Symp. Ind. Electron. Appl., pp. 82–87, 2010.
vii. G. Adinolfi, N. Femia, G. Petrone, G. Spagnuolo, and M.Vitelli, “Energy efficiency effective design of DC/DC converters for DMPPT PV
applications,” in Proc. 35th Annu. Conf. IEEE Ind. Electron., pp. 4566–
4570, 2009.
viii. N. Femia, G. Petrone, G. Spagnuolo and M. Vitelli, (2005) “Optimization of and observe maximum power point tracking method,” IEEE Trans. Power Electron. Vol. 20, No. 4, pp. 963–973.
ix. M. C. Alonso-Gracia, J. M. Ruiz, and F. Chenlo, (2006) “Experimental
Study of mismatch and shading effects in the, Solar Energy Mater”, Solar
Energy Vol. 90, No. 3, pp. 329 340.
x. H. Patel and V. Agarwal, (2001), “PV based distributed generation with compensation feature under unbalanced and non-linear load conditions for a 3-φ,4 wire system,” in Proc. IEEE Int. Conf. Ind. Technol. , Mumbai, India, pp. 322–327.