Obesity and Risk of Colorectal Cancer: A Systematic
Review of Prospective Studies
Yanlei Ma
1*
., Yongzhi Yang
2., Feng Wang
1, Peng Zhang
1, Chenzhang Shi
2, Yang Zou
2, Huanlong Qin
1,2*
1Department of Surgery, Shanghai Tenth People’s Hospital, Affiliated to Tongji University, Shanghai, People’s Republic of China,2Department of Surgery, The Sixth People’s Hospital Affiliated to Shanghai Jiao Tong University, Shanghai, People’s Republic of China
Abstract
Background:
Mounting evidence indicates that obesity may be associated with the risk of colorectal cancer (CRC). To
conduct a systematic review of prospective studies assessing the association of obesity with the risk of CRC using
meta-analysis.
Methodology/Principal Findings:
Relevant studies were identified by a search of MEDLINE and EMBASE databases before
January 2012, with no restrictions. We also reviewed reference lists from retrieved articles. We included prospective studies
that reported relative risk (RR) estimates with 95% confidence intervals (CIs) for the association between general obesity
[measured using body mass index (BMI)] or central obesity [measured using waist circumference (WC)] and the risk of
colorectal, colon, or rectal cancer. Approximately 9, 000, 000 participants from several countries were included in this
analysis. 41 studies on general obesity and 13 studies on central obesity were included in the meta-analysis. The pooled RRs
of CRC for the obese vs. normal category of BMI were 1.334 (95% CI, 1.253–1.420), and the highest vs. lowest category of WC
were 1.455 (95% CI, 1.327–1.596). There was heterogeneity among studies of BMI (P
,
0.001) but not among studies of WC
(P = 0.323).
Conclusions:
Both of general and central obesity were positively associated with the risk of CRC in this meta-analysis.
Citation:Ma Y, Yang Y, Wang F, Zhang P, Shi C, et al. (2013) Obesity and Risk of Colorectal Cancer: A Systematic Review of Prospective Studies. PLoS ONE 8(1): e53916. doi:10.1371/journal.pone.0053916
Editor:Olga Y. Gorlova, The University of Texas M. D. Anderson Cancer Center, United States of America
ReceivedAugust 23, 2012;AcceptedDecember 4, 2012;PublishedJanuary 17, 2013
Copyright:ß2013 Ma et al. This is an open-access article distributed under the terms of the Creative Commons Attribution License, which permits unrestricted use, distribution, and reproduction in any medium, provided the original author and source are credited.
Funding:This work was financially sponsored by the Shanghai Rising-Star Program (No. 11QA1404800), the Grants from the National Natural Science Foundation of China (No. 81001069), and Shanghai Science and Technology Development Fund (No. 12140902300 and No. 12410707400). The funders had no role in study design, data collection and analysis, decision to publish, or preparation of the manuscript.
Competing Interests:The authors have declared that no competing interests exist. * E-mail: yanleima@live.cn (YLM); hl-qin@hotmail.com (HLQ)
.These authors contributed equally to this work.
Introduction
Colorectal cancer (CRC) is one of the most common cancer in
the Western World [1]. Recent decades have witnessed a rapid
increase in CRC morbidity in rapidly developing countries like
China, especially in major cities where significant lifestyle
alterations have occurred [2]. Several studies have demonstrated
that lifestyle factors, such as smoking, obesity, physical inactivity,
or a high-fat/low-fiber diet, might contribute to the aetiology of
CRC [3,4,5]. The prevalence of overweight and obesity is
increasing dramatically in most parts of the world, which are
important for CRC prevention [6].
The relationship between obesity and the risk of CRC has been
assessed by a large number of studies and review papers
[7,8,9,10,11,12,13,14,15,16,17,18,19,20,21,22,23,24,25,26,27,28,
29,30,31,32,33,34,35,36,37,38,39,40,41,42,43,44,45,46,47,48,49,
50,51]. However, the magnitude of the association has varied
widely across studies and the findings have been inconsistent.
Moreover, no overall quantitative estimate has previously been
reported due to different sociodemographic characteristics of
participants or study methodologies in each individual study.
Meanwhile, the effects of these contributing factors on the
heterogeneity of the magnitude of the association were not clear
and have not been systematically analyzed.
The aim of this review was to evaluate the evidence from
prospective studies on general obesity [measured using body mass
index (BMI)] or central obesity [measured using waist
circumfer-ence (WC)] and the risk of CRC by summarizing it quantitatively
with a meta-analysis approach.
Methods
Search Strategy
The literature search was conducted prior to January 2012 in
the MEDLINE and EMBASE databases, including articles that
were ahead of publication. Only studies published in English were
included. The following keywords and/or Medical Subjecgt
Heading (MeSH) terms were used in searching: [body mass index,
BMI, obesity, overweight, or waist circumference (WC)], and
(colorectal cancer or colon cancer or rectal cancer). This
systematic review was planned, conducted, and reported in
adherence to the standards of quality for reporting meta-analysis
[52].
Eligibility Criteria
Citations selected from this initial search were subsequently
screened for eligibility. Studies were included in the meta-analysis
if they met the following criteria: (1) prospective design; (2) the
study of interest was the measurement of body mass index (BMI)
or the waist circumference (WC) for participants; (3) the outcome
of interest was colorectal, colon, or rectal cancer; and (4) the
relative risk (RR) estimates with 95% confidence intervals (CIs) (or
data to calculate these) were reported. Where data sets were
overlapping or duplicated, only the most recent information was
included. All identified studies were reviewed independently for
eligibility by two authors.
Data Extraction
Data were extracted independently by two authors and
cross-checked to reach a consensus. The following variables were
recorded: the first author’s last name, publication year, country
where the study was performed, study period, participant sex and
age, sample size, measured anthropometry and range of BMI or
WC, variables adjusted for in the analysis, and RR estimates with
corresponding 95% CIs for the obese vs. normal categories of BMI
or the the highest vs. lowest categories of WC for participants. The
study quality was assessed using the 9-star Newcastle-Ottawa Scale
[53].
Statistical Analysis
Study-specific RR estimates were combined using a
random-effects model, which considers both within-study and
between-study variation. Statistical heterogeneity among studies was
evaluated with the Q and I
2statistics [54]. Sensitivity analysis
was performed to evaluate the stability of the results. Each
study involved in the meta-analysis was deleted each time to
reflect the influence of the individual data-set to the pooled
RRs.
An estimation of potential publication bias was executed by
the funnel plot. Funnel plot asymmetry was assessed by the
method of Egger’s linear regression test, a linear regression
approach to measure funnel plot asymmetry on the natural
logarithm scale of the RR [55]. Publication bias was also
evaluated graphically using Begg’s funnel plot. All statistical
tests were performed with the STATA software, version 11.0
(Stata Corporation, College Station, Texas). P
,
0.05 was
considered statistically significant.
Results
Literature Search
A flow diagram of our literature search is shown in
Figure 1
.
Total searches yielded 5916 entries. Following the removal of 2531
duplicates, 3385 titles and abstracts were assessed and 341 articles
appeared to be potentially relevant for inclusion in the review. 298
articles were excluded for the following reasons: no original articles
besides editorials, comments, reviews or meta-analysis (n = 208);
BMI or WC not measured (n = 35); duplicate reports from the
same study population (n = 8); no data on CRC (n = 4); or
associations of BMI or WC with CRC risk not reported/not
derivable from reported data (n = 5). The remaining articles,
including 41 on BMI [7,8,9,10,11,12,13,14,15,16,17,18,19,20,21,
22,23,24,25,26,27,28,29,30,31,32,33,34,35,36,37,38,39,40,41,42,
43,44,45,46,47] and 13 on WC [7,12,17,22,23,24,26,28,35,
36,42,45,47] (11 article reported both the BMI and WC
[7,12,17,22,23,24,26,28,35,36,42]),
were
included
in
the
meta-analysis.
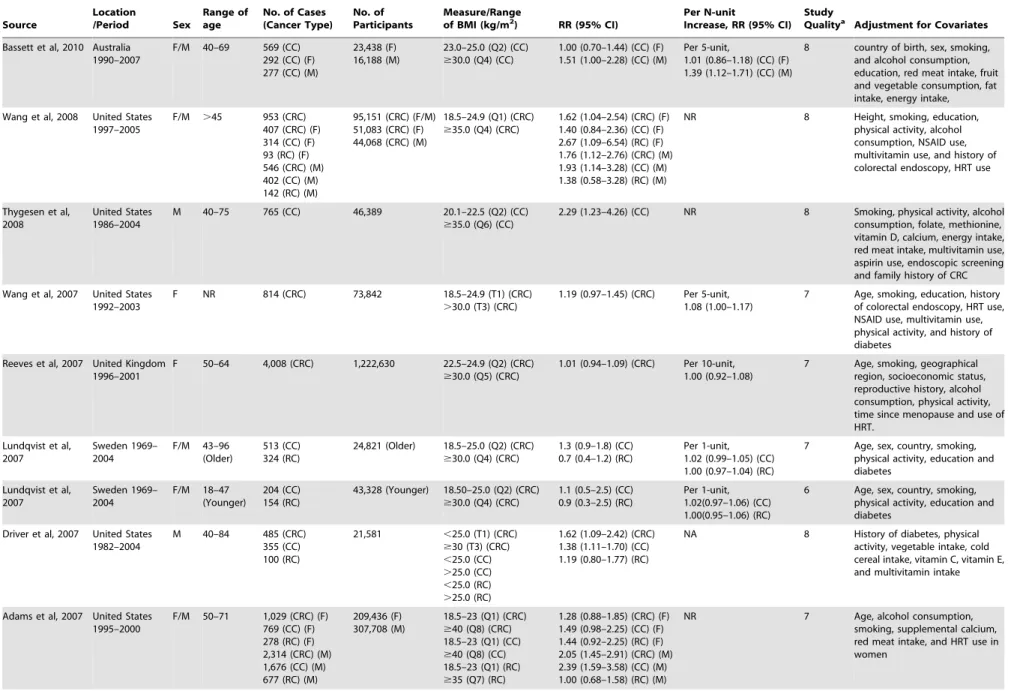
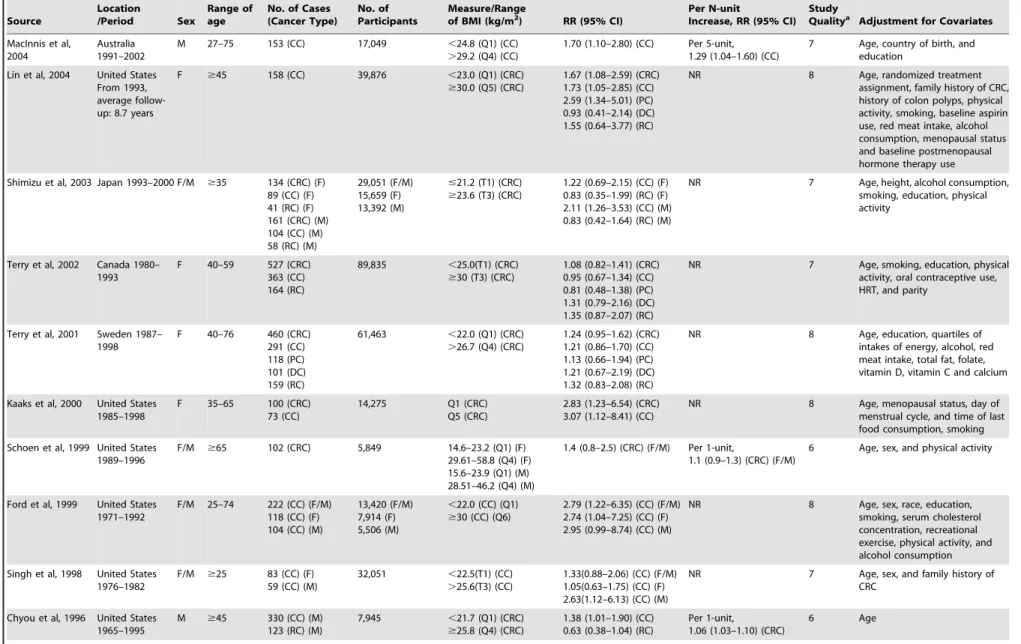
Study Characteristics
The 41 studies on BMI measurement were published between
1992 and 2012 (
Table 1
) and involved a total of 85935 cases and
8115689 participants. Of these 41 studies, 17 were conducted in
the United States, 12 in Europe, 7 in Asia, 4 in Australia and 1 in
Canada. The 13 studies on WC measurement were published
between 1995 and 2012 (
Table 2
) and comprised a total of 6546
cases and 817449 participants. Of those 13 studies, 7 were
conducted in the United States, 3 were conducted in Europe, and
3 in Australia. Most studies provided risk estimates that were
adjusted for age (36 studies), smoking (32 studies), physical activity
(23 studies), alcohol consumption (23 studies). Fewer studies were
adjusted for energy intake (9 studies), NSAID/aspirin use (8
studies), folate (7 studies), calcium (6 studies), diabetes (6 studies).
Very few studies adjusted for CRC screening.
Obese vs. Normal Category of BMI
The multivariable-adjusted RRs for each study and
combina-tion of all studies for the obese vs. normal categories of BMI levels
are shown in
Figure 2
. Results from the studies on BMI levels in
relation to CRC risk were inconsistent. The pooled RRs of CRC
for the obese vs. normal categories of BMI levels were 1.334 (95%
CI, 1.253–1.420). There was high heterogeneity among studies
(P
,
0.001, I
2= 68.9%), so we conducted subgroup meta-analysis
and sensitivity analysis to explore the sources of heterogeneity.
Through omitting one study at a time and calculating the pooled
RRs for the remainder of the studies, there were no changes in the
direction of the effect when any one study was excluded. For
example, when we excluded the study wrote by Engeland et al.
(the study that carried the most weight) from the analysis, the
summarized RR remained significant (RR = 1.344, 95%CI:
1.258–1.436),
and
the
heterogeneity
was
still
significant
(P
,
0.001). This analysis confirmed the stability of the positive
association between BMI and the risk of CRC. The same method
was also suitable for the following analysis.
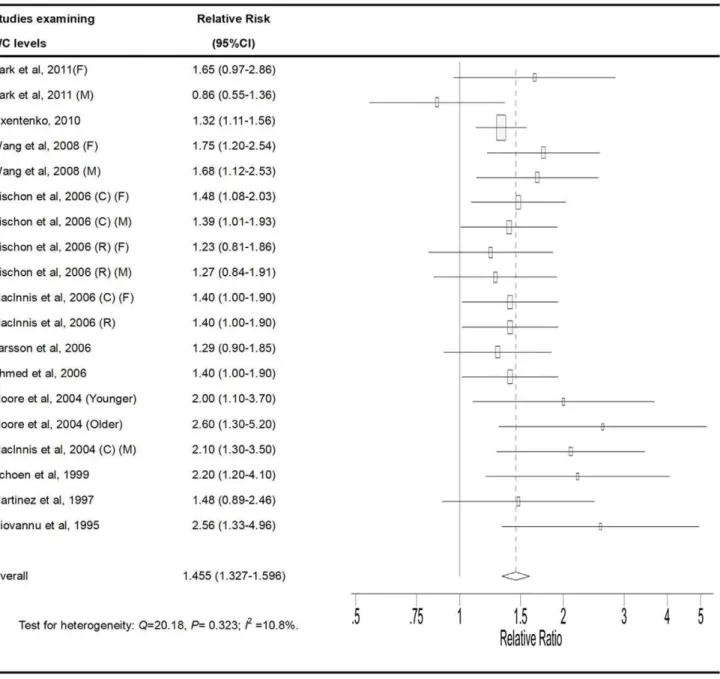
High vs. Low Category of WC
The multivariable-adjusted RRs for each study and
combina-tion of all studies for the high vs. low categories of WC levels are
shown in
Figure 3
. The pooled RRs of CRC for the high vs. low
categories of WC levels were 1.455 (95% CI, 1.327–1.596). There
was no statistically significant heterogeneity among the studies of
WC measurement (P = 0.323, I
2= 10.8%).
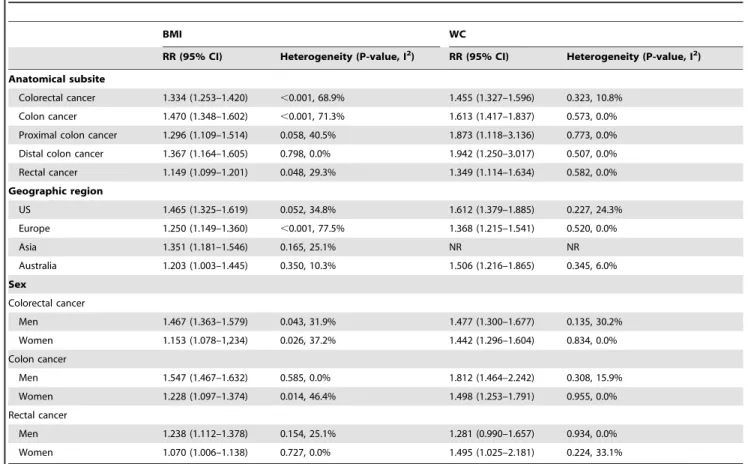
Stratifying Analysis
Stratifying by geographic region, the pooled RRs of CRC for
the obese vs. normal categories of BMI were 1.465 (95% CI,
1.325–1.619) for studies conducted in the United States, 1.250
(95% CI, 1.149–1.360) for studies conducted in Europe, 1.351
(95% CI, 1.181–1.546) for studies conducted in Asia, and 1.203
(95% CI, 1.003–1.445) for studies conducted in Australia. The
pooled RRs of CRC for the highest vs. lowest categories of WC
level were 1.612 (95% CI,1.379–1.885) for studies conducted in
the United States, 1.368 (95% CI, 1.215–1.541) for studies in
Europe, and 1.506 (95% CI, 1.216–1.865) for studies in Australia.
There was no statistically significant heterogeneity among studies
of BMI (United States: P = 0.052, I
2= 34.8%; Asia: P = 0.165,
I
2= 25.1%; Australia: P = 0.350, I
2= 10.3%) and among studies of
WC levels (United States: P = 0.227, I
2= 24.3%; Europe:
P = 0.520, I
2= 0%; Australia: P = 0.345, I
2= 6.0%), with
stratifi-cation by geographic region (
Table 3
). However, there was high
heterogeneity among studies from Europe (P
,
0.001, I
2= 77.5%)
among studies of BMI.
Among the 32 studies that provided results on BMI levels in
relation to colon cancer risk, the RR was 1.470 (95% CI, 1.348–
1.602). 25 cohort studies on BMI levels and rectal cancer risk were
identified. The RR for rectal cancer was 1.149 (95% CI, 1.099–
1.201). The results showed that a higher BMI results in an equal
increase in risk for colon cancer and rectal cancer. However, there
was high heterogeneity among studies on BMI levels in relation to
colon cancer risk (P
,
0.001, I
2= 71.3%). Among 9 studies that
provided results on WC levels in relation to colon cancer risk, the
RR was 1.613 (95% CI,1.417–1.837). 5 studies reported RR
estimates for the highest vs. the lowest category of WC levels and
risk of rectal cancer. The RR for rectal cancer was 1.349 (95% CI,
1.114–1.634). There was no statistically significant heterogeneity
among studies of WC (colon cancer: P = 0.573, I
2= 0%; rectal
cancer: P = 0.582, I
2= 0%) with stratification by colon and rectum
(
Table 3
).
When we stratified the analysis by proximal colon and distal
colon, the pooled RRs of proximal colon cancer (9 studies) and
distal colon cancer (9 studies) for the obese vs. normal categories of
BMI were 1.296 (95% CI, 1.109–1.514) and 1.367 (95% CI,
1.164–1.605), respectively. The results showed that there is a
strong association for higher BMI levels with proximal colon
cancer or distal colon cancer. There was no statistically significant
heterogeneity among studies of BMI (proximal colon cancer:
P = 0.058, I
2= 40.5%; distal colon cancer: P = 0.798, I
2= 0%) with
stratification by proximal colon and distal colon. Meanwhile, the
pooled RRs of proximal colon cancer (2 studies) and distal colon
cancer (2 studies) were 1.873 (95% CI, 1.118–3.136) and 1.942
(95% CI, 1.250–3.017) for the highest vs. lowest categories of WC
levels, respectively. The results showed that a higher WC levels Is
associated with an increased risk for proximal colon or distal colon
cancer. There was no statistically significant heterogeneity among
studies of WC level (proximal colon cancer: P = 0.773, I
2= 0%;
distal colon cancer: P = 0.507, I
2= 0%) with stratifying by
proximal colon and distal colon (
Table 3
).
Stratifying by sex, the pooled RRs of CRC (28 studies) from
male and female CRC studies for the obese vs. normal categories
of BMI were 1.467 (95% CI,1.363–1.579) and 1.153 (95% CI,
1.078–1.234), respectively. The pooled RRs of CRC from male
and female CRC studies for the highest vs. lowest categories of
WC level were 1.477 (95% CI, 1.300–1.677) and 1.442 (95% CI,
1.296–1.604), respectively. Further stratifying by sex and colon
subsites, the pooled RRs of colon cancer from male and female
CRC studies for the obese vs. normal categories of BMI were
1.547 (95% CI, 1.467–1.632) and 1.228 (95% CI, 1.097–1.374),
respectively. The pooled RRs of colon cancer from male and
female CRC studies for the highest vs. lowest categories of WC
level were 1.812 (95% CI, 1.464–2.242) and 1.498 (95% CI,
1.253–1.791), respectively. Further stratifying by sex and rectum
subsites, the pooled RRs of rectal cancer from male and female
CRC studies for the obese vs. normal categories of BMI were
1.238 (95% CI, 1.112–1.378) and 1.070 (95% CI, 1.006–1.138),
respectively. The pooled RRs of rectal cancer from male and
female CRC studies for the highest vs. lowest categories of WC
level were 1.281 (95% CI, 0.990–1.657) and 1.495 (95% CI,
1.025–2.181), respectively (
Table 3
). There was no statistically
significant heterogeneity among studies of WC with stratification
by sex and anatomical site. However, there was high heterogeneity
among studies of BMI with stratification by sex and anatomical
site.
Publication Bias
The Egger’s test showed no evidence of publication bias for
BMI (P = 0.166) or WC levels (P = 0.937), respectively (
Figure 4
and Figure 5
).
Figure 1. Flow diagram of the literature search process.CRC, colorectal cancer; BMI, body mass index; WC, waist circumference. doi:10.1371/journal.pone.0053916.g001
Obesity and Risk of Colorectal Cancer
Table 1.
Characteristics of prospective studies on the association between general obesity [measured using body mass index (BMI)] and risk of colorectal cancer.
Source
Location
/Period Sex
Range of age
No. of Cases (Cancer Type)
No. of Participants
Measure/Range
of BMI (kg/m2) RR (95% CI) Per N-unitIncrease, RR (95% CI) StudyQualitya Adjustment for Covariates
Park et al, 2011 United Kingdom 1993–1997
F/M 40–79 197(CRC) (F) 160 (CRC) (M) 238 (CC) 113 (RC)
24,244 ,22.7 (Q1) (CRC) (F)
$29.4 (Q5) (CRC) (F)
,23.9 (Q1) (CRC) (M)
$28.9 (Q5) (CRC) (M)
1.57 (0.91–2.73) (CRC) (F) 1.06 (0.67–1.69) (CRC) (M)
Per 4-unit,
0.84 (0.58–1.19) (CRC) (F) 0.86 (0.60–1.24) (CRC) (M)
8 Age, sex, smoking, alcohol consumption, education, physical activity, family history of CRC, energy intake, folate, fibre, red meat intake
Odegaard et al, 2011
Singapore 1993–1998
F/M 45–74 980 (CRC) 596 (CC) 384 (RC)
51,251 21.5–24.4 (Q3) (CRC)
$27.5 (Q5) (CRC)
1.25 (1.01–1.55) (CRC) 1.48 (1.13–1.92) (CC) 0.93 (0.64–1.36) (RC)
NR 8 Age, sex, smoking, alcohol consumption, year of enrollment, dialect, education, diabetes status, familial history of cancer, dietary pattern score, physical activity, sleep and energy intake
Matsuo et al, 2011 Japan average follow-up: 11.0 years
F/M NR 1,924 (CRC) (F) 1,534 (CC) (F) 710 (PCC) (F) 609 (DCC) (F) 735 (RC) (F) 3,055 (CRC) (M) 1,919 (CC) (M) 710 (PCC) (M) 946 (DCC) (M) 1,111 (RC) (M)
341,384 21–23 (Q3) (CRC)
$30.00 (Q7) (CRC)
1.30 (1.00–1.68) (CRC) (F) 1.39 (1.02–1.90) (CC) (F) 1.26 (0.79–1.99) (PCC) (F) 1.76 (1.06–2.91) (DCC) (F) 1.33 (0.82–2.15) (RC) (F) 1.50 (1.15–1.96) (CRC) (M) 1.37 (0.96–1.98) (CC) (M) 1.55 (0.83–2.88) (PCC) (M) 1.80 (1.11–2.92) (DCC) (M) 1.85 (1.23–2.78) (RC) (M)
Per 1-unit,
1.02 (1.00–1.03) (CRC) (F) 1.04 (1.03–1.06) (CC) (F) 1.03 (1.01–1.06) (PCC) (F) 1.03 (1.00–1.06) (DCC) (F) 1.00 (0.99–1.00) (RC) (F) 1.03 (1.02–1.04) (CRC) (M) 1.04 (1.02–1.06) (CC) (M) 1.04(1.01–1.06) (PCC) (M) 1.05(1.03–1.08) (DCC) (M) 1.02 (1.00–1.04) (RC) (M)
7 Age, area,smoking, alcohol consumption, energy intake, red meat intake, fiber, calcium intake, folate intake and physical activity
Levi et al, 2011 Israel 1967–2005
M 16–19 445 (CC) 193 (RC)
939,471 ,19.01(Q1) (CRC)
$23.63(Q5) (CRC)
1.69 (1.24–2.29) (CC) 0.86 (0.54–1.34) (RC)
NR 8 Age, year of birth, country of origin, residence (rural or urban), immigration status,
socioeconomic status, and height
Hughes et al, 2011 Netherlands 1986–2002
F/M 55–69 2,316 (CRC) 1,106 (CRC) (F) 459 (PCC) (F) 327 (DCC) (F) 205 (RC) (F) 1,211 (CRC) (M) 327 (PCC) (M) 427 (DCC) (M) 299 (RC) (M)
120,852 15.4–22.1 (Q1) (CRC) (F) 27.6–41.4 (Q5) (CRC) (F) 16.1–23.0 (Q1) (CRC) (M) 27.1–39.6 (Q5) (CRC) (M)
0.97 (0.76–1.24) (CRC) (F) 0.91 (0.65–1.28) (PCC) (F) 1.04 (0.72–1.50) (DCC) (F) 1.07 (0.67–1.60) (RC) (F) 1.25 (0.96–1.62) (CRC) (M) 1.35 (0.90–1.98) (PCC) (M) 1.38 (0.95–1.98) (DCC) (M) 1.01 (0.67–1.51) (RC) (M)
Per 5-unit
0.98 (0.88–1.10) (CRC) (F) 1.02 (0.87–1.18) (PCC) (F) 0.95 (0.79–1.14) (DCC) (F) 1.05 (0.83–1.31) (RC) (F) Per 5-unit
1.25 (1.05–1.46) (CRC) (M) 1.19 (0.92–1.54) (PCC) (M) 1.42 (1.13–1.79) (DCC) (M) 1.02 (0.79–1.32) (RC) (M)
7 Age, smoking, alcohol consumption, energy intake, physical activity, education, family history of CRC
Oxentenko et al, 2010
United States 1986–2005
F 55–69 1,464 (CRC) 36,941 #23.45 (Q1) (CRC)
$29.52 (Q4) (CRC)
1.29 (1.10–1.51) (CRC) NR 8 Age, age at menopause, exogenous estrogen use, oral contraceptive use, smoking, physical activity, selfreported diabetes mellitus, energy intake, red meat intake, fruits and vegetables, calcium, folate, vitamin E and alcohol consumption
Obesity
and
Risk
of
Colorec
tal
Cancer
ONE
|
www.ploson
e.org
4
January
2013
|
Volume
8
|
Issue
1
|
Table 1.
Cont.
Source Location /Period Sex Range of ageNo. of Cases (Cancer Type)
No. of Participants
Measure/Range
of BMI (kg/m2) RR (95% CI) Per N-unitIncrease, RR (95% CI) StudyQualitya Adjustment for Covariates
Bassett et al, 2010 Australia 1990–2007
F/M 40–69 569 (CC) 292 (CC) (F) 277 (CC) (M)
23,438 (F) 16,188 (M)
23.0–25.0 (Q2) (CC)
$30.0 (Q4) (CC)
1.00 (0.70–1.44) (CC) (F) 1.51 (1.00–2.28) (CC) (M)
Per 5-unit,
1.01 (0.86–1.18) (CC) (F) 1.39 (1.12–1.71) (CC) (M)
8 country of birth, sex, smoking, and alcohol consumption, education, red meat intake, fruit and vegetable consumption, fat intake, energy intake,
Wang et al, 2008 United States 1997–2005
F/M .45 953 (CRC) 407 (CRC) (F) 314 (CC) (F) 93 (RC) (F) 546 (CRC) (M) 402 (CC) (M) 142 (RC) (M)
95,151 (CRC) (F/M) 51,083 (CRC) (F) 44,068 (CRC) (M)
18.5–24.9 (Q1) (CRC)
$35.0 (Q4) (CRC)
1.62 (1.04–2.54) (CRC) (F) 1.40 (0.84–2.36) (CC) (F) 2.67 (1.09–6.54) (RC) (F) 1.76 (1.12–2.76) (CRC) (M) 1.93 (1.14–3.28) (CC) (M) 1.38 (0.58–3.28) (RC) (M)
NR 8 Height, smoking, education, physical activity, alcohol consumption, NSAID use, multivitamin use, and history of colorectal endoscopy, HRT use
Thygesen et al, 2008
United States 1986–2004
M 40–75 765 (CC) 46,389 20.1–22.5 (Q2) (CC)
$35.0 (Q6) (CC)
2.29 (1.23–4.26) (CC) NR 8 Smoking, physical activity, alcohol consumption, folate, methionine, vitamin D, calcium, energy intake, red meat intake, multivitamin use, aspirin use, endoscopic screening and family history of CRC
Wang et al, 2007 United States 1992–2003
F NR 814 (CRC) 73,842 18.5–24.9 (T1) (CRC)
.30.0 (T3) (CRC)
1.19 (0.97–1.45) (CRC) Per 5-unit, 1.08 (1.00–1.17)
7 Age, smoking, education, history of colorectal endoscopy, HRT use, NSAID use, multivitamin use, physical activity, and history of diabetes
Reeves et al, 2007 United Kingdom 1996–2001
F 50–64 4,008 (CRC) 1,222,630 22.5–24.9 (Q2) (CRC)
$30.0 (Q5) (CRC)
1.01 (0.94–1.09) (CRC) Per 10-unit, 1.00 (0.92–1.08)
7 Age, smoking, geographical region, socioeconomic status, reproductive history, alcohol consumption, physical activity, time since menopause and use of HRT.
Lundqvist et al, 2007 Sweden 1969– 2004 F/M 43–96 (Older) 513 (CC) 324 (RC)
24,821 (Older) 18.5–25.0 (Q2) (CRC)
$30.0 (Q4) (CRC)
1.3 (0.9–1.8) (CC) 0.7 (0.4–1.2) (RC)
Per 1-unit, 1.02 (0.99–1.05) (CC) 1.00 (0.97–1.04) (RC)
7 Age, sex, country, smoking, physical activity, education and diabetes
Lundqvist et al, 2007 Sweden 1969– 2004 F/M 18–47 (Younger) 204 (CC) 154 (RC)
43,328 (Younger) 18.50–25.0 (Q2) (CRC)
$30.0 (Q4) (CRC)
1.1 (0.5–2.5) (CC) 0.9 (0.3–2.5) (RC)
Per 1-unit, 1.02(0.97–1.06) (CC) 1.00(0.95–1.06) (RC)
6 Age, sex, country, smoking, physical activity, education and diabetes
Driver et al, 2007 United States 1982–2004
M 40–84 485 (CRC) 355 (CC) 100 (RC)
21,581 ,25.0 (T1) (CRC)
$30 (T3) (CRC)
,25.0 (CC)
.25.0 (CC)
,25.0 (RC)
.25.0 (RC)
1.62 (1.09–2.42) (CRC) 1.38 (1.11–1.70) (CC) 1.19 (0.80–1.77) (RC)
NA 8 History of diabetes, physical activity, vegetable intake, cold cereal intake, vitamin C, vitamin E, and multivitamin intake
Adams et al, 2007 United States 1995–2000
F/M 50–71 1,029 (CRC) (F) 769 (CC) (F) 278 (RC) (F) 2,314 (CRC) (M) 1,676 (CC) (M) 677 (RC) (M)
209,436 (F) 307,708 (M)
18.5–23 (Q1) (CRC)
$40 (Q8) (CRC) 18.5–23 (Q1) (CC)
$40 (Q8) (CC) 18.5–23 (Q1) (RC)
$35 (Q7) (RC)
1.28 (0.88–1.85) (CRC) (F) 1.49 (0.98–2.25) (CC) (F) 1.44 (0.92–2.25) (RC) (F) 2.05 (1.45–2.91) (CRC) (M) 2.39 (1.59–3.58) (CC) (M) 1.00 (0.68–1.58) (RC) (M)
Table 1.
Cont.
Source
Location
/Period Sex
Range of age
No. of Cases (Cancer Type)
No. of Participants
Measure/Range
of BMI (kg/m2) RR (95% CI) Per N-unitIncrease, RR (95% CI) StudyQualitya Adjustment for Covariates
Samanic et al, 2006 Sweden 1971– 1999
M 18–67 1,795 (CC) 1,362 (RC)
362,552 18.5–24.9 (Q2)
.30.0 (Q4)
1.74 (1.48–2.04) (CC) 1.36 (1.13–1.66) (RC)
NR 7 Age and calendar year, smoking, and relative to normal weight subjects
Pischon et al, 2006 Europe 1992– 2000
F/M 25–70 1,570 (CRC) 984 (CC) 586 (RC) 563 (CC) (F) 291 (RC) (F) 421 (CC) (M) 295 (RC) (M)
238,546(F) 129,731(M)
,25.0 (T1) (CC) (F/M)
$30.0 (T3) (CC) (F/M)
,21.7 (Q1) (RC) (F)
$28.9 (Q5) (RC) (F)
,23.6 (Q1) (RC) (M)
$29.4 (Q5) (RC) (M)
1.07 (0.82–1.38) (CC) (F) 1.06 (0.71–1.58) (RC) (F) 1.41 (1.06–1.88) (CC) (M) 1.05 (0.72–1.55) (RC) (M)
Per 1-unit,
1.02(1.00–1.04) (CC) (F) 1.05(1.02–1.08) (CC) (M) NR (RC)
8 smoking, education, alcohol consumption, physical activity, fiber intake, and red meat intake, fish and shellfish, and fruits and vegetables
MacInnis et al, 2006 Australia 1990– 2003
F 40–69 212 (CC) 24,072 ,25.0 (T1) (CC)
$30.0 (T3) (CC)
1.0 (0.7–1.4) (CC) Per 5-unit, 1.04 (0.90–1.20) (CC)
7 Country of birth, education and HRT use
MacInnis et al, 2006 Australia 1990– 2003
F/M 27–75 229 (RC) 24,247 (F) 16,867 (M)
,25.0 (T1) (RC)
$30.0 (T3) (RC)
1.2 (0.8–1.7) (RC) (F/M) 1.1 (0.7–1.9) (RC) (F) 1.3 (0.8–2.4) (RC) (M)
Per 5-unit,
1.03 (0.88–1.21) (RC) (F/M) 0.98 (0.80–1.22) (RC) (F) 1.09 (0.86–1.38) (RC) (M)
7 Age, sex, and country of birth
Lukanova et al, 2006
Sweden 1985– 2003
F/M 29–61 108 (CRC) (F) 76 (CC) (F) 31 (RC) (F) 136 (CRC) (M) 73 (CC) (M) 58 (RC) (M)
35,362 (F) 33,424 (M)
18.5–24.9 (T1) (CRC)
$30.0 (T3) (CRC)
2.01 (1.22–3.27) (CRC) (F) 2.25 (1.25–3.98 (CC) (F) 1.30 (0.42–3.45) (RC) (F) 1.61 (0.95–2.65) (CRC) (M) 1.43 (0.62–3.02) (CC) (M) 1.96 (0.96–3.86) (RC) (M)
NR 6 Age, calendar year and smoking,
Larsson et al, 2006 Sweden 1997– 2005
M 45–79 464 (CRC) 284 (CC) 120 (PC) 129 (DC) 180 (RC)
45,906 ,23.0 (Q1) (CRC)
$30.0 (Q5) (CRC)
1.54 (1.08–2.21) (CRC) 1.60 (1.03–2.48) (CC) 1.43 (0.71–2.88) (PC) 1.49 (0.78–2.84) (DC) 1.44 (0.79–2.61) (RC)
Per 1-unit,
1.04 (1.01–1.07) (CRC)
7 Age, education, smoking, family history of CRC, history of diabetes, aspirin use, and physical activity
Bowers et al, 2006 Finland 1985– 2002
M 53–62 410(CR) 227 (CC) 183 (RC)
28,983 ,18.5 (Q1) (CRC)
.30.0 (Q4) (CRC)
1.66 (1.27–2.18) (CRC) 1.78 (1.25–2.55) (CC) 1.51 (0.99–2.29) (RC)
NR 6 Age, smoking
Ahmed et al, 2006 United States 1987–2000
F/M 45–64 194 (CRC) 87 (CRC) (F) 107 (CRC) (M)
14,109 ,25.0 (CRC) (F/M)
$35.0 (CRC) (F/M)
,23.4 (CRC) (F)
$31.3 (CRC) (F)
,24.7 (CRC) (M)
$29.8 (CRC) (M)
1.54 (0.9–2.8) (CRC) (F/M) 1.26 (0.6–2.6) (CRC) (F) 1.52 (0.9–2.7) (CRC) (M)
NR 8 Age, sex, family history of CRC, physical activity, NSAID use, aspirin use, smoking, alcohol consumption, and HRT use
Rapp et al, 2005 Austria 1985– 2001
F/M 18–93 271 (CC) (F) 133 (RC) (F) 260 (CC) (M) 138 (RC) (M)
145,931 (F/M) 78,484 (F) 67,447 (M)
18.5–24.9 (Q1) (CRC)
$35.0 (Q4) (CRC)
0.88 (0.43–1.81) (CC) (F) 0.96 (0.38–2.39) (RC) (F) 2.48 (1.15–5.39) (CC) (M) 1.66 (1.01–2.73) (RC) (M)
NR 7 Age, smoking, occupational group
Obesity
and
Risk
of
Colorec
tal
Cancer
ONE
|
www.ploson
e.org
6
January
2013
|
Volume
8
|
Issue
1
|
Table 1.
Cont.
Source
Location
/Period Sex
Range of age
No. of Cases (Cancer Type)
No. of Participants
Measure/Range
of BMI (kg/m2) RR (95% CI) Per N-unitIncrease, RR (95% CI) StudyQualitya Adjustment for Covariates
Otani et al, 2005 Japan 1990–2001 F/M 40–69 986 (CRC) 360 (CRC) (F) 229 (CC) (F) 131 (RC) (F) 626 (CRC) (M) 424 (CC) (M) 202 (RC) (M)
102,949 (F/M) 53,791 (F) 49,158 (M)
,25.0 (Q1) (CRC)
$30.0 (Q4) (CRC)
0.8 (0.4–1.5) (CRC) (F) 0.5 (0.2–1.4) (CC) (F) 0.5 (0.1–2.1) (PC) (F) 0.6 (0.1–2.5) (DC) (F) 1.3 (0.5–3.1) (RC) (F) 1.5 (0.9–2.5) (CRC) (M) 1.4 (0.7–2.8) (CC) (M) 1.8 (0.7–5.0) (PC) (M) 1.3 (0.5–3.2) (DC) (M) 1.6 (0.6–3.9) (RC) (M)
NR 8 Age, Public Health Center areas, smoking, alcohol consumption, miso soup intake, refraining from salty foods and animal fats
Oh et al, 2005 Korea 1992–2001 M $20 953 (CC) (M) 1,563 (RC) (M)
781,283 18.5–22.9 (Q2) (CRC)
$30.0 (Q6) (CRC)
1.92 (1.15–3.22) (CC) 1.08 (0.56–2.10) (RC)
NR 8 Age, smoking, alcohol
consumption, physical activity, family history of cancer, and residency area at baseline
Kuriyama et al, 2005
Japan/1984–1992 F/M $40 270 (CRC) (F/M) 115 (CRC) (F) 72 (CC) (F) 42 (RC) (F) 155 (CRC) (M) 88 (CC) (M) 67 (RC) (M)
27,539 (F/M) 15,054 (F) 12,485 (M)
18.5–24.9 (Q1) (CRC)
$30.0 (Q4) (CRC)
2.06 (1.03–4.13) (CRC) (F) 2.25 (0.95–5.33) (CC) (F) 1.03 (0.13–8.01) (PC) (F) 2.86 (0.98–8.37) (DC) (F) 1.21 (0.29–5.14) (RC) (F) 1.78 (0.73–4.38) (CRC) (M) 1.30 (0.32–5.37) (CC) (M) 1.71 (0.23–12.92) (PC) (M) 1.41 (0.19–10.52) (DC) (M) 2.41 (0.74–7.85) (RC) (M)
NR 8 Age, smoking, alcohol
consumption, red meat intake, consumption of fish, fruits, vegetables, bean-paste soup, type of health insurance, menopausal status, parity, age at menarche, age at end of first pregnancy
Engeland et al, 2005
Norway 1963– 2001
F/M 20–74 47,117 (CRC) 24,130 (CRC) (F) 16,638 (CC) (F) 7,492 (RC) (F) 22,987 (CRC) (M) 13,805 (CC) (M) 9,182 (RC) (M)
1,037,077 (F) 962,901 (M)
18.5–24.9 (Q2) (CRC)
$30.0 (Q4) (CRC)
1.06 (1.02–1.10) (CRC) (F) 1.07 (1.02–1.12) (CC) (F) 1.04 (0.97–1.11) (RC) (F) 1.40 (1.32–1.48) (CRC) (M) 1.49 (1.39–1.60) (CC) (M) 1.27 (1.16–1.38) (RC) (M)
NR 6 Age
Wei et al, 2004 United States 1980–2000
F/M 30–75 1139 (CC) (F/M) 339 (RC) (F/M) 671 (CC) (F) 204 (RC) (F) 452 (CC) (M) 132 (RC) (M)
87,733 (CRC) (F) 46,632 (CRC) (M)
,23.0 (Q1) (CRC)
.30.0 (Q4) (CRC)
1.39 (1.14–1.69) (CC) (F/M) 1.40 (0.96–2.03) (RC) (F/M) 1.28 (1.10–1.62) (CC) (F) 1.56 (1.01–2.42) (RC) (F) 1.85 (1.26–2.72) (CC) (M) 1.03 (0.49–2.14) (RC) (M)
Per 5-unit,
1.06 (1.03–1.10) (CRC)
8 Age, family history of CRC, physical activity, red meat intake, alcohol consumption, calcium, folate, height, smoking, history of endoscopy and gender in combined cohort
Moore et al,2004 United States 1948–1999
F/M 30–54 157 (CC) (F/M) 86 (CC) (F) 71 (CC) (M)
3764 (Younger) 18.5–25 (T1) (CC)
$30 (T3) (CC)
1.5 (0.92–2.5) (CC) (F/M) 1.6 (0.90–3.0) (PC) (F/M) 1.4 (0.55–3.6) (DC) (F/M) 1.3 (0.65–2.7) (CC) (F) 2.0 (0.98–4.2) (CC) (M)
NR 8 Age, sex, education, height, alcohol consumption, smoking, and physical activity
Moore et al, 2004 United States 1948–1999
F/M 55–79 149 (CC) (F/M) 80 (CC) (F) 69 (CC) (M)
3802 (Older) 18.5–25.0 (T1) (CC)
$30.0 (T3) (CC)
2.4 (1.5–3.9) (CC) (F/M) 2.9 (1.6–5.2) (PC) (F/M) 1.8 (0.75–4.3) (DC) (F/M) 1.9 (0.98–3.5) (CC) (F) 3.7 (1.7–8.1) (CC) (M)
NR 8 Age, sex, education, height, alcohol consumption, smoking, physical activity
Obesity
and
Risk
of
Colorec
tal
Cancer
PLOS
ONE
|
www.ploson
e.org
7
January
2013
|
Volume
8
|
Issue
1
|
Table 1.
Cont.
Source
Location
/Period Sex
Range of age
No. of Cases (Cancer Type)
No. of Participants
Measure/Range
of BMI (kg/m2) RR (95% CI) Per N-unitIncrease, RR (95% CI) StudyQualitya Adjustment for Covariates
MacInnis et al, 2004
Australia 1991–2002
M 27–75 153 (CC) 17,049 ,24.8 (Q1) (CC)
.29.2 (Q4) (CC)
1.70 (1.10–2.80) (CC) Per 5-unit, 1.29 (1.04–1.60) (CC)
7 Age, country of birth, and education
Lin et al, 2004 United States From 1993, average follow-up: 8.7 years
F $45 158 (CC) 39,876 ,23.0 (Q1) (CRC)
$30.0 (Q5) (CRC)
1.67 (1.08–2.59) (CRC) 1.73 (1.05–2.85) (CC) 2.59 (1.34–5.01) (PC) 0.93 (0.41–2.14) (DC) 1.55 (0.64–3.77) (RC)
NR 8 Age, randomized treatment assignment, family history of CRC, history of colon polyps, physical activity, smoking, baseline aspirin use, red meat intake, alcohol consumption, menopausal status and baseline postmenopausal hormone therapy use
Shimizu et al, 2003 Japan 1993–2000 F/M $35 134 (CRC) (F) 89 (CC) (F) 41 (RC) (F) 161 (CRC) (M) 104 (CC) (M) 58 (RC) (M)
29,051 (F/M) 15,659 (F) 13,392 (M)
#21.2 (T1) (CRC)
$23.6 (T3) (CRC)
1.22 (0.69–2.15) (CC) (F) 0.83 (0.35–1.99) (RC) (F) 2.11 (1.26–3.53) (CC) (M) 0.83 (0.42–1.64) (RC) (M)
NR 7 Age, height, alcohol consumption, smoking, education, physical activity
Terry et al, 2002 Canada 1980– 1993
F 40–59 527 (CRC) 363 (CC) 164 (RC)
89,835 ,25.0(T1) (CRC)
$30 (T3) (CRC)
1.08 (0.82–1.41) (CRC) 0.95 (0.67–1.34) (CC) 0.81 (0.48–1.38) (PC) 1.31 (0.79–2.16) (DC) 1.35 (0.87–2.07) (RC)
NR 7 Age, smoking, education, physical activity, oral contraceptive use, HRT, and parity
Terry et al, 2001 Sweden 1987– 1998
F 40–76 460 (CRC) 291 (CC) 118 (PC) 101 (DC) 159 (RC)
61,463 ,22.0 (Q1) (CRC)
.26.7 (Q4) (CRC)
1.24 (0.95–1.62) (CRC) 1.21 (0.86–1.70) (CC) 1.13 (0.66–1.94) (PC) 1.21 (0.67–2.19) (DC) 1.32 (0.83–2.08) (RC)
NR 8 Age, education, quartiles of intakes of energy, alcohol, red meat intake, total fat, folate, vitamin D, vitamin C and calcium
Kaaks et al, 2000 United States 1985–1998
F 35–65 100 (CRC) 73 (CC)
14,275 Q1 (CRC) Q5 (CRC)
2.83 (1.23–6.54) (CRC) 3.07 (1.12–8.41) (CC)
NR 8 Age, menopausal status, day of menstrual cycle, and time of last food consumption, smoking
Schoen et al, 1999 United States 1989–1996
F/M $65 102 (CRC) 5,849 14.6–23.2 (Q1) (F) 29.61–58.8 (Q4) (F) 15.6–23.9 (Q1) (M) 28.51–46.2 (Q4) (M)
1.4 (0.8–2.5) (CRC) (F/M) Per 1-unit,
1.1 (0.9–1.3) (CRC) (F/M)
6 Age, sex, and physical activity
Ford et al, 1999 United States 1971–1992
F/M 25–74 222 (CC) (F/M) 118 (CC) (F) 104 (CC) (M)
13,420 (F/M) 7,914 (F) 5,506 (M)
,22.0 (CC) (Q1)
$30 (CC) (Q6)
2.79 (1.22–6.35) (CC) (F/M) 2.74 (1.04–7.25) (CC) (F) 2.95 (0.99–8.74) (CC) (M)
NR 8 Age, sex, race, education, smoking, serum cholesterol concentration, recreational exercise, physical activity, and alcohol consumption
Singh et al, 1998 United States 1976–1982
F/M $25 83 (CC) (F) 59 (CC) (M)
32,051 ,22.5(T1) (CC)
.25.6(T3) (CC)
1.33(0.88–2.06) (CC) (F/M) 1.05(0.63–1.75) (CC) (F) 2.63(1.12–6.13) (CC) (M)
NR 7 Age, sex, and family history of CRC
Chyou et al, 1996 United States 1965–1995
M $45 330 (CC) (M) 123 (RC) (M)
7,945 ,21.7 (Q1) (CRC)
$25.8 (Q4) (CRC)
1.38 (1.01–1.90) (CC) 0.63 (0.38–1.04) (RC)
Per 1-unit,
1.06 (1.03–1.10) (CRC)
6 Age
Obesity
and
Risk
of
Colorec
tal
Cancer
ONE
|
www.ploson
e.org
8
January
2013
|
Volume
8
|
Issue
1
|
Discussion
The present meta-analysis summarizes the results of prospective
studies, including 41 studies [7,8,9,10,11,12,13,14,15,16,17,18,
19,20,21,22,23,24,25,26,27,28,29,30,31,32,33,34,35,36,37,38,39,
40,41,42,43,44,45,46,47] on BMI levels with a total of 85, 935
cases
and
including
13
studies
[7,12,17,22,23,24,26,28,
35,36,42,45,47] on WC levels with a total of 6,546 cases. The
results indicated that higher BMI and WC levels were positively
associated with CRC risk. Analyses stratified by the anatomical site
suggested that both of higher BMI and WC levels caused an equal
increasing risk for colon cancer and rectal cancer. When the
analysis was stratified by proximal colon and distal colon, the
results showed that there was a strong risk for proximal colon
cancer or distal colon cancer higher with high BMI or WC levels.
Stratifying by geographic region, the results revealed that higher
BMI and WC levels were positively associated with CRC risk in
United States, Europe, Asia, or Australia. In additon, when the
analysis was stratified by sex and anatomical site, the results
showed that there was an increased risk of CRC development
associated with higher BMI and WC levels for male or female.
Obesity is considered one important risk factor for many types
of solid cancers, especially for CRC [56]. Previous reviews have
indicated that obesity is associated with 7% to 60% greater risk of
CRC compared with normal weight individuals [3,57]. However,
the mechanisms that might underlie the association between excess
weight and CRC remain unclear. Currently, several possibilities
have been hypothesized. Two hormonal systems – the insulin/
insulin-like growth factor (IGF) axis and adipokines (adiponectin
and leptin) – are the most studied candidates. First, the
involvement of insulin and IGF-1 in colorectal carcinogenesis
has been supported by experimental and clinical studies [58].
Circulating total IGF-I, a major determinant of free IGF-I
concentrations, is associated with increased risk of colorectal
advanced adenomas and cancer [59,60]. The main reason is that
increased free IGF-I with concomitant changes of environment
mitogenesis and anti-apoptosis in the cellular favouring tumour
formation [61]. Moreover, there is an increased risk of CRC
development associated with type 2 diabetes [62]. Second,
previous studies have demonstrated that the fat itself can also
influence CRC risk [63]. Adipocytes and preadipocytes could
promote proliferation of CRC cells [64]. Fatty acid synthase
over-expression has been shown to be associated with CRC phenotype
[65]. Adipokines such as adiponectin, leptin are also associated
with the risk of CRC. Adiponectin as an insulin-sensitizing agent
and a negative regulator of angiogenesis is secreted mainly from
visceral adipose tissue, which could inhibit CRC growth in animal
models, and its circulating concentrations was associated with
CRC risk in clinical trials [66]. Leptin could also favour CRC
growth in vivo and in vitro experiment as a pleiotrophic hormone
being mitogenic, anti-apoptotic, pro-angiogenic, and
proinflam-matory in various cellular systems [67]. The relationship between
circulating leptin concentrations and CRC risk have been
demonstrated [68]. Following those finding, the association
between obese and the risk of CRC has been assessed in several
prospective cohort studies, with most studies showing a statistically
significant positive association.
Meta-analysis is an important tool for revealing trends that
might not be apparent in a single study. Pooling of independent
but similar studies increases precision and therefore increases the
confidence level of the findings [69]. The current meta-analysis
had some advantages. First, the number of total cases were
substantial, which significantly increased the statistical power of
the analysis. Second, our quantitative assessment was based on
Table
1.
Cont.
Source Location /Period Sex Range of age No. of Cases (Cancer Type) No. of Participants Measure/Range of BMI (kg/m 2) RR (95% CI) Per N-unit Increase, RR (95% CI) Study Quality a Adjustment for Covariates Bostick et al, 1994 United States 1986–1990 F 5 5–69 212 (CC) (F) 35,215 (F) , 22.9 (Q1) (CC) . 30.6 (Q5) (CC) 1.41 (0.90–2.23) (CC) NR 8 Age, e nergy intake, height, parity, total vitamin E intake, a total vitamin E by age interaction term, and vitamin A supplement intake Lee et al, 1992 United States 1962–1988 M NA 2 90 (CC) 17,595 , 22.5 (Q1) (CC) z26.0 (Q5) (CC) 1.0 1.52 (1.06–2.17) (CC) Per 1 -unit, 1.08 (1.04–1.13) (CC) 7 Age, physical activity, and family history of cancer Abbreviations: BMI, body mass index; CRC, colorectal cancer; CC, colon cancer; RC, rectal cancer; DCC, distal colon cancer; PCC, proximal colon canc er; F, female; M, male; T, tertile; Q, quartile/quintile; HRT, hormone replacement therapy; NR, not report. aStudy quality was judged b ased on the N ewcastle-Ottawa Scale (range, 1 –9 stars). doi:10.1371/journal.pone. 0053916.t001Obesity and Risk of Colorectal Cancer
Table 2.
Characteristics of prospective studies on the association between central obesity [measured using waist circumference (WC)] and risk of colorectal cancer.
Source
Location/
Period Sex Age
No. of Cases (Cancer Type)
No. of Participants
Measure/Range of waist circumstance
(cm) RR (95% CI)
Per N-unit Increase, RR (95% CI)
Study
Qualitya Adjustment for Covariates
Park et al, 2011
United Kingdom 1993–1997
F/M 40–79 197 (CRC) (F) 160 (CRC) (M)
24,244 (F/M) 13078 (F) 11166 (M)
,88.0 (Q1) (CRC)
$103.3 (Q5) (CRC)
1.65 (0.97–2.86) (CRC) (F) 0.86 (0.55–1.36) (CRC) (M)
Per 10-unit 1.41 (1.06–1.87) (CRC) (F)
1.06 (0.77–1.46) (CRC) (M)
8 Age, sex, smoking, alcohol consumption, education, exercise, family history of CRC, energy intake, folate, fibre, total meat and processed meat intakes, height
Oxentenko et al, 2010
United States 1986–2005
F 55–69 1,464 (CRC) 36,941 #77.15 (Q1) (CRC)
$96.53 (Q4) (CRC)
1.32 (1.11–1.56) (CRC) NR 8 Age, exogenous estrogen use, oral contraceptive use, smoking, physical activity level, selfreported diabetes mellitus, total energy intake, total fat, red meat, fruits and vegetables, calcium, folate, vitamin E and alcohol consumption
Wang et al, 2008
US 1997–2005
F/M .45 953 (CRC) 407 (CRC) (F) 546 (CRC) (M)
95,151 (F/M) 51,083 (F) 44,068 (M)
,85.0 (Q1) (CRC) (F)
$110.0 (Q4) (CRC) (F)
,95.0 (Q1) (CRC) (M)
$120.0 (Q4) (CRC) (M)
1.75 (1.20–2.54) (CRC) (F) 1.54 (1.00–2.37) (CC) (F) 2.65 (1.23–5.71) (RC) (F) 1.68 (1.12–2.53) (CRC) (M) 2.05 (1.29–3.25) (CC) (M) 1.02 (0.43–2.42) (RC) (M)
NR 8 Height, education, physical activity, smoking, alcohol consumption, NSAID use, multivitamin use, and history of colorectal endoscopy, HRT use
Pischon et al, 2006
Europe 1992–2000
F/M 25–70 1,570 (CRC) 56 2 (CC) (F) 418 (CC) (M) 291 (RC) (F) 293 (RC) (M)
238,546 (F) 129,731 (M)
,70.2 (Q1) (CRC) (F)
$89.0 (Q5) (CRC) (F)
,86.0 (Q1) (CRC) (M)
$103.0 (Q5) (CRC)(M)
1.48 (1.08–2.03) (CC) (F) 1.23 (0.81–1.86) (RC) (F) 1.39 (1.01–1.93) (CC) (M) 1.27 (0.84–1.91) (RC) (M)
Per 5-unit,
1.07(1.03–1.12) (CC) (F) 1.10(1.05–1.56) (CC) (M) NR (RC)
8 Smoking, education, alcohol consumption, physical activity, red and processed meat intake, fish and shellfish, fiber, fruits and vegetables
MacInnis et al, 2006
Australia 1990–2003
F 40–69 212 (CC) 24,072 ,80.0 (T1) (CC)
$88.0 (T3) (CC)
1.4 (1.0–1.9) (CC) Per 10-unit 1.14 (1.02–1.28) (CC)
7 country of birth, highest level of education and HRT use
MacInnis et al, 2006
Australia 1990–2003
F/M 27–75 229 (RC) 24,247 (F) 16,867 (M)
,80.0 (T1) (RC) (F)
$88.0 (T3) (RC) (F)
,94.0 (T1) (RC) (M)
$102.0 (T3) (RC) (M)
1.4 (1.0–1.9) (RC) (F/M) 1.4 (0.8–2.2) (RC) (F) 1.4 (0.9–2.2) (RC) (M)
Per 10-unit 1.12(0.99–1.27) (RC) (F/M)
1.10 (0.93–1.30) (RC) (F) 1.15 (0.97–1.36) (RC) (M)
7 Age, sex, and country of birth
Larsson et al, 2006
Sweden 1997–2005
M 45–79 407 (CRC) 252 (CC) 110 (PC) 112 (DC) 180 (RC)
45,906 ,88.0 (Q1) (CRC)
$104.0 (Q5) (CRC)
1.29 (0.90–1.85) (CRC) 1.44 (0.93–2.24) (CC) 1.66 (0.84–3.27) (PC) 1.62 (0.80–3.27) (DC) 1.24 (0.68–2.25) (RC)
NR 7 Age, education, family history of colorectal cancer, history of diabetes, smoking, aspirin use, and leisure-time physical activity
Ahmed et al, 2006
United States 1987–2000
F/M 45–64 194 (CRC) 87 (CRC) (F) 107 (CRC) (M)
14,109 ,88.0 (Low) (F) (CRC)
$88.0 (High) (F)) (CRC)
,102 (Low) (M) (CRC) 102 (High) (M) (CRC)
1.40 (1.0–1.9) (CRC) (F/M) NR 8 Age, gender, family history of colorectal cancer, physical activity, NSAID use, aspirin use, smoking, alcohol consumption, current HRT use
Moore et al, 2004
United States 1948–1999
F/M 30–54 157 (CC) (F/M) 86 (CC) (F) 71 (CC) (M)
3,764 (Younger)
,81.3 (Q1) (F)
$99.1 (Q4) (F)
,83.8 (Q1) (M)
$101.6 (Q4) (M)
2.0 (1.1–3.7) (CC) (F/M) 1.7 (0.82–3.7) (PC) (F/M) 2.6 (0.87–7.6) (DC) (F/M) 1.8 (0.78–4.3) (CC) (F) 2.4 (0.99–5.7) (CC) (M)
Table 2.
Cont.
Source
Location/
Period Sex Age
No. of Cases (Cancer Type)
No. of Participants
Measure/Range of waist circumstance
(cm) RR (95% CI)
Per N-unit Increase, RR (95% CI)
Study
Qualitya Adjustment for Covariates
Moore et al,2004 United States 1948–1999
F/M 55–79 149(CC) (F/M) 80(CC) (F) 69(CC) (M)
3,802 (Older) ,81.3 (Q1) (F)
$99.1 (Q4) (F)
,83.8 (Q1) (M)
$101.6 (Q4) (M)
2.6 (1.3–5.2) (CC) (F/M) 3.1 (1.3–7.9) (PC) (F/M) 1.9 (0.65–5.4) (DC) (F/M) 2.3 (0.86–6.3) (CC) (F) 3.3 (1.3–8.8) (CC) (M)
NR 8 Sex, education, age, height, alcohol consumption, smoking, and physical activity
MacInnis et al, 2004
Australia 1991–2002
M 27–75 153 (CC) (M) 17,049 ,87.0 (Q1) (CC)
.99.3 (Q4) (CC)
2.1 (1.3–3.5) (CC) Per 10-unit, 1.37 (1.18–1.60) (CC)
7 Age at attendance, country of birth, and education
Schoen et al, 1999
United States 1989–1996
F/M $65 102 (CRC) 5,849 32.5–82.0 (Q1) (F) 101.2–167 (Q4) (F) 69.0–91.0 (Q1) (M) 104.1–145.5 (Q4) (M)
2.2 (1.2–4.1) (CRC) NR 6 Age, sex, and physical activity
Martinez et al, 1997
United States 1986–1992
F 30–55 396 (CC) 159 (PC) 185 (DC)
89,448 (F) ,27.5 in. (Low)
.34.0 in. (High)
1.48 (0.89–2.46) (CC) NR 8 Age, smoking, family history of CRC, physical activity, postmenopausal hormone use, aspirin use, red meat intake, and alcohol consumption
Giovannucci et al,1995
United States 1987–1992
M 40–75 203 (CC) 47,723 (M) ,35.0 in. (Q1)
$43 in. (Q5)
2.56 (1.33–4.96) (CC) NR 8 Age, smoking, history of endoscopic screening, previous polyp diagnosis, parental history of CRC, physical activity, aspirin use, intake of folate, methione, alcohol, dietary fiber, total energy, and red meat
Abbreviations: WC, waist circumference; CRC, colorectal cancer; CC, colon cancer; RC, rectal cancer; DCC, distal colon cancer; PCC, proximal colon cancer; F, female; M, male; T, tertile; Q, quartile/quintile; HRT, hormone replacement therapy; NR, not report.
aStudy quality was judged based on the Newcastle-Ottawa Scale (range, 1–9 stars).
doi:10.1371/journal.pone.0053916.t002
Obesity
and
Risk
of
Colorec
tal
Cancer
PLOS
ONE
|
www.ploson
e.org
11
January
2013
|
Volume
8
|
Issue
1
|
prospective studies, which will minimize the possibility that our
results were due to recall or selection bias. Third, the majority of
the studies included in the meta-analysis evaluated multiple
confounders including dietary pattern, physical activity, alcohol
drinking, smoking, and other factors. The relationships between
BMI/WC and CRC risk in each study were derived after
adjustment at least for age. The pooled estimate was stable and
robust after comprehensive sensitivity analyses. We evaluated the
quality of the eligible studies with the Newcastle Ottawa scale, the
assessment included selection of populations, comparability of
cohorts and ascertainment of outcome. The studies included in
our current article were considered as high quality because the
total score of the studies ranged from 6–9. Finally, the large
number of studies describe the detailed data of subgroup analyses,
permitted us to better understand the effect of obese on various
subgroups.
In spite of these advantages, some limitations of the present
meta-analysis should be acknowledged. First, The variations in the
BMI and WC categories between studies is a source of
heterogeneity, and this may possibly lead to less accurate estimates
of risk. Second, the current meta-analysis is unable to solve
problems with confounding factors that could be inherent in the
included studies. Inadequate participants of the confounders might
bias the results in either direction toward exaggeration or
Figure 2. Adjusted relative risks of colorectal cancer for the obese vs. normal category of BMI.The size of each square is proportional to the weight of the study (inverse of variance). CI, confidence interval; BMI, body mass index; C, colon cancer; R, rectal cancer; F, female; M, male. doi:10.1371/journal.pone.0053916.g002Figure 3. Adjusted relative risks of colorectal cancer for the highest vs. lowest categories of WC.The size of each square is proportional to the weight of the study (inverse of variance). CI: confidence interval; WC, waist circumference; C, colon cancer; R, rectal cancer; F, female; M, male. doi:10.1371/journal.pone.0053916.g003
Obesity and Risk of Colorectal Cancer
Figure 4. Begg’s funnel plot for Identification of publication bias in all studies for the obese vs. normal category of BMI and risk of colorectal cancer.
doi:10.1371/journal.pone.0053916.g004
Table 3.
The association between general obesity or central obesity and the risk of colorectal cancer stratifying analysis by
geographic region, anatomical subsite, and sex.
BMI WC
RR (95% CI) Heterogeneity (P-value, I2) RR (95% CI) Heterogeneity (P-value, I2)
Anatomical subsite
Colorectal cancer 1.334 (1.253–1.420) ,0.001, 68.9% 1.455 (1.327–1.596) 0.323, 10.8%
Colon cancer 1.470 (1.348–1.602) ,0.001, 71.3% 1.613 (1.417–1.837) 0.573, 0.0%
Proximal colon cancer 1.296 (1.109–1.514) 0.058, 40.5% 1.873 (1.118–3.136) 0.773, 0.0%
Distal colon cancer 1.367 (1.164–1.605) 0.798, 0.0% 1.942 (1.250–3.017) 0.507, 0.0%
Rectal cancer 1.149 (1.099–1.201) 0.048, 29.3% 1.349 (1.114–1.634) 0.582, 0.0%
Geographic region
US 1.465 (1.325–1.619) 0.052, 34.8% 1.612 (1.379–1.885) 0.227, 24.3%
Europe 1.250 (1.149–1.360) ,0.001, 77.5% 1.368 (1.215–1.541) 0.520, 0.0%
Asia 1.351 (1.181–1.546) 0.165, 25.1% NR NR
Australia 1.203 (1.003–1.445) 0.350, 10.3% 1.506 (1.216–1.865) 0.345, 6.0%
Sex
Colorectal cancer
Men 1.467 (1.363–1.579) 0.043, 31.9% 1.477 (1.300–1.677) 0.135, 30.2%
Women 1.153 (1.078–1,234) 0.026, 37.2% 1.442 (1.296–1.604) 0.834, 0.0%
Colon cancer
Men 1.547 (1.467–1.632) 0.585, 0.0% 1.812 (1.464–2.242) 0.308, 15.9%
Women 1.228 (1.097–1.374) 0.014, 46.4% 1.498 (1.253–1.791) 0.955, 0.0%
Rectal cancer
Men 1.238 (1.112–1.378) 0.154, 25.1% 1.281 (0.990–1.657) 0.934, 0.0%
Women 1.070 (1.006–1.138) 0.727, 0.0% 1.495 (1.025–2.181) 0.224, 33.1%
Abbreviations:BMI, body mass index; WC, waist circumference; CI, confidence interval; HR, hazard ratio; NR, not reported. doi:10.1371/journal.pone.0053916.t003
underestimation of risk estimates. Although most studies adjusted
for other known risk factors for CRC, unknown confounders
cannot be excluded as a potential explanation for the observed
findings. Third, significant heterogeneity was observed across
studies, which would throw some doubt on the reliability of the
summary RR estimates. This significant heterogeneity might exist
in terms of study design, demographics of participants,
ascertain-ment of anthropometry, duration of follow-ups, and confounders.
We are unable to account for these differences, despite the use of
appropriate meta-analytic techniques with random-effect models.
Moreover, by conducting stratified analysis, we found that the risk
estimates of BMI/WC and the risk of CRC were robust and stable
across various study characteristics. Finally, potential publication
bias is impossible to be completely excluded because small studies
with null results tend not to be published.
In summary, the results from this meta-analysis of prospective
studies demonstrate that BMI and WC levels are both positively
associated with risk of CRC. This positive association also exists in
both men and women, different geographic region, and different
anatomical site. However, available data are still sparse, and
in-depth analyses of the assessed associations in the context of
additional longitudinal studies are highly desirable to enable
more-precise estimates and a better understanding of the role of obesity
in CRC carcinogenesis. The findings from these observational
studies need to be confirmed in large randomized clinical trials in
the future.
Supporting Information
Checklist S1
PRISMA 2009 Checklist.
(DOC)
Diagram S1
PRISMA 2009 Flow Diagram.
(DOC)
Author Contributions
Conceived and designed the experiments: YLM YZY HLQ. Performed the experiments: YZY FW. Analyzed the data: YZY PZ CZS YZ. Contributed reagents/materials/analysis tools: YZY PZ CZS YZ. Wrote the paper: YZY HLQ YLM.
References
1. Jemal A, Siegel R, Ward E, Hao Y, Xu J, et al. (2008) Cancer statistics, 2008. CA Cancer J Clin 58: 71–96.
2. Sung JJ, Lau JY, Goh KL, Leung WK (2005) Increasing incidence of colorectal cancer in Asia: implications for screening. Lancet Oncol 6: 871–876. 3. Bianchini F, Kaaks R, Vainio H (2002) Overweight, obesity, and cancer risk.
Lancet Oncol 3: 565–574.
4. Renehan AG, Tyson M, Egger M, Heller RF, Zwahlen M (2008) Body-mass index and incidence of cancer: a systematic review and meta-analysis of prospective observational studies. Lancet 371: 569–578.
5. Terry P, Giovannucci E, Michels KB, Bergkvist L, Hansen H, et al. (2001) Fruit, vegetables, dietary fiber, and risk of colorectal cancer. J Natl Cancer Inst 93: 525–533.
6. Parr CL, Batty GD, Lam TH, Barzi F, Fang X, et al. (2010) Body-mass index and cancer mortality in the Asia-Pacific Cohort Studies Collaboration: pooled analyses of 424,519 participants. Lancet Oncol 11: 741–752.
7. Park JY, Mitrou PN, Keogh RH, Luben RN, Wareham NJ, et al. (2011) Self-reported and measured anthropometric data and risk of colorectal cancer in the EPIC-Norfolk study. Int J Obes (Lond).
8. Odegaard AO, Koh WP, Yu MC, Yuan JM (2011) Body mass index and risk of colorectal cancer in Chinese Singaporeans: the Singapore Chinese Health Study. Cancer 117: 3841–3849.
9. Matsuo K, Mizoue T, Tanaka K, Tsuji I, Sugawara Y, et al. (2011) Association between body mass index and the colorectal cancer risk in Japan: pooled analysis of population-based cohort studies in Japan. Ann Oncol.
10. Levi Z, Kark JD, Barchana M, Liphshitz I, Zavdi O, et al. (2011) Measured Body Mass Index in Adolescence and the Incidence of Colorectal Cancer in a Cohort of 1.1 Million Males. Cancer Epidemiol Biomarkers Prev.
11. Hughes LA, Simons CC, van den Brandt PA, Goldbohm RA, van Engeland M, et al. (2011) Body Size and Colorectal Cancer Risk After 16.3 Years of Follow-up: An Analysis From the Netherlands Cohort Study. Am J Epidemiol 174: 1127–1139.
Figure 5. Begg’s funnel plot for Identification of publication bias in all studies for the highest vs. lowest categories of WC and risk of colorectal cancer.
doi:10.1371/journal.pone.0053916.g005
Obesity and Risk of Colorectal Cancer
12. Oxentenko AS, Bardia A, Vierkant RA, Wang AH, Anderson KE, et al. (2010) Body size and incident colorectal cancer: a prospective study of older women. Cancer Prev Res (Phila) 3: 1608–1620.
13. Bassett JK, Severi G, English DR, Baglietto L, Krishnan K, et al. (2010) Body size, weight change, and risk of colon cancer. Cancer Epidemiol Biomarkers Prev 19: 2978–2986.
14. Wang Y, Jacobs EJ, Patel AV, Rodriguez C, McCullough ML, et al. (2008) A prospective study of waist circumference and body mass index in relation to colorectal cancer incidence. Cancer Causes Control 19: 783–792.
15. Thygesen LC, Gronbaek M, Johansen C, Fuchs CS, Willett WC, et al. (2008) Prospective weight change and colon cancer risk in male US health professionals. Int J Cancer 123: 1160–1165.
16. Rapp K, Klenk J, Ulmer H, Concin H, Diem G, et al. (2008) Weight change and cancer risk in a cohort of more than 65,000 adults in Austria. Ann Oncol 19: 641–648.
17. Wang Y, Jacobs EJ, Teras LR, Pavluck AL, Rodriguez C, et al. (2007) Lack of evidence for effect modification by estrogen of association between body mass index and colorectal cancer risk among postmenopausal women. Cancer Causes Control 18: 793–799.
18. Reeves GK, Pirie K, Beral V, Green J, Spencer E, et al. (2007) Cancer incidence and mortality in relation to body mass index in the Million Women Study: cohort study. BMJ 335: 1134.
19. Lundqvist E, Kaprio J, Verkasalo PK, Pukkala E, Koskenvuo M, et al. (2007) Co-twin control and cohort analyses of body mass index and height in relation to breast, prostate, ovarian, corpus uteri, colon and rectal cancer among Swedish and Finnish twins. Int J Cancer 121: 810–818.
20. Adams KF, Leitzmann MF, Albanes D, Kipnis V, Mouw T, et al. (2007) Body mass and colorectal cancer risk in the NIH-AARP cohort. Am J Epidemiol 166: 36–45.
21. Samanic C, Chow WH, Gridley G, Jarvholm B, Fraumeni JF Jr (2006) Relation of body mass index to cancer risk in 362,552 Swedish men. Cancer Causes Control 17: 901–909.
22. Pischon T, Lahmann PH, Boeing H, Friedenreich C, Norat T, et al. (2006) Body size and risk of colon and rectal cancer in the European Prospective Investigation Into Cancer and Nutrition (EPIC). J Natl Cancer Inst 98: 920–931. 23. MacInnis RJ, English DR, Hopper JL, Gertig DM, Haydon AM, et al. (2006) Body size and composition and colon cancer risk in women. Int J Cancer 118: 1496–1500.
24. MacInnis RJ, English DR, Haydon AM, Hopper JL, Gertig DM, et al. (2006) Body size and composition and risk of rectal cancer (Australia). Cancer Causes Control 17: 1291–1297.
25. Lukanova A, Bjor O, Kaaks R, Lenner P, Lindahl B, et al. (2006) Body mass index and cancer: results from the Northern Sweden Health and Disease Cohort. Int J Cancer 118: 458–466.
26. Larsson SC, Rutegard J, Bergkvist L, Wolk A (2006) Physical activity, obesity, and risk of colon and rectal cancer in a cohort of Swedish men. Eur J Cancer 42: 2590–2597.
27. Bowers K, Albanes D, Limburg P, Pietinen P, Taylor PR, et al. (2006) A prospective study of anthropometric and clinical measurements associated with insulin resistance syndrome and colorectal cancer in male smokers. Am J Epidemiol 164: 652–664.
28. Ahmed RL, Schmitz KH, Anderson KE, Rosamond WD, Folsom AR (2006) The metabolic syndrome and risk of incident colorectal cancer. Cancer 107: 28– 36.
29. Rapp K, Schroeder J, Klenk J, Stoehr S, Ulmer H, et al. (2005) Obesity and incidence of cancer: a large cohort study of over 145,000 adults in Austria. Br J Cancer 93: 1062–1067.
30. Otani T, Iwasaki M, Inoue M (2005) Body mass index, body height, and subsequent risk of colorectal cancer in middle-aged and elderly Japanese men and women: Japan public health center-based prospective study. Cancer Causes Control 16: 839–850.
31. Oh SW, Yoon YS, Shin SA (2005) Effects of excess weight on cancer incidences depending on cancer sites and histologic findings among men: Korea National Health Insurance Corporation Study. J Clin Oncol 23: 4742–4754. 32. Kuriyama S, Tsubono Y, Hozawa A, Shimazu T, Suzuki Y, et al. (2005) Obesity
and risk of cancer in Japan. Int J Cancer 113: 148–157.
33. Engeland A, Tretli S, Austad G, Bjorge T (2005) Height and body mass index in relation to colorectal and gallbladder cancer in two million Norwegian men and women. Cancer Causes Control 16: 987–996.
34. Wei EK, Giovannucci E, Wu K, Rosner B, Fuchs CS, et al. (2004) Comparison of risk factors for colon and rectal cancer. Int J Cancer 108: 433–442. 35. Moore LL, Bradlee ML, Singer MR, Splansky GL, Proctor MH, et al. (2004)
BMI and waist circumference as predictors of lifetime colon cancer risk in Framingham Study adults. Int J Obes Relat Metab Disord 28: 559–567. 36. MacInnis RJ, English DR, Hopper JL, Haydon AM, Gertig DM, et al. (2004)
Body size and composition and colon cancer risk in men. Cancer Epidemiol Biomarkers Prev 13: 553–559.
37. Lin J, Zhang SM, Cook NR, Rexrode KM, Lee IM, et al. (2004) Body mass index and risk of colorectal cancer in women (United States). Cancer Causes Control 15: 581–589.
38. Shimizu N, Nagata C, Shimizu H, Kametani M, Takeyama N, et al. (2003) Height, weight, and alcohol consumption in relation to the risk of colorectal cancer in Japan: a prospective study. Br J Cancer 88: 1038–1043.
39. Terry PD, Miller AB, Rohan TE (2002) Obesity and colorectal cancer risk in women. Gut 51: 191–194.
40. Terry P, Giovannucci E, Bergkvist L, Holmberg L, Wolk A (2001) Body weight and colorectal cancer risk in a cohort of Swedish women: relation varies by age and cancer site. Br J Cancer 85: 346–349.
41. Kaaks R, Toniolo P, Akhmedkhanov A, Lukanova A, Biessy C, et al. (2000) Serum C-peptide, insulin-like growth factor (IGF)-I, IGF-binding proteins, and colorectal cancer risk in women. J Natl Cancer Inst 92: 1592–1600. 42. Schoen RE, Tangen CM, Kuller LH, Burke GL, Cushman M, et al. (1999)
Increased blood glucose and insulin, body size, and incident colorectal cancer. J Natl Cancer Inst 91: 1147–1154.
43. Ford ES (1999) Body mass index and colon cancer in a national sample of adult US men and women. Am J Epidemiol 150: 390–398.
44. Singh PN, Fraser GE (1998) Dietary risk factors for colon cancer in a low-risk population. Am J Epidemiol 148: 761–774.
45. Martinez ME, Giovannucci E, Spiegelman D, Hunter DJ, Willett WC, et al. (1997) Leisure-time physical activity, body size, and colon cancer in women. Nurses’ Health Study Research Group. J Natl Cancer Inst 89: 948–955. 46. Chyou PH, Nomura AM, Stemmermann GN (1996) A prospective study of
colon and rectal cancer among Hawaii Japanese men. Ann Epidemiol 6: 276– 282.
47. Giovannucci E, Ascherio A, Rimm EB, Colditz GA, Stampfer MJ, et al. (1995) Physical activity, obesity, and risk for colon cancer and adenoma in men. Ann Intern Med 122: 327–334.
48. Bostick RM, Potter JD, Kushi LH, Sellers TA, Steinmetz KA, et al. (1994) Sugar, meat, and fat intake, and non-dietary risk factors for colon cancer incidence in Iowa women (United States). Cancer Causes Control 5: 38–52. 49. Lee IM, Paffenbarger RS Jr (1992) Quetelet’s index and risk of colon cancer in
college alumni. J Natl Cancer Inst 84: 1326–1331.
50. Moghaddam AA, Woodward M, Huxley R (2007) Obesity and risk of colorectal cancer: a meta-analysis of 31 studies with 70,000 events. Cancer Epidemiol Biomarkers Prev 16: 2533–2547.
51. Dai Z, Xu YC, Niu L (2007) Obesity and colorectal cancer risk: a meta-analysis of cohort studies. World J Gastroenterol 13: 4199–4206.
52. Stroup DF, Berlin JA, Morton SC, Olkin I, Williamson GD, et al. (2000) analysis of observational studies in epidemiology: a proposal for reporting. Meta-analysis Of Observational Studies in Epidemiology (MOOSE) group. JAMA 283: 2008–2012.
53. Stang A (2010) Critical evaluation of the Newcastle-Ottawa scale for the assessment of the quality of nonrandomized studies in meta-analyses. Eur J Epidemiol 25: 603–605.
54. Higgins JP, Thompson SG (2002) Quantifying heterogeneity in a meta-analysis. Stat Med 21: 1539–1558.
55. Egger M, Davey Smith G, Schneider M, Minder C (1997) Bias in meta-analysis detected by a simple, graphical test. BMJ 315: 629–634.
56. Ezzati M, Lopez AD, Rodgers A, Vander Hoorn S, Murray CJ (2002) Selected major risk factors and global and regional burden of disease. Lancet 360: 1347– 1360.
57. Bergstrom A, Pisani P, Tenet V, Wolk A, Adami HO (2001) Overweight as an avoidable cause of cancer in Europe. Int J Cancer 91: 421–430.
58. Clayton PE, Banerjee I, Murray PG, Renehan AG (2011) Growth hormone, the insulin-like growth factor axis, insulin and cancer risk. Nat Rev Endocrinol 7: 11–24.
59. Renehan AG, Painter JE, Atkin WS, Potten CS, Shalet SM, et al. (2001) High-risk colorectal adenomas and serum insulin-like growth factors. Br J Surg 88: 107–113.
60. Renehan AG, Zwahlen M, Minder C, O’Dwyer ST, Shalet SM, et al. (2004) Insulin-like growth factor (IGF)-I, IGF binding protein-3, and cancer risk: systematic review and meta-regression analysis. Lancet 363: 1346–1353. 61. Renehan AG, Frystyk J, Flyvbjerg A (2006) Obesity and cancer risk: the role of
the insulin-IGF axis. Trends Endocrinol Metab 17: 328–336.
62. Larsson SC, Orsini N, Wolk A (2005) Diabetes mellitus and risk of colorectal cancer: a meta-analysis. J Natl Cancer Inst 97: 1679–1687.
63. Chung YW, Han DS, Park YK, Son BK, Paik CH, et al. (2006) Association of obesity, serum glucose and lipids with the risk of advanced colorectal adenoma and cancer: a case-control study in Korea. Dig Liver Dis 38: 668–672. 64. Amemori S, Ootani A, Aoki S, Fujise T, Shimoda R, et al. (2007) Adipocytes
and preadipocytes promote the proliferation of colon cancer cells in vitro. Am J Physiol Gastrointest Liver Physiol 292: G923–929.
65. Ogino S, Kawasaki T, Ogawa A, Kirkner GJ, Loda M, et al. (2007) Fatty acid synthase overexpression in colorectal cancer is associated with microsatellite instability, independent of CpG island methylator phenotype. Hum Pathol 38: 842–849.
66. Renehan AG, Roberts DL, Dive C (2008) Obesity and cancer: pathophysio-logical and biopathophysio-logical mechanisms. Arch Physiol Biochem 114: 71–83. 67. Stattin P, Lukanova A, Biessy C, Soderberg S, Palmqvist R, et al. (2004) Obesity
and colon cancer: does leptin provide a link? Int J Cancer 109: 149–152. 68. Stattin P, Palmqvist R, Soderberg S, Biessy C, Ardnor B, et al. (2003) Plasma
leptin and colorectal cancer risk: a prospective study in Northern Sweden. Oncol Rep 10: 2015–2021.
69. Yin L, Grandi N, Raum E, Haug U, Arndt V, et al. (2009) Meta-analysis: longitudinal studies of serum vitamin D and colorectal cancer risk. Aliment Pharmacol Ther 30: 113–125.

![Table 1. Characteristics of prospective studies on the association between general obesity [measured using body mass index (BMI)] and risk of colorectal cancer](https://thumb-eu.123doks.com/thumbv2/123dok_br/0.193547/4.1186.98.1102.113.780/characteristics-prospective-studies-association-general-obesity-measured-colorectal.webp)


![Table 2. Characteristics of prospective studies on the association between central obesity [measured using waist circumference (WC)] and risk of colorectal cancer.](https://thumb-eu.123doks.com/thumbv2/123dok_br/0.193547/10.1186.95.1112.112.820/characteristics-prospective-studies-association-central-measured-circumference-colorectal.webp)