ACPD
9, 5087–5118, 2009Observational study of aerosol hygroscopic growth
factors
X. L. Pan et al.
Title Page
Abstract Introduction
Conclusions References
Tables Figures
◭ ◮
◭ ◮
Back Close
Full Screen / Esc
Printer-friendly Version
Interactive Discussion Atmos. Chem. Phys. Discuss., 9, 5087–5118, 2009
www.atmos-chem-phys-discuss.net/9/5087/2009/ © Author(s) 2009. This work is distributed under the Creative Commons Attribution 3.0 License.
Atmospheric Chemistry and Physics Discussions
This discussion paper is/has been under review for the journalAtmospheric Chemistry and Physics (ACP). Please refer to the corresponding final paper inACPif available.
Observational study of aerosol
hygroscopic growth factors over rural
area near Beijing mega-city
X. L. Pan1,2,3, P. Yan1, J. Tang1, J. Z. Ma1, Z. F. Wang2, and A. Gbaguidi2
1
Chinese Academy of Meteorological Science, China Meteorological Administration, Beijing, China
2
Nansen-Zhu International Research Centre, Institute of Atmospheric Physics, Chinese Academy of Sciences, Beijing, China
3
Graduate University of Chinese Academy of Sciences, Beijing, China
Received: 25 December 2008 – Accepted: 12 January 2009 – Published: 25 February 2009
Correspondence to: J. Tang (tangj@cams.cma.gov.cn)
ACPD
9, 5087–5118, 2009Observational study of aerosol hygroscopic growth
factors
X. L. Pan et al.
Title Page
Abstract Introduction
Conclusions References
Tables Figures
◭ ◮
◭ ◮
Back Close
Full Screen / Esc
Printer-friendly Version
Interactive Discussion
Abstract
We investigated aerosol hygroscopic growth property and its influence on scattering co-efficient using M9003 nephelometers in coupling with a relative humidity controlled inlet system at a rural site near Beijing mega-city (Jingjintang) from 24th April to15th May 2006. Inlet relative humidity was controlled in an increasing range of 40%–90% while
5
the aerosol hygroscopic growth factor,f(RH=80%), varied in a range of 1.07–2.35 dur-ing the measurement. Estimated periodic mean values of aerosol hygroscopic growth factors are 1.27–1.34, 1.17–1.23, 1.55–1.59 and 2.33–2.48 for clean, dust, urban pollu-tion and mixed pollupollu-tion periods respectively. An examinapollu-tion of chemical composipollu-tion of daily filter samples highlighted that aerosol hygroscopicity was generally enhanced
10
with the increasing ratio of ammonium sulfate (AS) to organic matter (OMC). Further-more, strong hygroscopic organic aerosols were observed on 11th (f(RH=80%)=2.23) and 15th (f(RH=80%)=2.21) of May with organic carbon proportions of PM2.1reaching 42.3% and 43.0% respectively. Back-trajectory analysis indicated that solar radiation and vertical convective movement along the air mass pathway might strongly influence
15
the hygroscopic properties of organic matter.
1 Introduction
Aerosol hygroscopic growth with increasing relative humidity (RH) may lead to dramatic changes in its mass concentration, size distribution and corresponding optical proper-ties (scattering coefficient, single scattering albedo, asymmetry factor etc.), which could
20
enhance the cooling effect of aerosols in the atmosphere by directly scattering more light radiation (Carrico et al., 1998; Kotchenruther and Hobbs, 1998; Carrico et al., 2000; Randles et al., 2004), or change cloud microphysical properties (Crumeyrolle et al., 2008) by serving as cloud condensation nuclei (CCN) (Houghton et al., 2001). To precisely evaluate the direct radiative forcing, light scattering coefficient (σsp) of aerosol
25
ACPD
9, 5087–5118, 2009Observational study of aerosol hygroscopic growth
factors
X. L. Pan et al.
Title Page
Abstract Introduction
Conclusions References
Tables Figures
◭ ◮
◭ ◮
Back Close
Full Screen / Esc
Printer-friendly Version
Interactive Discussion RH)/σsp(dry), have been investigated for decades through Integrating Nephelometers
equipped with humidity control devices in clean background regions, marine boundary layers, rural and urban areas (Kotchenruther et al., 1999; Malm and Day, 2001; Malm et al., 2005; Carrico et al., 2003; Kim et al., 2006; Magi and Hobbs, 2003). Previous stud-ies reported that different types of aerosol particles usually have distinct hygroscopic
5
growth properties (Kim et al., 2006; Cruz and Pandis, 2000). Hand and Malm (2006) indicated that the scattering coefficients of (NH4)2SO4and (NH4)HSO4aerosols could be enhanced by a factor of three when relative humidity is over 85%. Dust particles, dominant in coarse mode, are mostly insoluble withf(RH=80%) smaller than 1.1 (Li-Jones et al., 1998), but they could also be hygroscopic when coated by sulfate or other
10
soluble inorganic aerosols during transportation (Shi et al., 2008; Perry et al., 2004). During the period of Aerosol Characterization Experiment (ACE-Asia), dust particle’s hygroscopic factor off(RH=80%)=1.25 was observed in Ron Brown cruise (Carrico et al., 2003), and even as high as 2.0 in Korea (Kim et al., 2006). Combustion-emitted smoke organic matters and photochemically formed organic compounds, accounting
15
for a significant proportion of particulate aerosols, could be hygroscopic or hydropho-bic depending on the types of organics and their oxidation status in the atmosphere. Studies (Carrico et al., 2005) conducted in the Yosemite National Park indicated an inverse relationship between the organic carbon mass fraction of PM2.5 and the hy-groscopicity of aerosols. Researches carried out by Malm et al. (2005) in the same
20
location showed that f(85%<RH<90%) decreased from 2.0 to <1.2 as the ratio of organic carbon mass to (NH4)2SO4increased from 0.57 to 11.15. Nevertheless, inor-ganic aerosols’ hygroscopicity enhanced by orinor-ganic acids were also observed in some studies (Choi and Chan, 2002; Cruz and Pandis, 2000). Therefore, following the great temporal and spatial variations of aerosols’ hygroscopic growth properties, in situ and
25
laboratory investigations are needed.
coun-ACPD
9, 5087–5118, 2009Observational study of aerosol hygroscopic growth
factors
X. L. Pan et al.
Title Page
Abstract Introduction
Conclusions References
Tables Figures
◭ ◮
◭ ◮
Back Close
Full Screen / Esc
Printer-friendly Version
Interactive Discussion try become an important source of pollutants and aerosols production. Aerosols mass
concentrations and their optical properties must have changed to some extent. In such condition, providing insights into aerosols optical properties and its dependence on rel-ative humidity in some Chinese key regions seems to be an important scientific issue to better understand the relationships between aerosols and climate. Previously, studies
5
of Yan et al. (2008) at Shangdianzi (SDZ), a baseline air pollution monitoring station of North China, showed that thef(RH=80%) was 1.16 in clean air conditions and 1.34 during pollution episodes in winter time. Kim et al. (2006) obtained higher value of 2.75 during the ACE-Asia period. Experiment carried out in the Pearl River Delta (PRD) re-gion (Liu et al., 2007) also indicated the urban pollutants aerosols hygroscopic growth
10
factorf(RH=80%) of about 2.04 for Guangzhou.
The present analysis of the aerosol hygroscopic factorsf(RH) over the rural area in near Beijing Mega-city is based on an observational experiment performed from 25th April to 15th May, 2006. The main purpose of this study is to examine the effect of aerosol chemical composition on the hygroscopic growth and its scattering properties.
15
The relationship between the aerosols hygroscopicity and the air mass back-trajectory pathway will be also discussed.
2 Observational experiment
2.1 Site description and meteorology
Measurements of the hygroscopic properties of aerosol scattering coefficient and
20
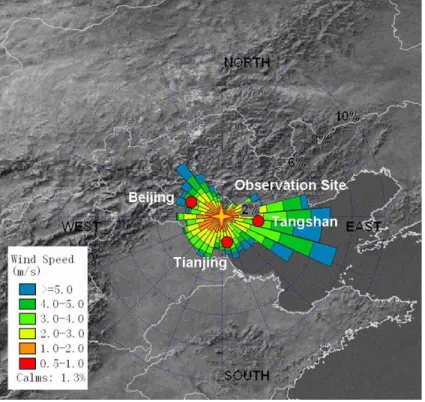
aerosol sampling were conducted at Xin’An weather operational station in Baodi county (referred simply as Xin’An site, 39◦44′N, 117◦17′E, altitude: 6 m) located in the rural
areas of Jing-Jin-Tang region (Fig. 1). Baodi is a major agricultural district of northern China, where rice and corn are cultivated. The principal human economical activities are farming and tree growing. The site which is about 85 km, 70 km and 105 km far from
25
ACPD
9, 5087–5118, 2009Observational study of aerosol hygroscopic growth
factors
X. L. Pan et al.
Title Page
Abstract Introduction
Conclusions References
Tables Figures
◭ ◮
◭ ◮
Back Close
Full Screen / Esc
Printer-friendly Version
Interactive Discussion pollution influence (seen Fig. 1). During the observation, meteorological condition was
characterized by clear and sunshiny days, except for the floating dust event at approx-imately 1600LST (Local Standard Time) 30th April. Air temperature average of the experimental period was 16.1◦, and relative humidity about 52.9%. The surface wind direction at the Xin’An site was dominated by NW wind and E wind, the wind speed
5
less than 5 m/s. .
2.2 Instrumentation and method
Aerosol scattering coefficient (σsp) was measured with M9003 integrating nephelome-ter at 525 nm wavelength with light integrating angle 10◦–170◦. The measurement
range of this instrument is 0–2000 Mm−1(1 Mm−1=10−6m−1) with its lower detection
10
limit of about 0.3 Mm−1 (lower than one tenth of Rayleigh scattering of air molecules). The increase of scattering coefficients of aerosols as a function of relative humid-ity is represented by the ratio of aerosol scattering coefficient at conditioned rela-tive humidity and that under the reference “dry” conditions (usually with RH less than 40%). This method was initially introduced by Covert et al. (1972). In
mea-15
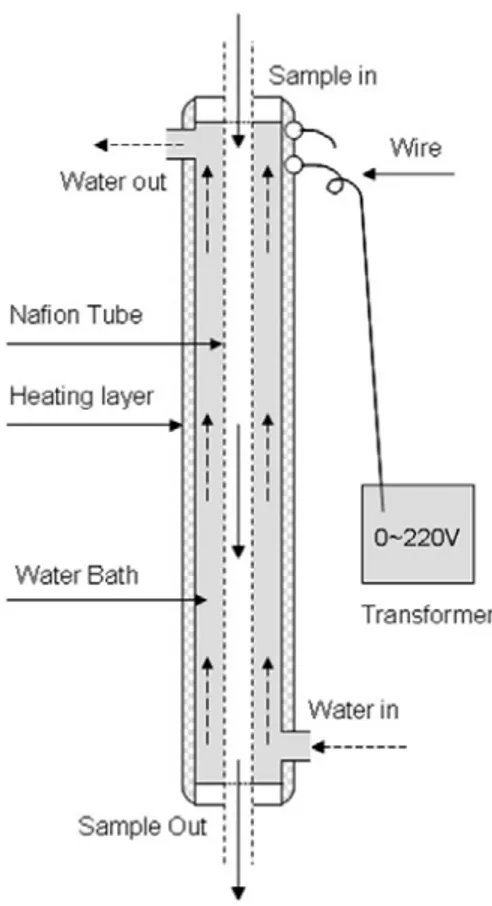
surement, relative humidity of the sampled air with reference nephelometer for “dry” measurement was controlled at RH below 40%, and the other one was operated at the RH scanning from 40% to 90% controlled with humidity control device (scan-ning humidifier). The structure of humidifier was similar with that used in NOAA/GMD (http://www.esrl.noaa.gov/gmd/aero/instrumentation/humid.html), It consisted in an
in-20
ternal water-vapor penetration membrane tube immerged in “deionized water bath” of the sheath pipe. The vapor was permeated to mix with sample air and the relative humidity of the air was modulated by controlling of the water temperature. The rela-tive humidity and temperature of inflow air were measured with a build-in sensor in the nephelometer. Fig.2 presents the structure of the humidifier.
25
The aerosol hygroscopic growth factor is determined by the formula:
ACPD
9, 5087–5118, 2009Observational study of aerosol hygroscopic growth
factors
X. L. Pan et al.
Title Page
Abstract Introduction
Conclusions References
Tables Figures
◭ ◮
◭ ◮
Back Close
Full Screen / Esc
Printer-friendly Version
Interactive Discussion Obtained data are then fit into the following empirical equation.
f(RH)=1+a(RH/100)b (2)
During the observation period, the nephelometers were calibrated with the zero gas (dry filtered air) every 24 h, and with the standard calibration gas (R134a) every 7 days. The data were automatically recorded every 5 minutes. Additional test on
hu-5
midity sensor and dry scattering measurements were performed. The comparison of humidity sensors of two nephelometers with HMP41/45 Visala humidity indicator showed in good agreement with the difference less than 3%. To correct the systematic signal bias of two nephelometers for aerosol scattering coefficient measurement, the normalized procedure reported by Day and Malm (2000) was conducted to make the
10
ratio of scattering coefficients equal to one when RH was lower than 35%.
2.3 Aerosol sampling and chemical analysis
Aerosol particles were collected by using two sets of Anderson size-segregated im-pactors (KA2000), The cut-off size ranges are: >11µm, 11–7µm, 7–4.7µm, 4.7– 3.3µm, 3.3–2.1µm, 2.1–1.1µm, 1.1–0.65µm, 0.65–0.43µm, and<0.43µm,
respec-15
tively. Teflon membranes were used as impaction substrates for the top eight stages, and Zeflour membranes (Pall Corporation) were for the backup filter (the bottom stage). Organic carbon matters were sampled with Quartz membranes (Whatman QMA). The mass flow controller was used to maintain a stable flow rate at 28.3 L/min during the sampling period, and the flow rate check was performed with a dry gas rotemeter
be-20
fore and after each sampling cycle. The sampling generally started at 08:30 LST, and sampling intervals were more than 22 h. The inlet height was 2.5 m above ground level. The membranes containing aerosol samples were refrigerated at a temperature below−4◦, and sent to the laboratory in Beijing for mass and chemical analysis. Teflon filter samples were continually collected from 25th April to 15th May 2006, whereas,
25
ACPD
9, 5087–5118, 2009Observational study of aerosol hygroscopic growth
factors
X. L. Pan et al.
Title Page
Abstract Introduction
Conclusions References
Tables Figures
◭ ◮
◭ ◮
Back Close
Full Screen / Esc
Printer-friendly Version
Interactive Discussion Aerosol mass concentrations were determined by means of weighting filters with
Satorius microbalance (precision: 10µg) before and after sample collection in the glove box. The filters were balanced in the glove box at a stable relative humidity (40±2%) and temperature (20±1◦) environment for about 72 h prior to weighting process. Each membrane was weighted three times in 2 days according to the standard procedure,
5
and the difference of gross mass of the filter weighted each time was less than 50µg. Inorganic anions (F−, Cl−, NO−3, SO24−) was analyzed with Dionex 500 ion chro-matography (IC), and cations (NH+4, K+, Na+, Ca2+, Mg2+) with HITACHI 180-70 flame atomic absorption spectrophotometer (FAAS) at the Key Laboratory of Atmospheric Chemistry, China Meteorological Administration (CMA). Organic carbon (OC) was
an-10
alyzed using thermal/optical carbon analyzer (Sunset Lab) at the Center of Environ-ment, Peking University, and the precision and detection limits (LDC) are 10% and 2µg cm−2
, respectively. The Quartz filters was pre-treated at temperature of 600◦ for 4 hours before sampling, and the sampled filters were stored in a refrigerator at−20◦ at the site before there were sent to the laboratory for analysis.
15
3 Results and discussion
3.1 Aerosol mass concentrations and chemical characteristics
During spring over Northern China, aerosol chemical properties are rather complex because of the mixture of different sources including transportation of heavy air pollu-tion from urbanizapollu-tion and industrial activities, desert dust particles from frequent dust
20
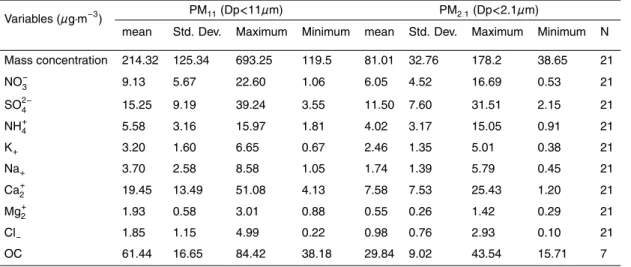
events, and local emitted plant organic compounds during vegetal “greening”. Statistic summary of aerosol mass concentrations, water soluble inorganic ion species, organic carbon are illustrated in Table 1. The average concentrations of fine particles (PM2.1, particle matter which pass through a size selective inlet with a 50% efficiency cut-off
at 2.1 aerodynamic diameter ) and coarse particles (PM11) were 81.01µg·m−3 and
25
respec-ACPD
9, 5087–5118, 2009Observational study of aerosol hygroscopic growth
factors
X. L. Pan et al.
Title Page
Abstract Introduction
Conclusions References
Tables Figures
◭ ◮
◭ ◮
Back Close
Full Screen / Esc
Printer-friendly Version
Interactive Discussion tively. The concentration of PM11 exceeded the National Ambient Air Quality
Sec-ondary Standard of China (daily average 150µg·m−3), and the concentration of PM2.1 is even over 2 times as high as the limit value of Primary Standard (daily average 35µg·m−3) of US Environmental Protection Agency. The maximum of particle mass concentration took place in the dust episode (on 30th April, according to the
meteoro-5
logical records) with the daily average PM11 concentration of 693.3µg·m− 3
and PM2.1 of 128.2µg·m−3. Aerosol mass concentrations are more similar with the experiments carried out in the suburban area of Beijing (Sun et al., 2004; Wang et al., 2005).
The mass concentration of soluble inorganic ions (SO24−, NH+4, NO−3, Ca2+, Mg2+, Na+, K+, Cl− ) and OC are listed in the Table 1. For the whole observation period,
or-10
ganic carbon accounts for the largest percentage of aerosol masses both in the PM2.1 and PM11 with mean values (standard deviation) of 29.84 (9.02)µg·m−3 and 61.44 (16.65)µg·m−3. Many previous observation studies showed an approximately same OC concentration level at the near study site (Jing-Jin-Tang). For instance, He (2001) reported that organic carbon was most abundant species of the total PM2.5 mass
15
(annual mean value of 29.1µg·m−3) in the Beijing urban site, ranging from 17.9% to 25.7%. OC annual average of 20.04(12.07)µg·m−3in PM2.5was also observed (Duan et al., 2004) in the background site of Beijing surrounding areas, and the high OC con-centration was mostly in connection with urban residential activities (Yang et al., 2005) and biomass burning (Duan et al., 2004). In PM2.1 category, mass concentration of
20
soluble SO24− ion was 11.5(7.6)µg·m−3, followed by NO−3 and NH
+
4 ions with value of 6.05(4.52)µg·m−3 and 4.02(3.17) µg·m−3. This indicated anthropogenic urban pollu-tion influences during the observapollu-tion period. In the PM11, soluble Ca
2+ ion makes up
the second largest proportion of aerosol masses, which might be related to flowing dirt during the springtime generally featured by low ambient relative humidity and strong
25
ACPD
9, 5087–5118, 2009Observational study of aerosol hygroscopic growth
factors
X. L. Pan et al.
Title Page
Abstract Introduction
Conclusions References
Tables Figures
◭ ◮
◭ ◮
Back Close
Full Screen / Esc
Printer-friendly Version
Interactive Discussion 3.2 Aerosols hygroscopic growth
3.2.1 Observation periods distinction
All thef(RH) displayed a similar appearance in the general shape of the hygroscopic growth (monotonic increasing) in spite of significant scattering of data points and wide range of deliquescent RH, and temporal variation off(RH=80%) (Fig. 3). In the plot,
5
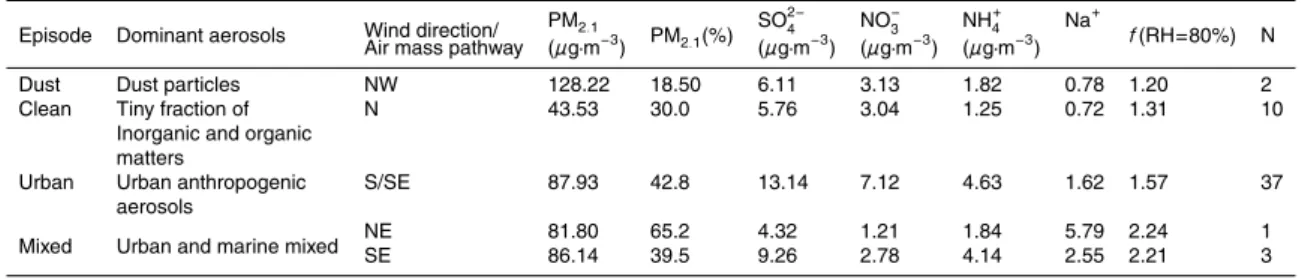
the high variations should be closely related to the unique dominant aerosols types at Xin’An site. We therefore categorized aerosols into four different groups according to air mass concentration and chemical compositions (Table 2). Also, 48-h air mass back-trajectories were used by means of the Hybrid Single-particle Lagrangian Inte-grated Trajectory (HYSPLIT) model (Draxler and Hess, 1998). Meteorological fields
10
with 6-hour time interval (formatted as FNL) used in the back-trajectory analysis were obtained from US National Centers for Environmental Prediction (NECP). The back trajectory starting geographical position was located at Xin’An site with starting altitude of 100 m. The dissociation of aerosols concentrations periodicity can be described as follows:
15
1. Detect periods influenced by pronounced dust aerosols in accordance with obser-vational records and 3 h meteorological information (Provided by China Meteoro-logical Administration, CMA). The floating dust episode occurred in the afternoon of 30 April (approximately 17:00 LST) while the local visibility was less than 1 km. While mass concentration of coarse particles (PM11) reached 693.25µg·m−
3 , the
20
mass concentration of fine particles (PM2.1) was about 128.22µg·m− 3
, accounting for only 18.5% of the total mass concentration. This is supported by observation performed by Wang et al. (2007) of which the mass concentration of TSP was about 419–879µg·m−3, with PM2.5of 156–286µg·m−
3
during the dust storm pe-riod in Beijing, 2004. Air mass 48 h back-trajectories also indicated that strong
25
ACPD
9, 5087–5118, 2009Observational study of aerosol hygroscopic growth
factors
X. L. Pan et al.
Title Page
Abstract Introduction
Conclusions References
Tables Figures
◭ ◮
◭ ◮
Back Close
Full Screen / Esc
Printer-friendly Version
Interactive Discussion 2. Select the periods where mass concentration of fine particles (PM2.1) are less
than 50µg·m−3as “clean periods”, and use this value as delimitation of clean-to-pollution on the ground where the value is approximately equivalent to Air Pollu-tion Index (http://www.mep.gov.cn/) of about 50 (indicaPollu-tion of “good” air quality in China). On 5th, 10th and 13th and 14th May, the daily average mass
concen-5
tration of PM2.1 were 39.2µg·m− 3
, 42.0µg·m−3, 42.7µg·m−3 and 49.8µg·m−3, those of PM11were 141.1µg·m−
3
, 144.8µg·m−3, 157.7µg·m−3and 145.6µg·m−3 respectively, generally lower than the National Ambient Air Quality Secondary Standard of China (daily average 150µg·m−3).
3. Consider the periods where particles (PM2.1) are over 50µg·m− 3
as influenced
10
by urban pollution, because the site is located in the center of three pollution source areas, Beijing, Tianjin and Tangshan, urban emitted anthropogenic pollu-tants might be easily transported to the observation site with sea-land breezes and northwest wind. As shown on Fig. 3, on 11th and 15th May, aerosol hy-groscopic growth factors f(RH=80%) were apparently higher than that of other
15
periods, we defined this phase as “mixed pollution type” discussed in Sect. 3.2.5. Dissociated other periods were considered as “urban pollution” featured by rela-tive high mean mass concentrations of SO2−
4 , NO
−
3 ions about 13.1µg·m
−3 and 7.2µg·m−3 respectively. Back-trajectories analysis showed that air mass mostly come from pollutant areas of southern regions such as Tianjin, Shijiazhuang, and
20
eastern Tangshan towards Xin’An site. Detailed analysis of the periods allows quantifying the variation of aerosols hygroscopic factors.
3.2.2 Clean period
During the clean days, aerosol hygroscopic growth features,f(RH=80%) showed large temporal variations (Fig. 3) with averaged measured of 1.31, corresponding to about
25
ACPD
9, 5087–5118, 2009Observational study of aerosol hygroscopic growth
factors
X. L. Pan et al.
Title Page
Abstract Introduction
Conclusions References
Tables Figures
◭ ◮
◭ ◮
Back Close
Full Screen / Esc
Printer-friendly Version
Interactive Discussion and 29% lower than the results (f(RH=80%)=1.42) reported by Koloutsou-Vakakis et
al. (2001) for the northern hemisphere continental site (Bondville, Illinois, US) and (f(RH=80%)=1.40) measured by Carrico et al. (2000) in the clean air conditions in Sagres (Portugal, ACE-2) respectively. The values above were derived from the fitting equations provided by authors. In Bondville site, local high sulfate burden and SO2
con-5
centration, reported by Charlson et al. (1991) and Harris and Kahl (1994) might be the possible contributions to relatively higherf(RH=80%), while Studies of Yan et al. were performed in the baseline air monitoring station of Northern China, where geographical environment within 30 km radius distance was characterized by rolling hills farmland, orchard and forests with lower pollutants concentrations. Besides, the differences of
10
dominant aerosol composition in winter and in spring might also be the poisssible rea-son for this disparity. Note that the hygroscopic growth factorf(RH) depends on size range of measured inlet aerosol particles and wavelength of nephelometer optics. For the present study, we measured scattering coefficient and its hygroscopicity of total suspended aerosols, whereas the above authors obtained values off(RH=80%) were
15
determined under aerosol diameter less than 10µm condition. These factors may be an explanation of such discrepancy in the results.
3.2.3 Dust episode
Measured hygroscopic growth factorf(RH=80%) was 1.20 in dust episode. This value seemed to be close to the results obtained by Carrico et al. (2003), of which aerosol
hy-20
groscopic factorsf(RH=82.5%) were 1.18 and 1.39 for particles size less than 10µm and 1µm respectively in East Asia (ACE-Asia) during dust dominant period. Obser-vational experiment performed by Kim et al. (2006) in Kosan (South Korea) indicated aerosolf(RH=85%)=1.73–2.20 during dust episode. These differences might be re-sulted from the mixing effect of dust particles with other inorganic materials during
25
ACPD
9, 5087–5118, 2009Observational study of aerosol hygroscopic growth
factors
X. L. Pan et al.
Title Page
Abstract Introduction
Conclusions References
Tables Figures
◭ ◮
◭ ◮
Back Close
Full Screen / Esc
Printer-friendly Version
Interactive Discussion of sulfate, nitrate, and coarse calcium in dust particles could substantially enhance the
hygroscopicity. Coarse calcium dust particles with nitrate-containing could appears in aqueous phase even at 15% RH (Shi et al., 2008).
3.2.4 Urban pollution period
Under the urban anthropogenic pollutants dominance condition, humidograms showed
5
little evidence of deliquescence but monotonic changes in scatting coefficient with in-creasing control RH (Fig. 4). Measured aerosol hygroscopic growth factorf(RH=80%) is 1.57, about 6% greater than the results (f(RH=80%)=1.48) for pollution episodes obtained by Yan et al. (2008) in the urban site of Beijing city. Mean mass concen-tration of PM2.1 is 87.9µg·m−
3
two times higher than the value of “clean” periods,
10
while averaged mass concentrations of SO24−, NO−3, NH+4 ions in PM2.1are respectively 14.51µg·m−3, 8.06µg·m−3 and 5.02µg·m−3, obviously higher than those obtained in clean periods (4.63µg·m−3, 1.78µg·m−3 and 1.57µg·m−3). Kim et al. (2006) reported approximately samef(RH=80%)=1.55–1.77 for pollution (from Korea industrial area) episode in Gosan regional background site. ACE-2, experiments conducted by
Car-15
rico et al. (2000) in Sagres showed thatf(RH=80%) value of 1.40 for anthropogenic pollutant (PM10) from Europe, about 11% lower than measured results in the present study. This might be related to the differences of physico-chemical properties of re-gional scale aerosols (Allen et al., 1999). Many other studies (Table 3) indicated more hygroscopic properties of urban aerosols, 2.04±0.28 in PRD region (Liu et al., 2007),
20
1.7–2.0 in Yangtze delta region (Xu et al., 2002) and 1.81±0.37∼2.30±0.24 in the flight over east coast of United States (Kotchenruther et al., 1999). Among these studies, Liu et al. (2007) determined the urban pollution periods in terms of air mass back trajecto-ries and Kotchenruther et al. (1999) classified the periods by airflow patterns, and they did not provide specific information of aerosol mass concentrations. It seems therefore
25
ACPD
9, 5087–5118, 2009Observational study of aerosol hygroscopic growth
factors
X. L. Pan et al.
Title Page
Abstract Introduction
Conclusions References
Tables Figures
◭ ◮
◭ ◮
Back Close
Full Screen / Esc
Printer-friendly Version
Interactive Discussion 3.2.5 Mixed Pollution episode
Under significant influence of urban pollution, we distinguished two main episodes (11th and 15th May respectively) of which aerosols hydrophilicity and its effects on scattering coefficient were relatively higher. Measured hygroscopic growth factor f(RH=80%) reached 2.33–2.48, close to the value of mixed aerosols (marine and
ur-5
ban aerosols) in the PRD region (Liu et al., 2007). Analysis of water-soluble inorganic ions highlighted drastic increment of Na+ mass concentration in PM2.1 from 11th to 15th May with mean value of about 3.78µg·m−3 (standard deviation of 1.21), higher than that (averagely 1.10µg·m−3) of unmixed pollution periods, suggesting evidence of marine aerosols impact (Chan et al., 1997; McInnes et al., 1996). Daily average mass
10
concentration of SO2−
4 at 11 and 15 May are 4.32µg·m
−3
and 9.26µg·m−3respectively. Analysis of back trajectory showed air masses direction oriented from Tianjin-Tangshan (Fig. 6). In addition, organic matters proportions in PM2.1increased of about 42.3% and 43.0% on 11th and 15th May respectively, 50% and 61% higher than mean values of unmixed urban pollution periods. Biomass burning may be the most probable source of
15
suspended organic particles in the atmosphere (Duan et al., 2004), however, we do not find any signs of fire events around the Xin’An site from MODIS active fire data (pro-vided by the MODIS Rapid Response System http://maps.geog.umd.edu/firms/) during that time. Then, the two episodes might be influenced by a complex “mixed aerosols” occurrence of involving urban pollution, marine and large portion of organic matters.
20
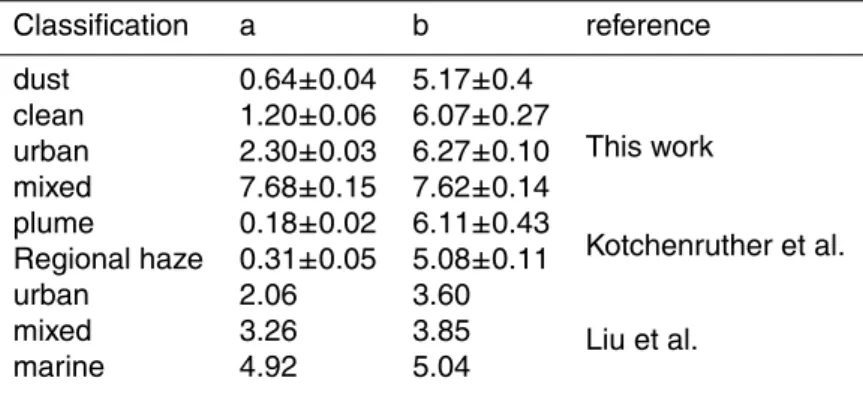
3.3 Aerosol hygroscopic growth function
Aerosols hygroscopic growth trends in dust, clean, urban pollution and mixed periods are shown in Fig. 4. Large variations of aerosols water absorbing ability appear among different dominant aerosols types. Aerosols hygroscopic growth functions are obtained from Eq. (1), and used for monotonic growth illustration (Carrico et al., 2003;
Kotchen-25
ACPD
9, 5087–5118, 2009Observational study of aerosol hygroscopic growth
factors
X. L. Pan et al.
Title Page
Abstract Introduction
Conclusions References
Tables Figures
◭ ◮
◭ ◮
Back Close
Full Screen / Esc
Printer-friendly Version
Interactive Discussion be undergone a sharply increase from dust particles (a=0.64, b=5.17) to mixed aerosol
types (a=7.68, b=7.62).
3.4 Influence of organic matters on aerosol hygroscopicity
Aerosol mass concentrations and proportions of SO24−, NO−3, NH+4, and organic carbon in PM2.1are summarized in Table 5. To better characterize the hygroscopic properties
5
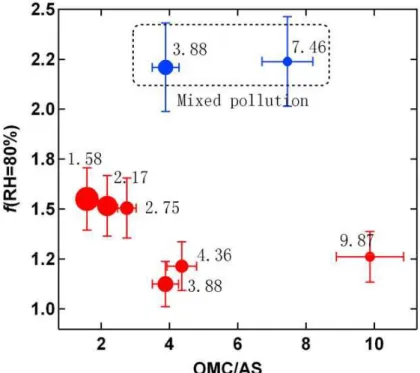
of aerosols, the ratio of organic carbon matters (OMC)/ammonium sulfate (AS) (Malm et al., 2005) is estimated, ammonium sulfate and organic carbon matters are derived from the equations: AS=0.944[NH+4]+1.02[SO24−] and OMC=1.4[OC] (Malm and Day, 2001). Figure 5 describes the relationship between OMC/AS andf(RH=80%). Ex-cept the period of “Mixed pollution”, the OMC/AS seems to be inversely correlated
10
to f(RH=80%): an increase of the ratio increases (from 1.58 to 9.87) is associated with a decrease of f(RH=80%) . The proportions of SO2−
4 , NO
−
3 and NH
+
4in PM2.1 also display same systematically trends (Fig. 5). This indicates that water soluble in-organic ions are key factors directly correlated to aerosols water absorbing abilities as reported by (Malm et al., 2005; Virkkula et al., 1999).Organic matters serve therefore
15
as hydrophobic compounds in aerosol particles chemical structure. However, different trends are obtained in mixed pollution periods. Proportions of OC in PM2.1are 40.0%, 43.0% for 11th and 15th May respectively, as much as two time of mean value (26.7%) of unmixed urban pollution periods (3rd , 4th, 12th May), while the aerosol hygroscopic growth factor increases by 46.0% associated with averaged f(RH=80%)=2.22. The
20
existence of water-soluble organic compounds in the aerosols seems to be strongly probable in such condition as suggested in many previous studies (Cruz and Pandis, 2000; Choi and Chan, 2002).
Figure 6 displays 48h Back-trajectory of air masses during pollution episodes (3rd, 4th, 11th, 12th and 15th May). It seems obvious that air masses on 11th May from
25
ACPD
9, 5087–5118, 2009Observational study of aerosol hygroscopic growth
factors
X. L. Pan et al.
Title Page
Abstract Introduction
Conclusions References
Tables Figures
◭ ◮
◭ ◮
Back Close
Full Screen / Esc
Printer-friendly Version
Interactive Discussion other pollution episodes, air masses are mostly from eastern China. Under the
influ-ence of microclimate and land vegetable coverage, the diversification of organic aerosol types from east (red dot shaded region in Fig. 6) and central part (blue dot shaded region in Fig. 6) of China might be an explanation of the discrepancies detected in hygroscopic properties. Furthermore, since aerosols physico-chemical properties and
5
mixing type may be very likely undergone changes during transportation, meteorologi-cal parameters (solar radiation and mixing height) are specifimeteorologi-cally analyzed in pollution periods. Figure 7a shows the temporal and spatial variation of mixing height along the air masses pathways. The mixing height is about 3000 m at 14:00 LST on 15th May, and 1720 m on 11th May. This indicates strong vertical convection conditions in
10
the boundary layer, favorable to mixing and chemical processes of local emitted and transported aerosols. The variations of solar radiation, susceptible to influence organic carbon photochemical reactions, are illustrated in the Fig. 7b. Three mostly strong solar radiation values: 871.5 Wm−2
, 812.1 Wm−2
and 655.7 Wm−2
are detected respectively on 15th, 3rd, and 11th May. Such condition may trigger the surface oxidation process
15
of organic matters active function groups as well as corresponding water-absorbing ability (Chughtai et al., 1999; Charlson et al., 1992). Note that thef(RH=80%) on 3rd May is lower less than that of 11th and 15th May. This is probably related to the var-ious sources of organic aerosols and the discrepancy in proportions of OC in PM2.1 (daily average of 29.8%, 40.0% and 43.0% on 3rd, 11th and 15th May). However,
20
further information on organic compounds still needed to insights into schematics of hygroscopicity and its influence on aerosols optical properties.
4 Conclusions
Aerosols hygroscopic growth experimental study over rural area (Jing-Jin-Tang) near Beijing mega-city through analysis of key meteorological parameters and aerosols
25
catego-ACPD
9, 5087–5118, 2009Observational study of aerosol hygroscopic growth
factors
X. L. Pan et al.
Title Page
Abstract Introduction
Conclusions References
Tables Figures
◭ ◮
◭ ◮
Back Close
Full Screen / Esc
Printer-friendly Version
Interactive Discussion rizing pollution episodes in four different cases (clean, dust, urban pollution and mixed
pollution) in accordance with aerosols mass concentrations and chemical compositions variations. (1) In the “clean” period, aerosols hygroscopic growth factorf(RH=80%) is 1.31, higher than the results report by Yan et al. (2008) in rural area of north China (1.2), and lower than that of Koloutsou-Vakakis et al. (2001) measured in northern
5
hemisphere continental site (1.4–1.5) and Carrico et al. (2000) in Sagres Portugal (1.69±0.16). (2) During the dust episode, f(RH=80%)=1.20, far less than observa-tional experiment result (1.73–2.20) obtained by Kim et al. (2006). The mixing effect of dust particles with sulfate, nitrate and sea-salt aerosols may be a plausible expla-nation of results divergence. (3) During urban pollutant phase, measured aerosol
hy-10
groscopic growth factorf(RH=80%) is 1.57 , lower than values of 2.04±0.28 in south-ern coast area of China, 1.7–2.0 in Yangtze delta region and 1.81±0.37–2.30±0.24 in East coast of United States. (4) Marine and urban pollutant mixing aerosols present greater water soluble ability with averaged f(RH=85%) of 2.40, slightly higher than the value (f(RH=80%)=2.04) reported in marine dominant air mass period (Carrico et
15
al., 2003), and that (f(RH=80%)=2.29±0.28) in PRD coastal region during the urban-marine mixed period (Liu et al., 2007). Analysis of back trajectory, solar radiation and mixing height along the air masses pathways, indicates that organic aerosols types, sources and the mixing process during the transportation play key roles in determining particles hygroscopicity. The higher values of solar radiation also constitute an
im-20
portant favorable factor of water-soluble organic matters formation. Through present experimental study, organic matters seem to importantly contribute to uncertainties of aerosols hygroscopic properties as well as the variations of hygroscopic growth. Facing this complexity, further experimental long-term study associated with specific modeling analysis on the relationship between organic compounds and aerosols hygroscopicity
25
will be done in near future to thoroughly understand such physico-chemical process.
ACPD
9, 5087–5118, 2009Observational study of aerosol hygroscopic growth
factors
X. L. Pan et al.
Title Page
Abstract Introduction
Conclusions References
Tables Figures
◭ ◮
◭ ◮
Back Close
Full Screen / Esc
Printer-friendly Version
Interactive Discussion and NSFC key project (40433008), and partly supported by the National Key Basic Research
project (2006CB403701).
References
Allen, G. A., Lawrence, J., and Koutrakis, P.: Field validation of a semi-continuous method for aerosol black carbon (aethalometer) and temporal patterns of summertime hourly black
5
carbon measurements in southwestern PA, Atmos. Environ., 33, 817–823, 1999.
Carrico, C. M., Rood, M. J., and Ogren, J. A.: Aerosol light scattering properties at Cape Grim, Tasmania, during the First Aerosol Characterization Experiment (ACE 1), J. Geophys. Res., 103, 16565–16574, 1998.
Carrico, C. M., Rood, M. J., Ogren, J. A., Neususs, C., Wiedensohler, A., and Heintzenberg, J.:
10
Aerosol Optical properties at Sagres, Portugal during ACE-2, Tellus B, 52, 694–715, 2000. Carrico, C. M., Kus, P., Rood, M. J., Quinn, P. K., and Bates, T. S.: Mixtures of pollution, dust,
sea salt, and volcanic aerosol during ACE-Asia: Radiative properties as a function of relative humidity, J. Geophys. Res, 108, 8650, doi:10.1029/2003jd003405, 2003.
Carrico, C. M., Kreidenweis, S. M., Malm, W. C., Day, D. E., Lee, T., Carrillo, J., McMeeking,
15
G. R., and Collett, J. L.: Hygroscopic growth behavior of a carbon-dominated aerosol in Yosemite National Park, Atmos. Environ., 39, 1393–1404, 2005.
Chan, Y. C., Simpson, R. W., McTainsh, G. H., Vowles, P. D., Cohen, D. D., and Bailey, G. M.: Characterisation of chemical species in PM2.5and PM10aerosols in Brisbane, Australia, Atmos. Environ., 31, 3773–3785, 1997.
20
Charlson, R. J., Langner, J., Rodhe, H., Leovy, C. B., and Warren, S. G.: Perturbation of the northern hemisphere radiative balance by backscattering from anthropogenic sulfate aerosols*, Tellus B, 43, 152–163, 1991.
Charlson, R. J., Schwartz, S. E., Hales, J. M., Cess, R. D., Coakley, J. A., Hansen, J. E., and Hofmann, D. J.: Climate Forcing by Anthropogenic Aerosols, Science, 255, 423–430, 1992.
25
Choi, M. Y. and Chan, C. K.: The Effects of Organic Species on the Hygroscopic Behaviors of Inorganic Aerosols, Environ. Sci. Technol., 36, 2422–2428, 2002.
Chughtai, A. R., Williams, G. R., Atteya, M. M. O., Miller, N. J., and Smith, D. M.: Carbonaceous particle hydration, Atmos. Environ., 33, 2679–2687, 1999.
Covert, D. S., Charlson, R. J., and Ahlquist, N. C.: A study of the relationship of chemical
ACPD
9, 5087–5118, 2009Observational study of aerosol hygroscopic growth
factors
X. L. Pan et al.
Title Page
Abstract Introduction
Conclusions References
Tables Figures
◭ ◮
◭ ◮
Back Close
Full Screen / Esc
Printer-friendly Version
Interactive Discussion compositon and humdity to light scattering by aerosols, J. Appl. Meteorol., 11, 968–976,
1972.
Crumeyrolle, S., Gomes, L., Tulet, P., Matsuki, A., Schwarzenboeck, A., and Crahan, K.: In-crease of the aerosol hygroscopicity by cloud processing in a mesoscale convective system: a case study from the AMMA campaign, Atmos. Chem. Phys., 8, 6907–6924, 2008,
5
http://www.atmos-chem-phys.net/8/6907/2008/.
Cruz, C. N. and Pandis, S. N.: Deliquescence and Hygroscopic Growth of Mixed Inorganic-Organic Atmospheric Aerosol, Environ. Sci. Technol., 34, 4313–4319, 2000.
Day, D. E., Malm, W. C., and Kreidenweis, S. M.: Aerosol light scattering measurements as a function of relative humidity, J. Air Waste Manag. Assoc., 50, 710–716, 2000.
10
Draxler, R. R. and Hess, G. D.: An overview of the HYSPLIT 4 modelling system for trajectories, dispersion, and deposition, Australian Meteorological Magazine, 47, 295–308, 1998. Duan, F., Liu, X., Yu, T., and Cachier, H.: Identification and estimate of biomass burning
con-tribution to the urban aerosol organic carbon concentrations in Beijing, Atmos. Environ., 38, 1275–1282, 2004.
15
Hand, J. L. and Malm, W. C.: Review of the IMPROVE Equation for Estimating Ambient Light Extinction Coefficients-Final Report, 2006.
Harris, J. M. and Kahl, J. D. W.: Analysis of 10-day isentropic flow patterns for Barrow, Alaska: 1985–992, J. Geophys. Res, 99, 845–845, 1994.
He, K., Yang, F., Ma, Y., Zhang, Q., Yao, X., Chan, C. K., Cadle, S., Chan, T., and Mulawa,
20
P.: The characteristics of PM2.5in Beijing, China, Atmospheric Environment, 35, 4959–4970, 2001.
Kim, J., Yoon, S. C., Jefferson, A., and Kim, S. W.: Aerosol hygroscopic properties during Asian dust, pollution, and biomass burning episodes at Gosan, Korea in April 2001, Atmos. Environ., 40, 1550–1560, 2006.
25
Koloutsou-Vakakis, S., Carrico, C. M., Kus, P., Rood, M. J., Li, Z., Shrestha, R., Ogren, J. A., Chow, J. C., and Watson, J. G.: Aerosol properties at a midlatitude Northern Hemisphere continental site, J. Geophys. Res., 106, 3019–3032, 2001.
Kotchenruther, R. A. and Hobbs, P. V.: Humidification factors of aerosols from biomass burning in Brazil, J. Geophys. Res., 103, 32081–32090, 1998.
30
ACPD
9, 5087–5118, 2009Observational study of aerosol hygroscopic growth
factors
X. L. Pan et al.
Title Page
Abstract Introduction
Conclusions References
Tables Figures
◭ ◮
◭ ◮
Back Close
Full Screen / Esc
Printer-friendly Version
Interactive Discussion Li-Jones, X., Maring, H. B., and Prospero, J. M.: Effect of relative humidity on light scattering
by mineral dust aerosol as measured in the marine boundary layer over the tropical Atlantic Ocean, J. Geophys. Res., 103(31), 31113–31121, 1998.
Liu, X., Cheng, Y., Zhang, Y., Jung, J., Sugimoto, N., Chang, S. Y., Kim, Y. J., Fan, S., and Zeng, L.: Influences of relative humidity and particle chemical composition on aerosol scattering
5
properties during the 2006 PRD campaign, Atmos. Environ., 42, 1525–1536, 2007.
Magi, B. I. and Hobbs, P. V.: Effects of humidity on aerosols in southern Africa during the biomass burning season, J. Geophys. Res. Atmos., 108, 8495, doi:10.1029/2002jd002144, 2003.
Malm, W. C. and Day, D. E.: Estimates of aerosol species scattering characteristics as a
func-10
tion of relative humidity, Atmos. Environ., 35, 2845–2860, 2001.
Malm, W. C., Day, D. E., Kreidenweis, S. M., Collett, J. L., Carrico, C., McMeeking, G., and Lee, T.: Hygroscopic properties of an organic-laden aerosol, Atmos. Environ., 39, 4969–4982, 2005.
McInnes, L. M., Quinn, P. K., Covert, D. S., and Anderson, T. L.: Gravimetric analysis, ionic
15
composition, and associated water mass of the marine aerosol, Atmos. Environ., 30, 869– 884, 1996.
Perry, K. D., Cliff, S. S., and Jimenez-Cruz, M. P.: Evidence for hygroscopic mineral dust par-ticles from the Intercontinental Transport and Chemical Transformation Experiment, J. Geo-phys. Res, 109, D23S28, doi:10.1029/2004jd004979, 2004.
20
Randles, C. A., Russell, L. M., and Ramaswamy, V.: Hygroscopic and optical properties of organic sea salt aerosol and consequences for climate forcing, Geophys. Res. Lett, 31, L16108, doi:10.1029/2004gl020628, 2004.
Shi, Z., Zhang, D., Hayashi, M., Ogata, H., Ji, H., and Fujiie, W.: Influences of sulfate and nitrate on the hygroscopic behaviour of coarse dust particles, Atmos. Environ., 42, 822–827,
25
2008.
Sun, Y., Zhuang, G., Wang, Y., Han, L., Guo, J., Dan, M., Zhang, W., Wang, Z., and Hao, Z.: The air-borne particulate pollution in Beijing – concentration, composition, distribution and sources, Atmos. Environ., 38, 5991–6004, 2004.
Virkkula, A., Van Dingenen, R., Raes, F., and Hjorth, J.: Hygroscopic properties of aerosol
30
formed by oxidation of limonene, alpha-pinene, and beta-pinene, J. Geophys. Res., 104, 3569–3580, 1999.
ACPD
9, 5087–5118, 2009Observational study of aerosol hygroscopic growth
factors
X. L. Pan et al.
Title Page
Abstract Introduction
Conclusions References
Tables Figures
◭ ◮
◭ ◮
Back Close
Full Screen / Esc
Printer-friendly Version
Interactive Discussion and the source of PM2.5aerosol in Beijing, Atmos. Environ., 39, 3771–3784, 2005.
Wang, Y., Zhuang, G., Tang, A., Zhang, W., Sun, Y., Wang, Z., and An, Z.: The evolution of chemical components of aerosols at five monitoring sites of China during dust storms, Atmos. Environ., 41, 1091–1106, 2007.
Xu, J., Bergin, M. H., Yu, X., Liu, G., Zhao, J., Carrico, C. M., and Baumann, K.: Measurement
5
of aerosol chemical, physical and radiative properties in the Yangtze delta region of China, Atmos. Environ., 36, 161–173, 2002.
Yamato, M. and Tanaka, H.: Aircraft observations of aerosols in the free marine troposphere over the North Pacific Ocean: particle chemistry in relation to air mass origin, J. Geophys. Res., 99, 5353–5377, 1994.
10
Yan, P., Pan, X. L., Tang, J., Zhou, X. J., and Zeng, L. M.: An experimental study on the influence of relative humidity on the atmospheric aerosol scattering coefficient at an urban site in Beijing, Acta Meteorologica Sinica, 6, 11–119, 2008.
Yang, F., He, K., Ye, B., Chen, X., Cha, L., Cadle, S. H., Chan, T., and Mulawa, P. A.: One-year record of organic and elemental carbon in fine particles in downtown Beijing and Shanghai,
15
Atmos. Chem. Phys, 5, 1449–1457, 2005.
Zhang, D. and Iwasaka, Y.: Nitrate and sulfate in individual Asian dust-storm particles in Beijing, China in Spring of 1995 and 1996, Atmos. Environ., 33, 3213–3223, 1999.
Zhang, D., Iwasaka, Y., Shi, G., Zang, J., Matsuki, A., and Trochkine, D.: Mixture state and size of Asian dust particles collected at southwestern Japan in spring 2000, J. Geophys. Res,
20
ACPD
9, 5087–5118, 2009Observational study of aerosol hygroscopic growth
factors
X. L. Pan et al.
Title Page
Abstract Introduction
Conclusions References
Tables Figures
◭ ◮
◭ ◮
Back Close
Full Screen / Esc
Printer-friendly Version
Interactive Discussion
Table 1.Statistical summary of 24 h average aerosol species concentrations.
Variables (µg·m−3) PM11(Dp<11µm) PM2.1(Dp<2.1µm)
mean Std. Dev. Maximum Minimum mean Std. Dev. Maximum Minimum N
Mass concentration 214.32 125.34 693.25 119.5 81.01 32.76 178.2 38.65 21
NO−
3 9.13 5.67 22.60 1.06 6.05 4.52 16.69 0.53 21
SO2−
4 15.25 9.19 39.24 3.55 11.50 7.60 31.51 2.15 21
NH+4 5.58 3.16 15.97 1.81 4.02 3.17 15.05 0.91 21
K+ 3.20 1.60 6.65 0.67 2.46 1.35 5.01 0.38 21
Na+ 3.70 2.58 8.58 1.05 1.74 1.39 5.79 0.45 21
Ca+2 19.45 13.49 51.08 4.13 7.58 7.53 25.43 1.20 21
Mg+2 1.93 0.58 3.01 0.88 0.55 0.26 1.42 0.29 21
Cl− 1.85 1.15 4.99 0.22 0.98 0.76 2.93 0.10 21
ACPD
9, 5087–5118, 2009Observational study of aerosol hygroscopic growth
factors
X. L. Pan et al.
Title Page
Abstract Introduction
Conclusions References
Tables Figures
◭ ◮
◭ ◮
Back Close
Full Screen / Esc
Printer-friendly Version
Interactive Discussion
Table 2.Designation of different dominant types of aerosol (PM2.1).
Episode Dominant aerosols Wind direction/ PM2.1
PM2.1(%)
SO2−
4 NO
−
3 NH+4 Na+ f(RH=80%) N
Air mass pathway (µg·m−3
) (µg·m−3
) (µg·m−3
) (µg·m−3
)
Dust Dust particles NW 128.22 18.50 6.11 3.13 1.82 0.78 1.20 2 Clean Tiny fraction of
Inorganic and organic matters
N 43.53 30.0 5.76 3.04 1.25 0.72 1.31 10
Urban Urban anthropogenic aerosols
S/SE 87.93 42.8 13.14 7.12 4.63 1.62 1.57 37
ACPD
9, 5087–5118, 2009Observational study of aerosol hygroscopic growth
factors
X. L. Pan et al.
Title Page
Abstract Introduction
Conclusions References
Tables Figures
◭ ◮
◭ ◮
Back Close
Full Screen / Esc
Printer-friendly Version
Interactive Discussion
Table 3.Other observation results of hygroscopic growth factor of different types of aerosols.
Study region (Experiment) Period Aerosol type f(RH=80%) * RH range References
Great Somky Mountain
1995 rural
1.95 82.8/40
Day and Malm,
Grand Canyon 1.88 82.3/40
Big Bend 1.93 82.5/40
Brazil (SCAR-B) Aug–Sep 1995 Biomass burning 1.16(1.01∼1.51) 80/30 Kotchenruther and Hobbs
BondvillIllionois 1995 Northern Hemisphere continental site (PM10) 1.42 82.5/40 Koloutsou-Vakakis et al.
Sagres, Portugal ACE-2 15 Jun–25 Jul 1997 Polluted (PM10) 1.40
82.5/30 Carrico et al.
Clean (PM10) 1.67
East Coast of US (TARFOX) 10–31 Jul 1996 Urban/industrial 1.81±0.37∼2.30±0.24 80/30 Kotchenruther et al.
Cape Grim Tasmania ACE-1 15 Jun–25 Jul 1997 Rural 1.89 82.5/30 Carrico et al.
Yangtze delta 28 Oct–30 Nov 1999 Urban/background 1.7∼2.0 85/40 Xu et al.
Southern Africa (SAFARI) 10 Aug–18 Sep 2000 Biomass burning 1.42±0.05∼2.07±0.03 80/30 Magi and Hobbs
East Asia (ACE-Asia) 11–27 Apr 2001
Dust 1.69∼1.73
85/40 Kim et al.
Pollution (China) 2.0∼2.43
Pollution (Korea) 1.55∼1.77
Biomass burning 1.30∼1.59
East Asia (ACE-Asia) Mar–Apr 2001
Pollution(PM10) 2.36
85/35 Carrico et al.
Marine(PM10) 2.04
Dust (PM10) 1.25
Pearl River Delta(PRD) 1–31 Jul 2006
Urban 2.04±0.28
80/40 Liu et al.
Mixed 2.29±0.28
Marine 2.68±0.59
SDZ regional Background monitoring station Dec 2005 CleanUrban pollution 1.161.34 85/40 Yan et al.
Jing-jin-tang (East Asia) 24 Apr–15 May 2006
Clean 1.27∼1.34
90/40 this study
Dust 1.17∼1.23
Urban pollution 1.55∼1.59
Mixed 2.33∼2.48
ACPD
9, 5087–5118, 2009Observational study of aerosol hygroscopic growth
factors
X. L. Pan et al.
Title Page
Abstract Introduction
Conclusions References
Tables Figures
◭ ◮
◭ ◮
Back Close
Full Screen / Esc
Printer-friendly Version
Interactive Discussion
Table 4.Curve-fitting parameters in different aerosol dominant episodes in terms of Eq. (2).
Classification a b reference
dust 0.64±0.04 5.17±0.4
This work clean 1.20±0.06 6.07±0.27
urban 2.30±0.03 6.27±0.10 mixed 7.68±0.15 7.62±0.14 plume 0.18±0.02 6.11±0.43
Kotchenruther et al. Regional haze 0.31±0.05 5.08±0.11
urban 2.06 3.60
Liu et al.
mixed 3.26 3.85
ACPD
9, 5087–5118, 2009Observational study of aerosol hygroscopic growth
factors
X. L. Pan et al.
Title Page
Abstract Introduction
Conclusions References
Tables Figures
◭ ◮
◭ ◮
Back Close
Full Screen / Esc
Printer-friendly Version
Interactive Discussion
Table 5. Relationship between the hygroscopic growth factor with chemical composition in PM2.1.
date PM2.1(µg·m−3) PM
2.1/PM11 SO 2−
4 (%) NH +
4(%) NO−3(%) OC (%) AS (µg·m
−3) OMC (
µg·m−3) OMC/AS
f(RH=80%)
05–03 107.63 45.79 15.27 3.84 7.64 29.77 20.67 44.85 0.46 1.51
05–04 178.21 50.32 17.68 3.82 9.37 24.43 38.57 60.96 0.63 1.56
05–10 42.05 29.02 11.24 2.15 5.24 37.37 5.67 22.00 0.26 1.13
05–11 81.80 42.13 5.29 2.25 1.48 40.02 6.14 45.83 0.13 2.24
05–12 102.81 57.52 9.47 3.80 5.68 26.03 13.62 37.46 0.36 1.50
05–13 42.67 27.05 6.07 4.45 1.24 36.66 4.44 21.90 0.20 1.26
05–14 49.78 34.19 8.86 3.82 1.06 39.37 6.29 27.44 0.23 1.21
ACPD
9, 5087–5118, 2009Observational study of aerosol hygroscopic growth
factors
X. L. Pan et al.
Title Page
Abstract Introduction
Conclusions References
Tables Figures
◭ ◮
◭ ◮
Back Close
Full Screen / Esc
Printer-friendly Version
Interactive Discussion
ACPD
9, 5087–5118, 2009Observational study of aerosol hygroscopic growth
factors
X. L. Pan et al.
Title Page
Abstract Introduction
Conclusions References
Tables Figures
◭ ◮
◭ ◮
Back Close
Full Screen / Esc
Printer-friendly Version
Interactive Discussion
ACPD
9, 5087–5118, 2009Observational study of aerosol hygroscopic growth
factors
X. L. Pan et al.
Title Page
Abstract Introduction
Conclusions References
Tables Figures
◭ ◮
◭ ◮
Back Close
Full Screen / Esc
Printer-friendly Version
Interactive Discussion
ACPD
9, 5087–5118, 2009Observational study of aerosol hygroscopic growth
factors
X. L. Pan et al.
Title Page
Abstract Introduction
Conclusions References
Tables Figures
◭ ◮
◭ ◮
Back Close
Full Screen / Esc
Printer-friendly Version
Interactive Discussion
ACPD
9, 5087–5118, 2009Observational study of aerosol hygroscopic growth
factors
X. L. Pan et al.
Title Page
Abstract Introduction
Conclusions References
Tables Figures
◭ ◮
◭ ◮
Back Close
Full Screen / Esc
Printer-friendly Version
Interactive Discussion
ACPD
9, 5087–5118, 2009Observational study of aerosol hygroscopic growth
factors
X. L. Pan et al.
Title Page
Abstract Introduction
Conclusions References
Tables Figures
◭ ◮
◭ ◮
Back Close
Full Screen / Esc
Printer-friendly Version
Interactive Discussion
ACPD
9, 5087–5118, 2009Observational study of aerosol hygroscopic growth
factors
X. L. Pan et al.
Title Page
Abstract Introduction
Conclusions References
Tables Figures
◭ ◮
◭ ◮
Back Close
Full Screen / Esc
Printer-friendly Version
Interactive Discussion