A Mathematical Derivation
of a Risk Assessment Procedure
Marco Benini and Sabrina Sicari
*Abstract—Risk assessment is a well-established engineering prac-tise widely applied on technological systems. Despite its spread, few attempts have been made to formalise its basis in order to provide a non-empirical foundation. In this article we introduce a formal anal-ysis of risk assessment in an algebraic framework, considering also the case of multiple experts. Results about the reliability and the ap-plicability of the framework will be derived according to the struc-tural properties of the problem formalisation.
Keywords: Risk analysis, Formal methods, Algebraic modelling
1 Introduction
Security is a process, whose phases have to be implemented in an appropriate order: an important step is the risk assessment task that provides the basis to evaluate the success of the whole pro-cess. In fact, it allows to rate on a quantitative basis the security posture of a system, thus the effectiveness of countermeasures. In this view, risk assessment methods have been developed as “good practises” arising from successful experiences and com-mon sense. There have been few attempts to provide a math-ematical formulation to those methods and, as far as we have been able to ascertain, no mathematical foundation has ever been developed. This lack of background is a problem since the out-comes of risk assessment are used in sensitive environments and so there is a strong need for their “certification”.
In the case of telecommunication systems, risk assessment is used to protect the network from intrusions and misuses: since most companies have their sensitive information flowing on their internal networks, an abuse of those systems exposes the com-pany to any sort of bad consequences.
In their full generality, risk assessment methods are independent from a specific application domain; nevertheless, few attempts have been made to formalise and to analyse risk assessment in a large, cross-field environment. Since expertise plays an essen-tial role in a successfull application of a risk assessment method, it has been tradition to confine methods within their originating
*Manuscript received July 31st, 2009; revised March 16th, 2010.
M. Benini is with the Dipartimento di Informatica e Comunicazione, Univer-sità degli Studi dell’Insubria, via Mazzini 5, IT-21100, Varese, Italy (correspond-ing author to provide phone: +38 0332 218933; fax: +39 0332 218919; e-mail: [email protected]).
S. Sicari is with the Dipartimento di Informatica e Comunicazione, Università degli Studi dell’Insubria, via Mazzini 5, IT-21100, Varese, Italy (e-mail: [email protected]).
field. Accordingly, although we believe the scope of our results is beyond the originating area, namely security of telecommuni-cation networks, we do not feel confident, that is, we lack the expertise, to claim for a general applicability of our investiga-tions beyond technological systems.
The common approach to risk assessment on technological sys-tems is to find the possible vulnerabilities and to evaluate them according to the damage they may cause and to the probability they will be abused. There are huge databases of vulnerabili-ties for almost every piece of hardware and software and those repositories are used to test by means of the so-called security scanners, what known vulnerabilities affect a given system. This knowledge is essential for a correct risk assessment, but it is not sufficient. In fact, the correct evaluation of the impact of the found vulnerabilities depends on the structure of the system and on the goals the system should meet. These evaluations are im-possible without a direct knowledge of the system and of the en-vironment where the system operates. So, security analysts play an essential role in applying risk assessment methods since their experience is used to evaluate the “local” impact of the possible vulnerabilities.
Because there is no practical way to measure on-the-field the “lo-cal” impact of vulnerabilities, most probabilistic approaches suf-fer from a lack of data, reducing the quality of their outcomes. Hence, although interesting methods based on statistical analy-ses have been proposed, few of them have been applied in prac-tise. The prominent methods of this sort are briefly discussed in Section 4.
We propose a different way to look at the problem: given one or more experts, how should they proceed in the evaluation of the risk a system is exposed to? In compact terms, we propose to certify the process of risk assessment instead of certifying the results. In this way, the intrinsic dependence on experts’ trust is reduced and, to some extent, the outcomes are reproducible. Our work has been previously published in a number of articles [1, 2, 3, 4, 5, 6, 7] where a simple risk assessment method has been proposed, formalised and analysed.
novel and previously unpublished, shading new light to the inner properties of our approach to risk assessment.
More important, in this paper we want to analyse what happens when two or more experts evaluate the same system. Specifi-cally, we want to analyse if it is possible to combine their eval-uations in the “most general” way. We have already shown that the combination of evaluations is possible, see [6, 7], but seek-ing for the most general combination reveals a surprisseek-ing result: there is no such a thing as the most general way to combine eval-uations, intended as the “kernel” of any possible combination. This result is proved in Section 2.4. To show the impossibility to find the most general combination to assess the security posture of a system, given a number of experts’ metrics, we use elemen-tary concepts and results of category theory and of the algebra of lattices.
The aims of this article (minimality of the method, impossibil-ity of the most general combination) may appear of a theoret-ical nature which is not relevant in practise. The toy example of Section 3 shows how it is practically impossible to compare and to combine the evaluations of two security analysts on the small system under consideration. About the practical value of our method, showing that minimality is not a limit, a real case-study has been published in [5].
As a side effect of the main result of this paper, a mathematical framework for risk assessment as a process has been developed. In fact, this is the starting point of our presentation.
2 The mathematical framework
A metric is a set of values, not necessarily numbers, used to mea-sure an homogeneous class of observables. Depending on the nature of the observed objects and the goal of the measurement, the values may be combined and compared by means of oper-ations and reloper-ations. In the case of risk analysis, the values in a metric form an ordered set, and the relations are equality and less-than-or-equal (≤). Formally,≤is required to be an order re-lation, i.e., reflexive (x≤x), transitive (x≤yandy≤zimplies x≤z) and anti-symmetric (x≤yandy≤ximpliesx=y). The ≤relation may be partial, that is, not defined for every pairx,y of values. Sometimes, addition of values or scaling (multiplica-tion by a scalar) are used as opera(multiplica-tions. Usually, when addi(multiplica-tion is present, it forms an algebraic group. When both addition and scaling are present, the metric forms a module or a vector space, depending on the algebraic structure of scalars (ring or field). Even in absence of additional ones, the order relation naturally generates a few operations implicitly assumed as given. These operations are the maximum and the minimum of a subset of val-ues or, in the general case of a partial or infinite order, the least upper bound (lub, for short) and the greatest lower bound (glb).
2.1 The formal definition of metric
The operations and the relations on a metric shape its structure: the simplest metrics are formed by a finite set of values with an
order relation. Nevertheless, defining a metric just as a partially ordered set prevents the development of risk assessment proce-dures. In fact, risk is intended to be the worst outcome of an attack to a system, thus the need to calculate the lub of a set of values each one measuring the risk of a single outcome. Also, leveraging among risk evaluations usually requires to compute a glb.
But, to ensure that the lub and the glb exist for every subset of values, the metric must form a complete lattice1.
Definition 2.1 Alatticeis a partial order⟨O,≤⟩such that every pair x,y ∈ Ohas a lub, denoted as x∨y, and a glb, denoted as x∧y. A lattice isfiniteifOis a finite set. LetU ⊆ Obe non-empty, then∨Uand∧Uare, respectively, the lub and the
glb of the elements inU, if they exists. A lattice iscompleteif every non-empty subsetU⊆ Ohas a lub and a glb2.
In practise, we are mainly interested in finite lattices. In fact, the set of values used in a risk analysis is always finite: if num-bers are used, they have a fixed amount of significant digits: if probabilities are used, only a few decimal places are considered; if qualifiers, like “easy” or “difficult”, are used, there is a finite and fixed number of them.
Moreover, we are interested in lattices having two special val-ues,⊥and⊤, denoting the impossibility to break the system and the immediate ability to abuse of a completely compromised sys-tem, respectively. In a metric based on numbers or probabilities, ⊥denotes the minimal value and⊤the maximal value, while, operating with qualifiers, we assume the existence of two appro-priate values3.
Definition 2.2 A lattice⟨O,≤⟩isboundedif there are two dis-tinct elements⊥and⊤such that⊥=∧O, i.e., every element
is greater than⊥, and⊤=∨O, i.e., every element is less than
⊤. In a bounded lattice,∨∅
=⊥and∧∅=⊤.
Proposition 2.3 A finite and bounded lattice is complete.
proof: By induction on the cardinality of subsets: the empty subset has⊥as lub and⊤as glb; the glb and the lub of the subset A∪ {e}aree∧∧Aande∨∨A, respectively, where∧Aand ∨Aare defined by induction hypothesis.
✷
Hence, we a notion of metric that suits our purposes is
Definition 2.4 Ametricis a finite and bounded lattice. 1The theory of lattices is standard. Our treatment is limited to the definitions
and the properties of interest in the context of this paper. The interested reader is referred to [8] for a detailed presentation of the mathematical aspects.
2Some authors, e.g. [9], do not require the subsetUto be non-empty. We
follow the general algebraic practise.
3This assumption is not committing: it is always possible to add the required
2.2 Modelling an attack
The goal of risk assessment is to determine the likelihood that the identifiable threats of a system will harm, weighting their oc-currence with the damage they may cause. A risk assessment method is a procedure to define the risk of the occurrence of one or more threats.
The starting point is to consider a system as a composition of communicating black-box elements; a link between the compo-nentsc1andc2, written as(c1,c2), means thatc1 may directly communicate with c2. Thus, the architecture of the system is modelled by the graphA=⟨C,L⟩whereCis the set of compo-nents andLis the set of links. Moreover, each component or link is assumed to be vulnerable: a vulnerability is a flaw or weak-ness in the design, implementation or management of a system or component that could be used to violate the security policy, as defined in [10].
The vulnerabilities are organised in a structure showing how they can be used to perform an attack, thought to as a goal to achieve. By recursively dividing each goal into sub-goals, a complex at-tack can be analysed. The resulting analysis provides a hierar-chical plan to perform the attack. This approach is the one of attack trees[11, 12], a well-known and widely-adopted method to describe attacks as goals to threaten a system: the attacks are naturally represented in a tree structure, with the main goal as the root node and the different ways of achieving it as children. In turn, each internal node represents an intermediate goal. There areandnodes andornodes, each one representing an immedi-ate sub-goal of the father node:ornodes are alternative ways to achieve the father goal;andnodes represent the steps (ordered from left to right) toward the achievement of the father goal; the leaves of the tree represent the system vulnerabilities.
Thus, the simplest risk assessment method that uses attack trees can be described as follows:
1. The threats to the system under examination are modelled using attack trees and to each vulnerabilityvis associated a valueε(v)on a given metric. This value is called the ex-ploitability(of the node) and it measures the difficulty to abuse ofvand to perform a successful attack.
2. The risk associated to the threat under examination is com-puted by recursively aggregating the exploitabilities along the attack tree: the exploitability of anorsub-tree is the lub the exploitabilities of its children, and the exploitabil-ity of anandsub-tree is the glb of the exploitabilities of its children.
The aggregated exploitability of the root node measures the fea-sibility of the attack. Since an attack tree is a finite object, and since the lub and glb operations are associative, it follows that only the binary∨and∧are needed to aggregate the exploitabil-ities along the attack tree.
Moreover, the finiteness of the attack tree assures that the calcu-lation of the aggregated exploitability terminates with the number
of tree nodes as a bound to the number of steps.
The simple method just described assumes no further knowledge on the system than the exploitabilities of the leaves in the attack tree. This method is perfectly adequate when it is possible to evaluate each vulnerability in isolation, as if it does not interfere with the other vulnerabilities. Also, this method implicitly as-sumes that the experts trying to assess the risk of a system agree both on the possible attack strategies and on the evaluation of each vulnerability.
2.3 Modelling dependencies
In most cases, the vulnerabilities of a system are dependent, that is, an attacker can use one of them to simplify the abuse of an-other one. Thus, there is a relation among the vulnerabilities that specifies how much easier becomes to abuse of thev vulnerabil-ity, broken every vulnerability in the setU. This relation is called adependencybetween the ordered pair(U,v)and its weight,
de-noted asε(v|U), measures the exploitability ofv, given the abuse ofU4. The valueε(v|U)is called theconditional exploitability
ofvgivenU.
Evidently, when the vulnerabilities are dependent one on the oth-ers, the previously defined simple risk assessment procedure is no more sound since the attack tree may not represent all the pos-sible attacks allowing to achieve the root goal from the identified vulnerabilities and following the attack plan.
Given a pair of dependencies(U,u)and(V,v), we say that(U,u)
isstrongerthan(V,v)ifu = v,U ⊆ V andε(u|U) ≥ ε(v|V),
meaning that it is convenient to abuse of(U,u)than(V,v)since
less components have to be violated or the result is easier to ob-tain. It is worth noticing thatε(v)=ε(v|∅). So,ε(v)must be less
thanε(v|V)for any non-emptyVto make the(V,v)dependency
significant.
The dependencies can be organised as an hypergraph D = ⟨W,D⟩, whereWis the set of all vulnerabilities andDis the set of dependencies. It is safe to assume that, for everyd∈D,dis not stronger than any other dependency inD, since only the strongest dependencies may influence a risk evaluation5. Thus, the graph
Dis really an hypergraph, having arcs from sets of nodes to a node, but it is not a multigraph. Hence, the cardinality ofDis bounded by|W|2|W|.
Therefore, the simple risk assessment procedure in Section 2.2 can be extended to consider dependencies.
1. The threats to the system under examination are modelled using an attack tree, as before.
2. The dependencies among identified vulnerabilities are in-troduced, considering also contextual, architectural and 4The chosen notation,ε(v|U), resembles a conditional probability asε(v)
re-sembles a probability. This is done on purpose to help intuition, although theε
function does not denote a probability measure.
5This is true because we perform a worst-case analysis; in an average-case
topological information. The dependencies among vulner-abilities are represented in the dependency graph D = ⟨W,D⟩. Moreover, an exploitability valueε(u|U)weights
each dependency(U,u)∈ D. The valuesε(u|∅)are equal
to the initial exploitability of the vulnerabilities, as in the simple method.
3. The exploitability of each vulnerabilityvis calculated from its dependencies: initially,ε0(v)=⊥and then
εi+1(v)=εi(v)∨ ∨∨ {ε(v|V)∧∧
w∈Vεi(w) : (V,v)∈D} (1) whose rationale is to update a value when it is convenient to use the dependency instead of the direct attack pattern. The functionεiis said to befinalwhen for allj≥i,εj=εi. 4. The risk associated to the threat under examination is
com-puted by recursively aggregating the final exploitabilities along the attack tree, as before.
It is not immediately evident that the procedure terminates, i.e., that there exists an indexisuch thatεiis final, although it is clear that the metric must be a complete lattice to apply the method, since the updating rule applies lubs and glbs on subsets of values.
Theorem 2.5 There is an indexisuch thatεiis final.
proof: Letnbe the number of vulnerabilities in the dependency graph and letkbe the cardinality of the metric. Assume that there is no indexisuch thatεiis final. Then, for everyi, there is avsuch thatεi+1(v)> εi(v). Sinceε0(v) =⊥, after at most
ksteps, not necessarily consecutive, the exploitability ofv be-comes⊤. Also, since at every step a vulnerability is updated, af-ternsteps, not necessarily consecutive, every vulnerability has been updated. Aftern·ksteps every vulnerability reaches the maximum value⊤and thus cannot be updated any further. So, at then·k+1step, no vulnerability can be updated, contradicting
the hypothesis. Thus, there exists an indexisuch thatεiis final and, moreover,i≤n·k≤n22n.
✷
The method just described assumes no further knowledge on the system than the conditional exploitabilities of dependencies, which are fixed. This method is perfectly adequate when it is possible to evaluate each vulnerability in relation to its dependen-cies and the dependendependen-cies do not vary in time. As in the case of the simple risk assessment procedure (Section 2.2), this method implicitly assumes that the experts trying to assess the risk on a system agree both on the possible attack strategies and on the evaluation of dependencies.
2.4 Composing metrics
The typical scenario where risk assessment takes place shows a pool of experts each one analysing the system under considera-tion. These experts work together, exchanging their views and evaluations. Usually, it is possible to obtain a common view of
the system architecture and of the possible vulnerabilities. More-over, usually the experts agree on the possible attacks since this information is construed in a cooperative effort. But, rarely the experts will agree on the evaluations of the impacts of attacks and on the weakness of the various vulnerabilities, since this informa-tion directly refers to the competitive nature of their knowledge. So, it makes sense to model the situation where each expert works on the system with a shared view of the possible attacks and the corresponding vulnerabilities, which amounts to say that each ex-pert agrees to work on the same attack tree and on the same de-pendency graph6. But, due to the differences in experience and
knowledge, each expert uses a distinct metric and assigns differ-ent exploitabilities to the vulnerabilities.
There is an evident strategy to combine the evaluations of the ex-perts in this case: if their evaluations could be mapped in a com-monmetric, then the “worst” evaluation is a measure of the risk associated to a particular threat. In formal terms, this requires to calculate the lub of the values corresponding to the experts’ evaluations in the common metric.
There are many possibilities to construct a common metric given a set of metrics. In previous works [6, 7] some of these ways have been introduced and discussed. Here, we want to analyse if it is possible to define amost generalcommon metric, that is, a canonical way to combine metrics so that every other way is, in a sense, a specialisation.
Different metrics have common points: the meaning of⊤and⊥ is always the same; also, the experts may agree on the interpre-tation of a few values in their metrics (“when I sayhard, you say
7”). So let us assume to have a correspondence among values
that shows what is equivalent in two distinct metrics. The obvi-ous requirement on such a correspondence is soundness, i.e., ifa is equivalent tobandcis equivalent todanda≤c, then it must not be thatd<b.
In view of the final outcome we will get, we start from a slightly stronger assumption: the common values form a metric. So, if we have to combine the metricsAandB, we assume to have a metricEalong with a pair of mapse1: E→ Aande2: E →B whose meaning is that, for everyx∈E,e1(x)∈Ais equivalent toe2(x)∈B. The use of maps to capture the identified elements suggests that the right instrument to mathematically formalise the problem is Category Theory [13]. In fact, it is immediate to see that the set of metrics and the order-preserving functions respect-ing⊥and⊤is a category.
Definition 2.6 Met is the category whose objects are metrics and whose arrows are the functions f preserving≤,⊥and⊤, i.e., x≤yimplies f(x)≤ f(y), f(⊥) =⊥and f(⊤)=⊤. So,
the arrows preserve the order and the bounds of the metrics.
In categorical terms, given two metricsAandBwhere some val-ues are identified viae1: E →Aande2:E → B, our problem 6Evidently, it makes sense to consider also the opposite situation. An
is to find the pushoutP(along with the f andgarrows) in the commutative diagram
E e1 //
e2
A
f
B g //P
In fact, when it exists, the pushout of the diagram
Aoo e1 E e2 //B
is, intuitively, the most general object (up to isomorphisms) con-taining bothAandBwhere the elements inEare identified. The universal nature of the pushout assures that, if it exists, thenP is the most general combination ofAandB, which identifies the values inEin the sense that every other combinationXcontains Pup to a morphism. We will prove that there is no such a most general combination.
There are a few facts aboutMetwhich turn out to be useful. First, there is a “minimal” metric.
Proposition 2.7 Methas an initial object.
proof: Let 0be the metric whose domain is{⊥,⊤}with the only possible order relation. The canonical injection! : 0 ↩→ A is the unique function preserving⊥and⊤; moreover, it trivially
preserves the order. ✷
Second, given two metrics, it is possible to “glue” them in a canonical way that keeps their individual nature.
Proposition 2.8 Methas binary co-products.
proof: LetAandBbe metrics, we have to show that there is an objectCtogether with a pair of arrowsjA: A→CandjB: B→ Cthat is the co-limit of the discrete diagramA,B.
In fact, letC be the disjoint union ofAandBwhere the pairs (⊤A,⊤B)and(⊥A,⊥B)are identified and where the order is nat-urally defined as the union of the given order relations. It is im-mediate to show thatCis, indeed, a metric.
Also, let jA and jBbe the embeddings ofAandBrespectively intoC; these functions trivially preserve≤,⊤and⊥.
LetXbe any metric, and let f: A→Xandg: B→ X. Define q:C→Xas
q(x)=
{
f(x) ifx∈A g(x) ifx∈B .
Because of the definition ofC, f(⊤)= g(⊤) =⊤and f(⊥) =
g(⊥) = ⊥, soqis well-defined; also,q preserves≤,⊤and⊥ since f andgdo so. Henceqis an arrow inMet. Also, being
fully determined, it is clear thatqis the unique arrow making the following diagram to commute:
A jA //
f
? ? ? ? ? ?
? C
q
B
? _
jB
o
o
g
X
Hence,Calong with the canonical injections is the required
co-product. It will be denoted asA⨿B. ✷
Third, inMet, any pushout can be written as the co-equaliser of a co-product. This follows from
Lemma 2.9 In a category having initial objects, binary co-products and co-equalisers, every pushout is the co-equaliser of a co-product.
proof: Let the following diagram denote a given pushout
A f //
g
B
pB
C p
C
/
/P
Then, beingB⨿Ca co-product,
C jC //
pA
"
"
E E E E E E E E
E B⨿C
!
B
? _
jB
o
o
pB
|
|
yyyy yyyy
y
P
and, applying the universal properties of pushouts,
A jB◦f //
jC◦g
/
/B⨿C
! //
"
"
E E E E E E E E
E P
!
X
commutes, thusPand the unique arrowB⨿C → Pforms the
required co-equaliser. ✷
The last property of Metwhich is required to show the impos-sibility to construct pushouts in general, is that every pushout in Met naturally generates a pushout inSet, the category of sets whose arrows are all the functions.
Lemma 2.10 LetF: Met → Setbe the forgetful functor, then every pushout B → P ← Cof the diagramB ← A → Cin
Metgives a pushoutF(B) → F(P) ← F(C) of the diagram F(B)←F(A)→F(C)inSet.
• F(⟨O,≤⟩)=O;
• F(f:⟨A,≤A⟩ → ⟨B,≤B⟩)= f:A→B.
Consider the pushout diagram
A f //
g
B
pB
C p
C
/
/P
sincepC◦g=pB◦f, it follows by definition ofFthatF(pC)◦ F(g)=F(pB)◦F(f). So, the same diagram transformed viaF commutes inSet.
Similarly, the universal property of the diagram inMetholds in the transformed diagram inSet. Thus, the transformed diagram
is a pushout of Set. ✷
Summarising,Methas an initial object, binary co-products and every pushout gives raise to a pushout inSetvia the forgetful functor. By Lemma 2.9, every pushout
E eB //
eA
B
pB
A p
A
/
/P
inSetis the co-equaliser of a co-product. This amounts to say, see [14], thatPis the quotient of the disjoint union ofAandB by means of the equivalence relationeidentifying the elements ofAandBsuch thateA(x)=eB(x), forx∈E.
Thus, if the following diagram is a pushout inMet
E eB //
eA
B
pB
A p
A
/
/P
thenPis a complete lattice whose domain is the quotient of the domains ofAandBby means of the equivalence relation gener-ated bye={(e1(x),e2(x)) : x∈E}. Since every pushout inMet is the co-equaliser of a binary co-product, thanks to Lemma 2.9, it suffices to show an example where the co-equaliser does not exist in order to show thatMetdoes not have pushouts, in gen-eral.
Now, take the following lattice asE
• •
• •
α ❅❅β
❅❅
andAandBas two copies of the lattice
• •
• • •
• a ❅❅b
❅❅
Thus,A⨿Bis
• •
• • • •
• •
• •
A B
❅❅ ✁
✁ ❆❆ ✁ ❆❆✁
❆
❆ ✁✁ ❆ ✁✁❆
❅ ❅
Let f: E→Abe defined as
f(x)=
⊤ whenx=⊤ a whenx=α
b whenx=β ⊥ whenx=⊥
and letg:E →Bthe same onB. Evidently, f andgare arrows inMet.
Now, the diagram
E jA◦f //
jB◦g
/
/A⨿B
does not have a co-equaliser inMet. In fact, such an objectQ must be a co-equaliser also inSet, thus it must be thatQ=(A⊔ B)/r, the quotient of the disjoint union of the domains ofAand Bby means of the equivalence relationr, defined asr = (e∪ e−1)∗, wheree
={(f(x),g(x)) : x∈ E}. Now, the only possible
order relation overQwhich allows a functionq:A⨿B → Q preserving the order ofA⨿Bis given by the relation≤Q=≤A⊔B/r as easily proved in elementary algebra, since necessarilyq(x)= [x]r, the equivalence class with respect torcontainingx.
But⟨Q,≤Q⟩is
• •
• •
• •
• •
❅❅
❍❍❍❍
❍❍❍❍
✟ ✟ ✟
✟ ✟✟
✟ ✟ ❅ ❅
so it is not a metric, not being a lattice.
Hence, Methas no pushouts, or, in the original problem, it is not always possible to find the most general combination of two metrics, given a sound identification of values.
Since we have shown thatP=(A⊔B)/rwithr=(e∪e−1)∗and
A natural question is whether it is possible to impose conditions onA,BandE, or, alternatively, oneA: E→AandeB: E→B, such that⟨Q,≤Q⟩is a lattice, thus forming the required pushout inMet.
Proposition 2.11 LetT be the finite and bounded order whose Hasse diagram is
• •
• •
• •
❅❅
❍❍✟❍❍✟
✟ ✟ ❅ ❅
Then, there ist:T →Pmono if and only ifPis not a lattice.
proof: SupposePis a lattice. If there is such a mapt,Pcontains Tas a suborder, which is clearly impossible since the strict lower sets of the images of the topmost values just below the top are equal while the values differ.
Vice versa, beingPa finite and ordered set, there areq1,q2∈Q distinct with at least two different lubs. So, we can find a subor-der ofQhaving as points⊥,q1,q2,⊤and the two lubs, which is the image ofTvia an appropriate definition oft. ✷
Considering the counterimage ofT inA⨿Bviaq: x 7→ [x]r,
it is easy to see that a co-equaliser inSetmust equate a pair of uncomparable values inAwith a pair of uncomparable values in B. Thus a “fork” must exist inE. Hence, a sufficient condition to forcePto be a lattice is to requireEto be a linear order. Moreover, applying the proposition in a different way, there must be a pair of forks inPsharing the same base and whose apexes are distinct, so that inA⨿Bthe counterimages of the base points are equated byqwhile the counterimages of the apexes are not. Thus, a sufficient condition to ensurePto be a lattice is to require that every lub and glb of uncomparable values inAandBmust be in the image ofeA andeB, respectively. Formally, for every x,y∈Asuch thatxandyare uncomparable inA,(x∧y)∈eA(E) and(x∨y)∈eA(E), and analogously forB.
3 An Illustrating Example
In this section, we show a simple example that illustrates the ma-jor points we developed so far. Despite its simplicity, it resem-bles a real situation, allowing for a deeper insight on the meaning of our findings.
Consider a train company with an automatic system to sell tick-ets. A traveller can buy a ticket from the ticket dispenser, an auto-matic vending machine, located inside the train station. The dis-penser is just a dedicated station to access the company web site. The dispenser is able to sell a ticket, given the destination, the de-parting time and the name of the traveller plus his/her credit card. Moreover, the dispenser allows to modify a sold ticket given the traveller name and the ticket number, eventually asking for an
additional fee or refunding the difference. A traveller is allowed to modify any of the traveller’s name, the destination and the de-parting time.
Before a traveller can access a train, s/he has to pass a ticket check. There, an human employee asks the traveller for his/her ticket and checks whether it is valid; also, the traveller must ex-hibit a document to prove his/her identity.
The company is satisfied by this system since it proves to be very economical and secure, but it worries about people trying to take the train without paying the ticket. This may happen, as the com-pany has experienced, because some last-minute jumpers wait until the train is about to depart and then, with some trick, they try to convince the employee that they are late so to have a light check of their invalid ticket. To solve this problem, the company asks Alice and Bob, two security analysts, to assess the risk as-sociated to the event “someone gets the train but no one has paid his/her ticket”.
• •
• •
✒ ✲
❄
security checkpoint ticket dispenser
database web server
Figure 1: The system architecture of the example.
Goal: get the train without paying
1: Cheat the employee at the security checkpoint 1.1: Give a false identity (V1)
OR 1.2: Corrupt the employee (V2)
OR 2: Break the web server security at the dispenser 2.1: Inject code (V3)
OR 2.2:Guess another traveller’s ticket number and name (V4)
Figure 2: The attack plan for ”Take the train without paying for the ticket.”
so to get a reissue of the ticket. Alternatively, George may try to cheat the web server beside the dispenser, trying to create a new ticket in the database. To this aim, he can access the dispenser by modifying a very economical ticket and trying to put something strange (code injection) in the form on the web page.
• •
• •
✻ ✛
V4 V1
V2 V3
Figure 3: The dependencies in the example.
Since forcing the security of the web server from the ticket dis-penser simplifies to show a new identity to the security gate, the dependency graph is as in Figure 3.
Now, Alice and Bob have to evaluate the vulnerabilities and the dependencies: they agree that the human trust is incomparable with the web server security, but they disagree on the way to measure these aspects of the system.
• •
• •
•
• •
• •
❅❅
❅❅
⊥
0
A 1
2
B 3
4
⊤
Figure 4: Alice’s metric
Alice uses a security scanner to trace the vulnerabilities of the technological parts of the system: the security scanner provides a value for each vulnerability in the integer range0to5. Alice
decides that0means “secure up to current knowledge”, so she
uses5as the⊤of her metric, while0is a value just above⊥. She decides that human beings are not as trustable as computers (a common attitude among security analysts), so she decides to use the value A for a trustable human, the valueBfor a non-trustable human, and4for a combination of non-trustable human
using a non-trustable computer. The resulting metric is shown in Figure 4.
Using her metric, Alice states that her initial exploitabilities are ϵ0(V1) = A,ϵ0(V2) = 0, ϵ0(V3) = 0and ϵ0(V4) = 2. She evaluates that the conditional exploitabilities areϵ(V1|V4) = 4 andϵ(V1|V3) =4. Applying up to the fixpoint the formula (1), she finds thatϵ(V1)=4,ϵ(V2)=0,ϵ(V3) =0andϵ(V4)=2, and thus the aggregated evaluation of the attack goal is4. The
reader is invited to notice how dependencies influenced the final evaluation.
Bob uses three levels of human risk (H1,H2andCH3) and three levels of computer risk (C1,C2andCH3); the highest valueCH3 is common and it happens when a risky individual uses a non-trustable computer. Since things can always go worse, he decides
•
• •
• •
• •
❅❅
❅❅
⊥ H1 C1 H2 C2 CH3 ⊤
Figure 5: Bob’s metric
that⊤is above the common value; also, he is convinced that a level of risk is never null, so⊥is below both minima in his personal metric. The result is depicted in Figure 5.
Bob states that the exploitabilities of the system vulnerabilities
areϵ0(V1)=H2,ϵ0(V2)=H1,ϵ0(V3)=C1andϵ0(V4)=C2. He
evaluates that the conditional exploitabilities areϵ(V1|V4)=H2
andϵ(V1|V3) = H2, in fact, choosing to apply the simple risk
assessment procedure, thus the initial evaluations are also the fi-nal ones. Hence, the aggregated exploitability of the root goal is
CH3. The reader is invited to notice that the way to obtain the
simple risk assessment procedure from the one using dependen-cies is general.
•
• •
• •
•
❅❅
❅❅
⊥
H1−A C1−1 H2−B C2−3
⊤
Figure 6: How Alice and Bob compare their metrics.
Since Alice and Bob agree on the evaluation principle that human and computers are incomparable, they identify the “pure” values in their metrics. Specifically, the valueX−Y inE, the identifi-cation metric shown in Figure 6, means that the valueXin Bob’s metrics is identified with the valueY in Alice’s. Evidently, ⊤ and⊥are always identified.
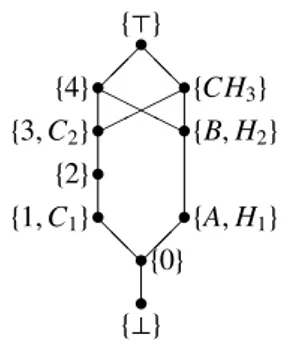
A few calculations say the co-equaliser inSetis{{⊥},{0},{1,C1}, {2},{3,C2},{4},{A,H1},{B,H2},{CH3},{⊤}}, and the corre-sponding partial order is
• •
• •
•
• •
• •
•
❅❅
❍❍✟❍✟
✟
❅❅
{⊥} {0}
{A,H1} {1,C1}
{2}
{B,H2} {3,C2}
{4} {CH3} {⊤}
which is not a lattice since, e.g., the lub of{3,C2}and{B,H2}is not unique.
The result is ϵ(V1) = {4}, ϵ(V2) = {A,H1}, ϵ(V3) = {1,C1} andϵ(V4)={3,C2}. But, if the initial evaluation of Alice onV2 would have been1, her finalϵ(V2)would have been1, as well; in this case, the combination would not have been possible, since, in the combined structure, the lub of1andH1is either{4}or{CH3}, due to the fact that the combination of Alice and Bob’s metrics is not a metric. Hence, the limiting result on the combination of metric has a practical value since it applies also to our experts’ evaluations.
4 Related works
In literature there are many attempts to face the risk assessment problem; some of them define systematic approaches while oth-ers provide more ad-hoc methods to evaluate the likelihood of (a class of) violations. Even though the application of risk evalua-tion methodologies has been widely discussed and analysed, see, e.g., [15, 16, 17, 18], among information security experts there appears to be no agreement regarding the best or the most appro-priate method to assess the possibility of computer incidents [19]. In particular, we have found of interest Baskerville’s [20] de-scription of the evolution of various ad-hoc methods to measure risk that sometimes could be combined to improve the accuracy of the security evaluation.
On the side of systematic approaches, S. Evans et al. [21] present a system security engineering method to discover system vulner-abilities and to determine what countermeasures are best suited to deal with them: the paradigm of this work isanalysing infor-mation systems through an adversary’s eyes.
Differently, [22] provides a probabilistic model that measures se-curity risks. It is possible to calculate risk starting from hybrid values of a quantitative and/or qualitative nature.
With respect to the previous works, our approach, starting from its initial definition in [1], has been based on the structured eval-uation of single vulnerabilities along with their mutual depen-dencies. In this respect, the results in [21] are similar to ours, although they do not propose a formal method based on math-ematical arguments. In fact, the distinctive aspect of our work with respect to the discussed ones is the mathematical formalisa-tion of the risk assessment method in order to derive its character-ising properties. Also, the use of hybrid values in [22] resembles our approach to metrics as algebraic structures, even though, we do not map them down to probabilistic estimates.
There are more formalised approaches in literature, employing a graph-based representation of systems and their vulnerabili-ties, that provide methods whose properties are, at least partially, mathematically analysed. Among those approaches, of promi-nent interest are those based on attack graphs [23, 24], where state-transition diagrams are used to model complex attack pat-terns. In particular, [23] proposes the use of attack graphs to automate the step of hardening a network against a multi-step intrusions. The proposed security solution is expressed as an ad-justable network configuration rather than a set of
countermea-sures to possible exploits.
Similarly, [25] divides a system into domains and each sub-domain could be characterised by vulnerabilities. Applying probability theory and graph transformations [25] evaluates the possibility that a insecurity flow exploits some vulnerability to penetrate into the system. The extreme consequence of this fam-ily of approaches is to use model-checking techniques to simulate attacks, like in [24].
In this respect, our approach is simpler both in the method and in its formalisation. Despite its simplicity, our results are stronger on the mathematical side and some experimentation [2, 4, 5] make evident the practical value of the method in real-world sit-uations. In fact, we use the attack tree model [11, 12] to evaluate the security threats combining them with the dependency graph, a formalisation of a piece of experts’ knowledge. This combi-nation is part of the subject of our mathematical analysis, and being a richer structure than the simple attack trees, we are able to derive stronger properties for our method [7].
On a rather different comparison line, the software component paradigm in software engineering has received a great deal of interest from both industry and academia since it allows the reusability of components and a natural approach to distributed programming. A software component is independently devel-oped and delivered as an autonomous unit that can be combined to become part of a lager application.
Despite its evident benefits, the component interdependence is often ignored or overlooked [26], leading to incorrect or impre-cise models. In order to avoid this problem, complete models should be specified taking into account system interconnections. In agreement with this point of view [26, 27, 21, 22, 19] present models for assessing security risks taking into account interde-pendence between components.
Particularly, [26] uses techniques for automating and enhancing risk assessment studies of technological processes using quali-tative models. A set of fundamental parameters and primitive functions are defined for the domain from which the system be-haviour is derived, detecting a number of interesting interdepen-dencies among components.
Similarly, [27] defines a model based on security policy and in-dividual risks. The model gives the possibility to evaluate if the risk associated to each transaction is acceptable. The evaluation of risk also takes into account context information.
It is a fact that the evaluation metric behind exploitability deeply influences the risk evaluation. But, at least in our treatment, what matters is thestructureof the metric rather than its abso-lute value. Generalising, in many field of ICT there is the need to define an objective metric. In the abstract, a metric is defined as [28] the instrument to compare and to measure a quantity or a quality of an observable.
Our treatment of metrics follows the work of N. Fenton, in par-ticular [29]. In agreement with him, we consider measurement as the process by which values are assigned to attributes of en-tities, in our case to the exploitability of a vulnerability. There-fore, even though there is no widely recognised way to assess risks and to evaluate the induced damages, there are various ap-proaches that provide methodologies by which the risk evalua-tion becomes more systematic.
In particular, Sharp et al. [19] developed a scheme for proba-bilistic evaluation of the impact of the security threats and pro-posed a risk management system with the goal of assessing the expected damages due to attacks in terms of their economical costs. Z. Dwaikat et al. [27] defined security requirements for transactions and provided mechanisms to measure likelihood of violation of these requirements.
Looking toward risk assessment as a decision support tool, Fen-ton [30] proposed the use of Bayesian networks. He distinguishes between certain and uncertain criteria and points out the power of Bayesian networks to reason about uncertainty. Differently, our approach toward objective risk assessment is based on the abstraction over values, thus what matters in our treatment is the structureof the metrics. Hence, objectivity is gained by con-sidering values in the metric not asabsolute measures of risk, but, instead, as relative evaluations. Therefore, in agreement with [26, 21, 30, 22], the information computed by our model can be used as a decision support.
5 Conclusions
This paper wanted to introduce a mathematical framework to jus-tify risk assessment methodologies. In this sense, the methods we presented areminimal, that is, the simplest one can conceive given our assumptions. The assumptions we started from are generally accepted by the engineering community as shown in the related works.
It is relevant to notice that our results have been compared with works outside the original application area of our method. In particular, our claim as stated in the Introduction, that our inves-tigations can be generally applied to technolgical systems is sup-ported by the comparisons with the related works in, e.g., soft-ware engineering.
Although some improvements have been made on our previous findings, see [3, 4, 5, 6, 7], the novel result and the main contri-bution of this paper is the negative answer to the question “there exists the most general combination of two metrics given a sound identification of values between them?” To derive this result a
more mathematical approach has been adopted, showing that the category of metrics does not have all the co-limits and interpret-ing the desired combination as a push-out, a specific instance of co-limits. This result required a neater reformulation and a bet-ter understanding of the formal definition of our risk assessment method. This deeper and refined analysis has been presented here for the first time. Also, the use lattice algebra and category the-ory to handle evaluation metrics is innovative in the field of risk assessment methodologies, as far as the authors’ know.
In our opinion, the development of risk assessment methods in-side strong mathematical frameworks is the most promising way to study them as more than mere “good practises”. In this sense, our results show a first concrete step in this direction.
A possible future development is to study the application of our mathematical framework on different technological fields, e.g., industrial engineering, or on human-oriented areas, like medicine. We hope that some researcher with an expertise in those fields may be interested in extending our findings.
Acknowledgements
We wish to thank Prof. R. Melen of Università degli Studi di Milano-Bicocca for the fruitful discussions about some of the preliminary results.
References
[1] S. Sicari, D. Balzarotti, and M. Monga, “Assessing the risk of using vulnerable components,” inQuality of Protection. Security Measurements and Metrics, D. Gollmann, F. Mas-sacci, and A. Yautsiukhin, Eds. New York, NY, USA: Springer-Verlag, Jun. 2006, pp. 65–78.
[2] M. Benini and S. Sicari, “Risk assessment: Intercepting VoIP calls,” inProceedings of the VIPSI 2007 Venice Conf. Belgrade, SB: IPSI Belgrade, Mar. 2007.
[3] M. Benini and S. Sicari, “A mathematical framework for risk assessment,” inNew Technologies, Mobility and Se-curity, H. Labiod and M. Badra, Eds., The 1st Interna-tional Conf. on New Technologies, Mobility and Security. Netherlands: Springer, Mar. 2007.
[4] M. Benini and S. Sicari, “Assessing the risk to intercept VoIP calls,”Journal of Computer Networks, vol. 52, no. 12, pp. 2432–2446, 2008.
[5] M. Benini and S. Sicari, “Risk assessment in practice: A real case study,”Computer Communications, vol. 31, no. 15, pp. 3691–3699, 2008.
[7] M. Benini and S. Sicari, “Risk assessment via partial or-ders,” Advances in Computer Science and Engineering, vol. 3, no. 1, pp. 19–46, 2009.
[8] G. Grätzer,General Lattice Theory, 2nd ed. Basel, CH: Birkhäuser, 2003.
[9] P. Johnstone, Stone spaces, ser. Cambridge studies in ad-vanced mathematics. Cambridge, UK: Cambridge Uni-versity Press, 1982, vol. 3.
[10] R. Shirey, “RFC 2828: Internet security glossary,” May 2000. [Online]. Available: http://www.ietf.org/rfc/ rfc2828.txt
[11] A. Moore and R. Ellison, “Survivability through intrusion-aware design,” CERT Coordination Center, Tech. Rep. 2001-TN-001, 2001.
[12] B. Schneier, “Attack trees,” Dr. Dobb’s Journal, vol. 24, no. 12, pp. 21–29, 1999.
[13] S. Mac Lane,Categories for the Working Mathematician, 2nd ed., ser. Graduate Texts in Mathematics. Heidelberg, DE: Springer, 1997.
[14] R. Goldblatt, Topoi: The Categorial Analysis of Logic. Mineola, NY, USA: Dover, 2006.
[15] F. den Braber, T. Dimitrakos, B. Gran, M. Lund, K. Stølen, and J. Aagedal, “The CORAS methodology: Model-based risk management using UML and UP,” in UML and the Unified Process, L. Favre, Ed. Hershey, PA, USA: IRM Press, 2003, pp. 332–357.
[16] C. Alberts, A. Dorofee, J. Stevens, and C. Woody, “In-troduction to the Octave approach,” Oct. 2003. [Online]. Available: http://www.cert.org/octave/approach_ intro.pdf
[17] B. Jenkins, “Risk analysis helps establish a good security posture; risk management keeps it that way,” pp. 1–16, 1998, white paper. [Online]. Available: http://www.nr. no/~abie/RiskAnalysis.htm
[18] T. Siu, “Risk-eye for the IT security guy,” pp. 1–20, Feb. 2004. [Online]. Available: http: //www.giac.org/certified_professionals/
practicals/gsec/3752.php
[19] G. Sharp, P. Enslow, S. Navathe, and F. Farahmand, “Man-aging vulnerabilities of information system to security in-cidents,” inProceedings of the 5th International Conf. on Electronic Commerce. New York, NY, USA: ACM Press, 2003, pp. 348–354.
[20] R. Baskerville, “Information system security design meth-ods: Implications for information systems development,” ACM Computing Surveys, vol. 25, no. 4, pp. 375–412, 1993.
[21] S. Evans, D. Heinbuch, E. Kyle, J. Piorkowski, and J. Wal-lener, “Risk-based system security engineering: Stopping attacks with intention,”IEEE Security & Privacy Maga-zine, vol. 2, no. 6, pp. 59–62, 2004.
[22] M. Sahinoglu, “Security meter: A practical decision-tree model to quantify risk,”IEEE Security & Privacy, vol. 3, no. 3, pp. 18–24, May/June 2005.
[23] S. Noel, S. Jajoidia, B. O’Berry, and M. Jacobs, “Efficient minimum-cost network hardening via exploit dependency graphs,” inProceedings of 19th Annual Computer Secu-rity Applications Conf. Los Alamitos, CA, USA: IEEE Computer Society, 2003, pp. 86–95.
[24] O. Sheyner, J. Haines, S. Jha, R. Lippmann, and J. Wing, “Automated generation and analysis of attack graphs,” in Proceedings of the 2002 IEEE Symposium on Security and Privacy. Washington, DC, USA: IEEE Computer Society, 2002, pp. 273–284.
[25] I. Moskowitz and M. Kang, “An insecurity flow model,” in Proceedings of the 1997 Workshop on New Security Paradigms. New York, NY, USA: ACM Press, 1997, pp. 61–74.
[26] G. Biswas, K. Debelak, and K. Kawamura, “Application of qualitative modelling to knowledge-based risk assessment studies,” inProceedings of the 2nd International Conf. on Industrial and Engineering Applications of Artificial In-telligence and Expert Systems, M. Ali, Ed., vol. 1. New York, NY, USA: ACM Press, 1989, pp. 92–101.
[27] Z. Dwaikat and F. Parisi-Presicce, “Risky trust: Risk-based analysis of software system,” inProceedings of the 2005 Workshop on Software Engineering for Secure Systems — Building Trustworthy Applications. New York, NY, USA: ACM Press, 2005, pp. 1–7.
[28] S. Arshad, M. Shoaib, and A. Shah, “Web metrics: The way of improvement of quality of non web-based systems,” in Proceedings of the International Conf. on Software Engi-neering Research and Practice, H. R. Arabnia and H. Reza, Eds., vol. 2. Las Vegas, NV, USA: CSREA Press, 2006, pp. 489–495.
[29] N. Fenton, “Software measurement: A necessary scien-tific basis,”IEEE Transactions on Software Engineering, vol. 20, no. 3, pp. 199–206, 1994.