Universidade Federal do Rio Grande do Norte Centro do Biociências
Programa de Pós-Graduação em Psicobiologia
Carolina Pereira Cadório da Silva
Behavioural Profiles of Captive Capuchin Monkeys
(Sapajus spp.): analyses at group and individual levels
Dissertação apresentada à
Universidade Federal do Rio Grande do
Norte, para obtenção do título de
Mestre em Psicobiologia.
2
Carolina Pereira Cadório da Silva
Behavioural Profiles of Captive Capuchin Monkeys
(Sapajus spp.): analyses at group and individual levels
Dissertação apresentada à
Universidade Federal do Rio Grande do
Norte, para obtenção do título de
Mestre em Psicobiologia.
Orientador: Profa. Dra. Renata Gonçalves Ferreira
3 Catalogação da Publicação na Fonte. UFRN / Biblioteca Setorial do Centro de Biociências
Silva, Carolina Pereira Cadório da.
Behavioural profiles of captive capuchin monkeys (Sapajus spp.): analyses at group and individual levels / Carolina Pereira Cadório da Silva. – Natal, RN, 2015.
113 f.: il.
Orientadora: Profa. Dra.Renata Gonçalves Ferreira.
Dissertação (Mestrado) – Universidade Federal do Rio Grande do Norte. Centro de Biociências. Programa de Pós Graduação em Psicobiologia.
1. Bem-estar. – Dissertação. 2. Estratégias de enfretamento ao estresse. – Dissertação. 3. Sequências comportamentais. – Dissertação. 4. Rede social. – Dissertação. I. Ferreira, Renata Gonçalves. II. Universidade Federal do Rio Grande do Norte. III. Título.
4
Título:
Behavioural Profiles of Captive Capuchin Monkeys (Sapajus spp.):
analyses by group and individual levels
Autora:
Carolina Pereira Cadório da Silva
Data da defesa:
20 de Agosto de 2015
Banca Examinadora:
Profa. Dra. Renata Gonçalves Ferreira
Universidade federal do Rio Grande do Norte, RN
Profa. Dra. Briseida Dôgo de Resende
Universidade de São Paulo, SP
5
Dedico este trabalho aos meus pais, familiares e amigos,
por todo o apoio e o retizar o eu so ho de ser i hi ológi a .
6
Agradecimentos
Foram três anos de muito aprendizado.
Desde que cheguei a Natal que o apoio, carinho e amizade de todas as pessoas que me acompanharam na minha estadia ajudaram à formação deste trabalho. Quero desde já agradecer a todas elas.
Em primeiro lugar quero agradecer à minha família. O meu porto de abrigo quando chegava Dezembro. Aos milhares de telefonemas e mensagens de carinho constantes.
À minha mãe, a minha guerreira, Paula Pereira. Um agradecimento especial por ser a pessoa que é, pelo coração gigante, e por nunca deixar que me falte nada. Obrigada pelo incentivo à mudança e paixão partilhada pelo Brasil.
Ao meu Pai, José Silva (não podia ser mais português, não é?). Nós batemos de frente, mas é com amor. E é com amor que me incentivou sempre a ir mais longe e a dar o melhor de mim, sem nunca desistir.
Às minhas velhinhas favoritas, Clara e Branca, obrigada pelo carinho.
Ao meu irmão, o meu ídolo, por quem tenho uma admiração desmedida. Por ter amolecido o meu coração e me ter ensinado a ser melhor pessoa.
Nelinho, Daniel e Miguel. Obrigada por fazerem parte da família. João Nuno, obrigada pela amizade há 22 anos.
7
Aos meus amigos que este país maravilhoso me ofereceu, muito obrigada. Mas, vamos tentar ir por partes:
À Mari Lee, minha amiga, colega de casa e parceira de trabalho. Muito obrigada por todo o auxílio a oleta de dados. O igada ta é i ha fa ília aia a , família de Mari, pela maravilhosa recepção em Salvador.
Aos meus colegas de mestrado e do Co-Lab (abraço especial às minhas colegas Luciana Varella, Poliana Lins e Silvana Sita), foi ótimo partilhar esta experiência com vocês. Agradeço aos colegas Vanessa Lima e Clayton Emerson pela ajuda nos
t a alhos .
Aos amigos que o Bar do Thomas me deu: Carolzinha e Lais, valeu pela introdução na matéria; Kathiane, Cleanto e Anuska, obrigada pelas risadas; Felipe
a eça , a uela o pa hia os al oços e afte -hou s o o ida; Wall Hattori,
cuja ida para Minas antecedeu a minha e deixou muitas saudades, beijinhos para si, és
u po to ; Lau a Cl udia , ag adeço a pa tilha do ull i g; Julia Dido et, o igada
pela parceria e apoio nestes últimos meses, com certeza foste um suporte enorme.
Às minhas psico-gatas: Luana Lopes e Verónica Silveira. Agradeço todas as saídas, comidas e risadas. Vou guardar todos os momentos no coração.
Às i has oo ates , Lau a Ho da e Vi a Ped oza, e suas filhas, Lu e
E e a e Madale a e Apa e ida . À Lau i ha pelos passeios, fotografias, músicas e
8
Há três amigos a quem devo um agradecimento especial: Julia Dombronski, Daniel Wajss e Eduardo Bitencourt. Esse trio maravilha com quem passei os melhores momentos em Natal. Julinha, és a minha parceira para a vida; obrigada por tantas
pala as de apoio e fala es ue sou fe a ; a o fia ça o eu trabalho também se
deve a ti.
O meu agradecimento maior vai para a minha querida orientadora: Prof. Dr. Renata Ferreira. Obrigada por me ter aceite no dia que bati na sua porta e por nunca me ter falhado. Por todo o conhecimento e por ser o pilar da minha formação: Namastê e Satyagraha!
A todos os professores do departamento: obrigada por me terem feito sentir em casa neste últimos anos.
Agradeço também á banca por se ter disponibilizado a ler e discutir este trabalho.
Agradeço à Fundação Grupo Boticário pelo apoio financeiro para o desenvolvimento do projeto e à Coordenação de Aperfeiçoamento de Pessoal de Nível Superior (Capes) pela bolsa durantes os dois anos de mestrado.
9
O igada po e e si a e a te ais plasti idade o po ta e tal . P ee he a o
buraco que faltava na minha vida. Agora sou feliz!
Mi ha vida é a dar por este país
Pra ver se um dia descanso feliz Guardando recordações Das terras onde passei Andando pelos sertões e dos amigos que lá deixei
10
Index
List of Tables ... 12
List of Figures ... 13
Resumo ... 15
Abstract ... 16
Foreword ... 17
Chapter 1: Behaviour Potentially Indicative of Stress in Captive Capuchin Monkeys (Sapajus spp.): an exploration of methods for data analyses ... 21
Introduction ... 22
Methods ... 30
Subjects ... 30
Ethograms ... 33
Genus Normative Behaviours ... 33
Behaviours Potentially Indicative of Stress ... 34
Data collection ... 40
Data Analyses ... 42
Activity Budget ... 42
Frequency ... 42
Diversity Indices ... 43
Markov Chain and Sequence analyses ... 43
Social Network Analyses ... 45
Statistical Analyses ... 47
Results ... 48
Activity Budgets: GNB and BPIS ... 48
Frequency, Prevalence and Diversity of BPIS ... 50
Analyses by Sex, Species and Allocation type ... 51
Correlations GNB and BPIS ... 53
Markov Chains and Sequence Analyses ... 58
Social Network Analyses ... 61
Discussion ... 65
11 Chapter 2: Individual Differences in Stress Coping Strategies in Captive Capuchin Monkeys
(Sapajus spp.) ... 80
Introduction ... 81
Methods ... 86
Individual Differences Scores ... 87
Results ... 88
Individual Differences Based on a priori Classification ... 88
Individual Differences Based on Hierarchical Cluster ... 90
Discussion ... 94
References ... 99
Highlights ... 103
References ... 104
Appendix A: Exemple of behavioural data registry sheet. ... 105
12
List of Tables
Chapter 1 Page
Table 1. Group composition and enclosure distribution. 31
Table 2. Ge us No ati e Beha iou s (GNB) ethogram. Behaviours are
compiled in macro categories. 36
Table 3. Behaviour Potentially Indicative of Stress (BPIS). Behaviours are
compiled in macro-categories. 38
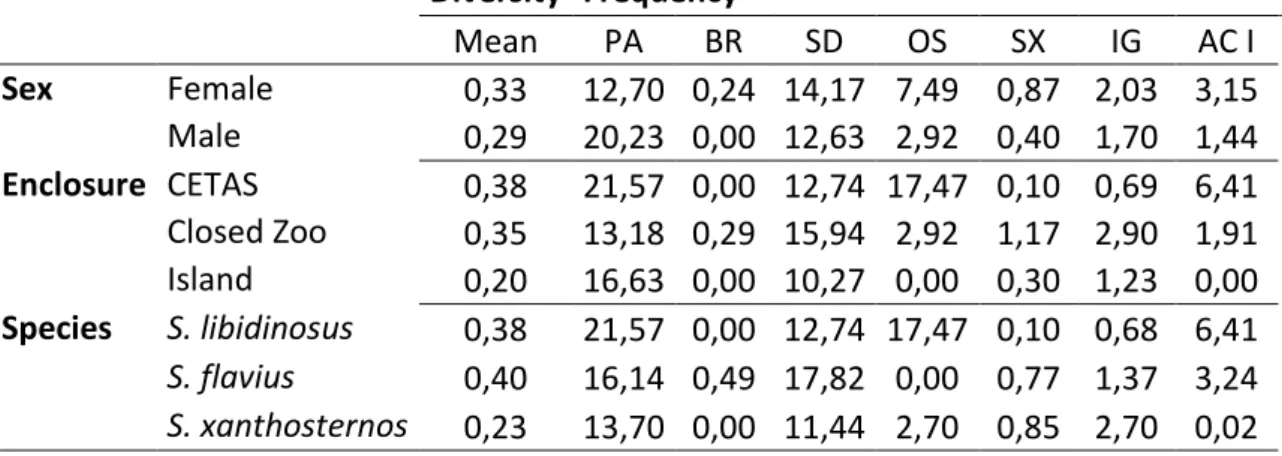
Table 4. Diversity of BPIS across variables sex, enclosures and species.
Frequency (bouts per hour) of BPIS (macro-categories) across sex, enclosures and species. PA: pacing; BR: body-rocking; SD: self-directed; OS: own-stereotypy; SX: sexual-display; IG: Ingestion; ACI: active I.
51
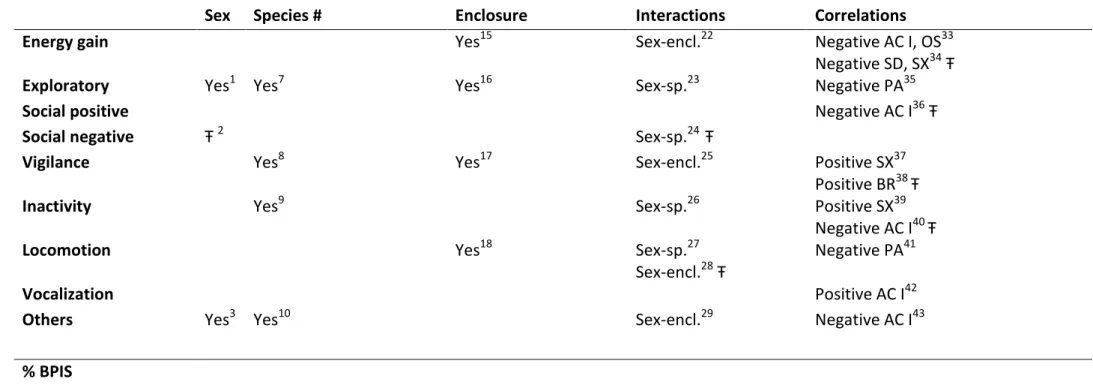
Table 5. Summary of all significant results across analyses (Yes: significant
esults; Ŧ: te de ; u e s i pote : F, χ , ρ a d p values under the
table).
55
Table 6. Ma ko hai s o de , a d , pe i di idual. O de is gi e the
BIC value calculated in R. 60
Table 7. Indegree, outdegree and betweeness per BPIS. 62
Chapter 2 Page
Table 1. I di idual s dist i utio = a oss Bold/Sh t pe a d E plo atio ,
Locomotion and Inactivity axis. 89
Table 2. Differences between Bold/Shy types across Exploratory, Locomotion
and Inactivity axis. Higher values are marked with *. SX: sexual-display; OS: own-stereotypy; AC: active I; IG: ingestion; in, out and bet: indegree, outdegree and betweeness, respectively.
90
Table 3. Mean rank of Exploration allocation time. 92
Table 4. Mean rank of Locomotion allocation time. 92
Table 5. Mean rank of Inactivity allocation time. 92
Table 6. Differences between groups based on hierarchical cluster analyses. PA: pacing; OS: own-stereotypy; SX: sexual-display; IG: ingestion. in, out and bet: indegree, outdegree and betweeness, respectively.
13
List of Figures
Chapter 1 Page
Figure 1, 2 and 3. 1. Female of S. libidinosus (Queen) engages in faeces-painting. 2. Female of S. flavius (Ruiva) observes environment. 3. Male of S. xanthosternos (Carlinhos) self-bites his arm. (Photos: Carolina Cadório).
32
Figure 4, 5 and 6. 4. Closed enclosure (left picture) at CETAS. 5 and 6. Closed
e losu es at Sal ado s zoo ight pi tu es , housi g S. flavius (Photos:
Carolina Cadório and Mariana Winandy).
32
Figure 7, 8 and 9: 7 and 8. Closed e losu e at Sal ado s zoo a d isla d left
pictures), housing S. xanthosternos. 9. Closed enclosure at CETAS (right picture). (Photos: Carolina Cadório and Mariana Winandy).
33
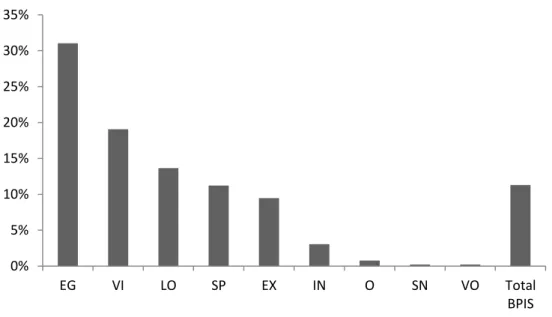
Figure 10. Activity budget with macro-categories of GNB and total BPIS. Results are presented in average percentage per total sample size (n = 26). EG: energy gain; VI: vigilance; LO: locomotion; SP: social positive activities; EX: exploratory; IN: inactivity; O: others; SN: social negative activities; VO: vocalization.
49
Figure 11. Activity budget and frequency for BPIS. Exact number of
individuals that displayed that behaviour is represented on top of each column. Activity budget is presented in mean percentage (columns, light grey) and frequency in mean bouts per hour (line, dark grey).
49
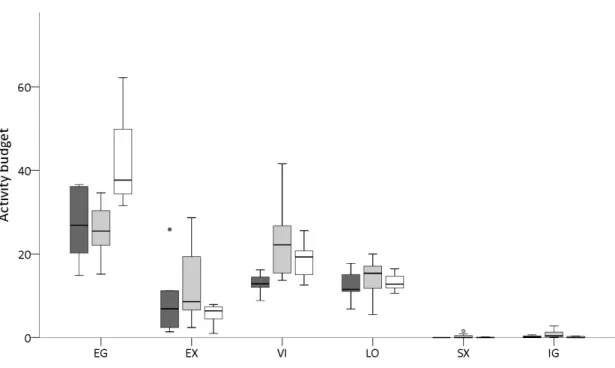
Figure 12. Differences in GNB and BPIS' activity budget, across enclosures (dark grey: CETAS; light grey: closed enclosures at zoo; white: island). EG: energy gain; EX: exploratory; VI: vigilance; LO: locomotion; SX: sexual-display; IG: ingestion.
52
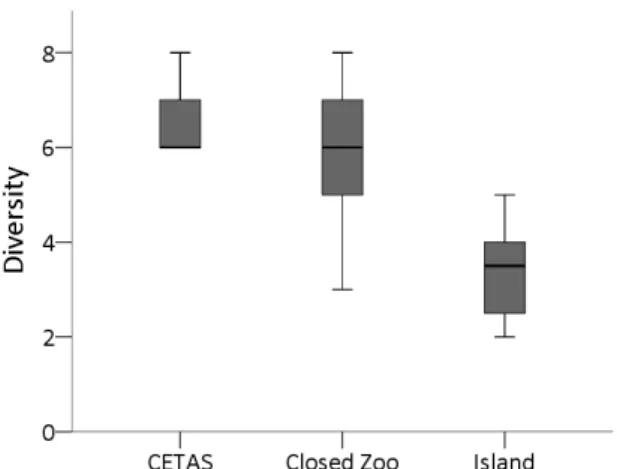
Figure 13. Differences in BPIS diversity across enclosures. 53
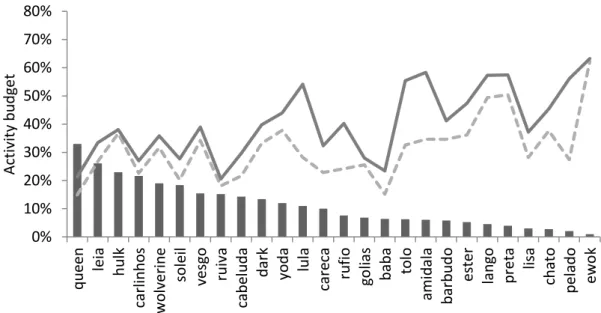
Figure 14. Negative correlation between total BPIS (bars) and exploratory
behaviours (line) and energy gain behaviours (dots). Values are presented per individual.
54
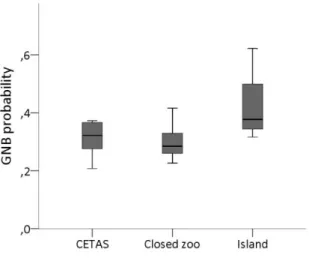
Figure 15. Differences in GNB occurrence probability across enclosures. 59
Figure 16. Differences in the probability of six step sequences of GNB and in
the probability of sequences of five steps of GNB plus one BPIS, across enclosures.
59
Figure17. N significant transitions involving at least one BPIS 61
Figure 18. Significant BPIS that presented differences in indegree, outdegree
and betweeness. PA: pacing; AC: active I; IG: ingestion; SD: self-directed. In, out and bet: indegree, outdegree and betweeness, respectively.
63
Figure 19. Social network analyses for total transitional matrix (n = 26). Blue
nodes: GNB; red nodes: BPIS. Arrows point to the direction of the connection between behaviours. Blue nodes: EG: energy gain; EX: exploratory; LO: locomotion; SP: social positive activities; SN; social negative activities; VI: vigilance; IN: inactivity; VO: vocalization; O: others. Red nodes: PA: pacing; SD: self-directed; OS: own-stereotypy; IG: ingestion; AC I: active I; SX: sexual-display; BR: body rocking.
14
Chapter 2
Figure 1. Dendrogram showing the clustering of individuals across
Exploration axis. 86
Figure 2. Dendrogram showing the clustering of individuals across
Locomotion axis. 86
Figure 3. Dendrogram showing the clustering of individuals across Inactivity
15
Resumo
O uso de indicadores comportamentais de sofrimento e bem-estar de animais em cativeiro tem produzido resultados ambíguos. Em comparações entre grupos, aqueles em piores condições tendem a apresentar um aumento generalizado em todas as taxas de Comportamentos Potencialmente Indicativos de Estresse (BPIS), mas em comparações dentro de grupos, os indivíduos diferem nas suas estratégias de enfrentamento ao estresse. Esta dissertação apresenta análises para revelar o perfil comportamental de uma amostral de 26 macacos prego em cativeiro, de três espécies diferentes (Sapajus libidinosus, S. flavius e S. xanthosternos), mantidos em diferentes tipos de recinto. No total foram coletadas 147,17 horas de registros comportamentais. Explorámos quatro tipos de análises: Orçamento de Atividades, índices de Diversidade, cadeia de Markov e análise de Sequência, e Análise de Rede Social, resultando em nove índices de ocorrência e de organização comportamental. No capítulo Um exploramos diferenças entre grupos. Os resultados apoiam as predições de que existem diferenças mínimas entre sexo e espécie e são observadas diferenças maiores no perfil comportamental devido ao tipo de recinto: i. indivíduos em recintos com menos enriquecimento ambiental apresentaram um repertório de BPIS mais diverso e uma menor probabilidade de sequências de seis passos de Comportamentos Normativos de Género (GNB); ii. o número de transições comportamentais que incluíam pelo menos um BPIS foi superior em recintos menos enriquecidos; iii. índices de proeminência de BPIS indicam que estes funcionam como pontos fim de sequências comportamentais, e que a proeminência de três BPIS (locomoção aberrante, auto-direccionadas e activas I) foram maiores em recintos menores. No geral, estes dados não corroboram a ideia de que os BPIS têm um padrão repetitivo, com um efeito
ela a te, tipo a t a . Pelo o t io, a i age ue su ge é de que os BPIS são
ati idades ue i te o pe a o ga ização dos o po ta e tos, i t oduzi do uido
que compromete o orçamento de atividades ótimo. No capítulo Dois exploramos diferenças individuais em seis eixos de comportamento exploratório. Estes mostraram-se pouco correlacionados, o que indicam baixa correlação entre indicadores comportamentais de síndromes. No entanto, os resultados sugerem duas estratégias de enfrentamento ao estresse abrangentes, semelhantes ao padrão audaz/proactivo e tímido/reativo: macacos prego mais exploratórios apresentaram maior proeminência em locomoção aberrante, exibição sexual aberrante e ativas I, enquanto que animais menos ativos apresentaram uma maior probabilidade de sequencias com pelo menos um BPIS, e maior proeminência em estereotipia-própria. Macacos prego são conhecidos pelas suas capacidades cognitivas e flexibilidade comportamental, portanto, a procura de um conjunto de indicadores comportamentais de bem-estar consistente requer mais estudos e conjuntos de dados mais amplos. Com este trabalho, pretendemos contribuir para a criação de protocolos, com embasamento científico e estatisticamente corretos, para amostragem de dados comportamentais que permitam a comparabilidade de resultados e meta-análises, de qualquer que seja a interpretação teórica que possa receber.
Palavras-chave: Bem-estar, estratégias de enfrentamento ao estresse, sequências
16
Abstract
The use of behavioural indicators of suffering and welfare in captive animals has produced ambiguous results. In comparisons between groups, those in worse condition tend to exhibit increased overall rate of Behaviours Potentially Indicative of Stress (BPIS), but when comparing within groups, individuals differ in their stress coping strategies. This dissertation presents analyses to unravel the Behavioural Profile of a sample of 26 captive capuchin monkeys, of three different species (Sapajus libidinosus, S. flavius and S. xanthosternos), kept in different enclosure types. In total, 147,17 hours of data were collected. We explored four type of analysis: Activity Budgets, Diversity indexes, Markov chains and Sequence analyses, and Social Network Analyses, resulting in nine indexes of behavioural occurrence and organization. In chapter One we explore group differences. Results support predictions of minor sex and species differences and major differences in behavioural profile due to enclosure type: i. individuals in less enriched enclosures exhibited a more diverse BPIS repertoire and a decreased probability of a sequence with six Genus Normative Behaviour; ii.
number of most probable behavioural transitions including at least one BPIS was higher in less enriched enclosures; iii. proeminence indexes indicate that BPIS function as dead ends of behavioural sequences, and proeminence of three BPIS (pacing, self-direct, activeI) were higher in less enriched enclosures. Overall, these data are not supportive of BPIS as a repetitive pattern, with a mantra-like calming effect. Rather, the picture that emerges is more supportive of BPIS as activities that disrupt
o ga izatio of eha iou s, i t odu i g oise that o p o ises opti al a ti it
budget. In chapter Two we explored individual differences in stress coping strategies. We classified individuals along six axes of exploratory behaviour. These were only weakly correlated indicating low correlation among behavioural indicators of syndromes. Nevertheless, the results are suggestive of two broad stress coping strategies, similar to the bold/proactive and shy/reactive pattern: more exploratory capuchin monkeys exhibited increased values of proeminence in Pacing, aberrant sexual display and Active 1 BPIS, while less active animals exhibited increased probability in significant sequences involving at least one BPIS, and increased prominence in own stereotypy. Capuchin monkeys are known for their cognitive capacities and behavioural flexibility, therefore, the search for a consistent set of behavioural indictors of welfare and individual differences requires further studies and larger data sets. With this work we aim contributing to design scientifically grounded and statistically correct protocols for collection of behavioural data that permits comparability of results and meta-analyses, from whatever theoretical perspective interpretation it may receive.
Key words: Welfare, stress coping strategies, behavioural sequence, Social
17
Foreword
To behavioural biology the presence of patterns in diversity, and variation within the patterns, is neither a surprise nor a mystery. Darwin (1859) dedicated two chapters of his book O the Origins of Species by means of Natural Selection to exemplify variation in animals. A traditional interpretation of the theory is that variation is the raw material for evolution, that is, among the naturally occurring variation those best fitted will survive and reproduce, resulting in varied forms, each adapted to a particular environmental condition. This approach accounted for variation between species, or between populations, but had problems in explaining variations within the same population. According to Sober (1980) this view shares the Aristotelean perspective of natura state, that is, the e iste e of hidde st u tu es
hi h u ite di e se i di iduals i to atu al ki ds . The eal is i a ia t, a d a
variability is an anomaly resulting from interfering forces on the conditions that ensures the continuity of the natural state.
One hundred years later, Mayr (1994) argues that this approach is not at all in
a o da e to Da i s theo , a d that o e of the g eatest i sights f o Da i s
18
Phenotypic plasticity refers to the range of phenotypes that can be observed in the same species, population or individual (Foster, 2013). Different morphologies in non-reproductive traits of males and females of the same species (e.g. plumage in birds or body size in primates), or between individuals of the same sex in a population (e.g.. three different morphs of male lizards), or still during the lifetime of the same individual (e.g. caterpillars and butterflies) are all examples of phenotypic plasticity (Foster, 2013). Consistent differences between individuals in different environments reveal different exchanges (trade-offs) between levels of predation and resource acquisition. On a larger scale, differences in reaction norms could explain the choice of habitats or sexual partners by different individuals and, therefore, have important implications for the geographical distribution and evolution of species.
19
issue 5, 2013) is dedicated to discuss the functional and evolutionary origins of behavioural plasticity in behaviour patterns, as well as the developmental processes and the implications of the occurrence of these differences. Curiously, in order to study behavioural plasticity and flexibility one must first develop methods to identify behavioural patterns. Therefore constant refinement of methods of analyses are required.
On a practical level, studies on welfare and management of animals in captivity have shown that individuals exhibit behavioural patterns rarely seen in wild groups (called stereotypies or abnormal behaviours). These are interpreted as behavioural expressions of the animal trying to cope with the stress of highly altered environment. This suggestion is supported by studies showing that in comparisons between groups, those in worse condition tend to exhibit increased overall rate of Behaviours Potentially Indicative of Stress. However, intra-group the picture is not that clear. Individuals differ in susceptibility to pathologies, resilience and disease progression (e.g. Cavigelli, 2005). These differences are attributed to different cognitive appraisal of environmental stimuli, which, in turn, are attributed to differences in physiological profiles (with genetic and epigenetic bases), that is, these differences result from different norms of reaction to environmental stimuli and different ways of coping with stressors (coping styles). The focus turns to the understanding of different patterns of individual behaviours (e.g. proactive x reactive, not explorer x explorer), and in which environment / context different strategies would be most effective.
20
hypotheses of differences at group and individual levels. This study is part of a larger
esea h p oje t e titled Rei t oduction of blond capuchin monkeys (Sapajus flavius):
ite ia fo sele ti g i di iduals a d e epto a eas , hi h ai s to de elop p oto ols
to accompany the behaviour of capuchin monkeys found in environments highly altered by human actions – captivity or forest fragments - in northeast Brazil.
21
Chapter 1: Behaviour Potentially Indicative of Stress in Captive Capuchin
Monkeys (
Sapajus
spp.): an exploration of methods for data analyses
Carolina P. Cadório1*, Renata G. Ferreira1*,Mariana M. Winandy, Vanessa C. de Lima1, André G. Pereira 2
1Physiology Department, Universidade Federal do Rio Grande do Norte, Natal/RN, Brazil
2Mathematics Department, Universidade Federal do Rio Grande do Norte, Natal/RN, Brazil
*Corresponding authors
Periodical: Primates (Qualis A2) Status: to be submitted
Abstract: The use of behaviour as potentially indicator of stress (BPIS) of captive animals is equivocal. However, behavioural indicators of suffering and welfare in captive animals, has produced ambiguous results. Face validity predicts that BPIS will be more frequent and diverse in poorer environments. We studied a sample of 26 captive capuchin monkeys, of three different species (Sapajus libidinosus, S. flavius and
S. xanthosternos), kept in three different enclosure types. In total, 147,17 hours of data were collected using focal animal sampling, with registers at every 10 sec, during 10 min. Behaviours were registered according to an ethogram of 9 macro-behavioural categories and 10 BPIS. We explored four type of analysis: Activity Budgets, Diversity indexes, Markov chains and Sequence analyses, and Social Network Analyses, resulting in nine indexes of behavioural occurrence and organization, and those index were compered across groups: enclosure type, sex and species. Results support predictions of minor sex and species differences and major differences in behavioural profile due to enclosure type: i. individuals in less enriched enclosures exhibited a more diverse BPIS repertoire and a decreased probability of a sequence with six Genus Normative Behaviour; ii. number of most probable behavioural transitions including at least one BPIS was higher in less enriched enclosures; iii. proeminence indexes indicate that BPIS function as dead ends of behavioural sequences, and proeminence of three BPIS (pacing, self-direct, active I) were higher in less enriched enclosures. Overall, these data are not supportive of BPIS as a repetitive pattern, with a mantra-like calming effect. Rather, the picture that emerges is more supportive of BPIS as activities that disrupt organization of behaviours, introdu i g oise that o p o ises opti al activity budget.
22
Introduction
According to Mason & Latham, by 2004, an (under)estimative of 85 million animals may be suffering in farms, laboratory and zoos worldwide. Although the interest in animal welfare has increased over the last 20 years, the authors argue that there is still need for more studies on reliable and fast tracking indicators of welfare and suffering. In her long series of work, Dawkins (1990, 2003, 2004, 2006, 2008) argues that while health is the foundation of any welfare measure, when we move beyond basic physiological needs and start to ask whether animals have good
ps hologi al health, e i di ato s ust e defi ed a d tested. Beha iou , she
argues, is an important adjunct index as an early warning of physical health problems, and in its own right as external signs of fearfulness, frustration, contention and of what animals want.
23
baseline expect from captivity, and whether some species with more behavioural flexibility would fare better in human altered environments (fragments or captivity or city borders) are open questions ( Mason et al., 2013; Wingfield, 2013). Nevertheless, a rough pattern emerges that species with larger home ranges, omnivorous diet and larger group sizes would do worse in captivity (Abbott et al., 2003; Clubb & Mason, 2003; Pomerantz, Meiri, & Terkel, 2013a).
Another source of confusion regards the use of abnormal or stereotyped behaviours as indicators of welfare. Stereotypies have been described as repetitive behavioural patterns, invariant and without any apparent motive or goal (Dantzer & Mormede, 1983; Mason, 1991a). This definition has been used in several of studies, from wellbeing to animal cognition (Dantzer & Mormede, 1983; Dantzer, 1986, 1991; Garner, 2005; G. Mason, Clubb, Latham, & Vickery, 2007; G. J. Mason, 1991a, 1991b; Pomerantz, Terkel, Suomi, & Paukner, 2012). Stereotypies are often considered to be abnormal behaviours, because they differ in form, frequency or context, from behaviours displayed by free-living animals (Brilot, Asher, Feenders, & Bateson, 2009; Garner, 2005; Meehan & Mench, 2007). At the same time, stereotypies are e de i of captive animal populations (Birkett & Newton-Fisher, 2011) thence they are taken as signal of potential suffering. This defi itio led to a o ept that a i al s housi g facilities should allow the ani als to pe fo the ost atu al eha iou as possi le (Fraser, Weary, Pajor, & Milligan, 1997).
24
between groups, those in worse condition do exhibit increased overall stereotyped rate, but when comparing within groups, those individuals in better conditions tend to exhibit increased rates of stereotypy (Dawkins, 2003). While agreeing that stereotypies should be taken seriously, Mason & Latham (2004) lists four reasons why repetitive behaviours may not indicate decreased welfare: i. stereotypies as do-it-yourself
e i h e t , i hi h the a i al itself eates a ti it a d og iti e dist a tio f o
i po e ished e i o e t; ii. a t a effe ts , i hi h a i als would get calmer
th ough epetitio of o e e ts; iii. Ha it , i this ase epetitio of eha iou
would shift to an automatic process, named central control, that enables animals to perform regular and fast movements with minimal cognitive processing or sensory input, and finally; iv. Pe se e atio , hi h is the o ti uatio o e u e e of a activity without the appropriate stimulus. It would be an autistic-like disconnection to novel stimuli and maintenance of previously learned patterns. In the first two cases the performance of stereotypies would have beneficial consequences per se, and in the latter two cases, the stereotypy appears as a scars from past stress but that do not reflect the current welfare state (G. J. Mason & Latham, 2004). Therefore, different stereotypies may indicate different underlying phenomenon. Large sample sizes are needed – but not always achieved- to disentangle these phenomena.
25
resources available for data collection, and specific questions for each study. Nevertheless, comparability of data is an aim in science for it allows meta-analyses of the greater pattern.
While time allocation in activity budget analyses, frequency and diversity indices of GNB and BPIS are easy to calculate, it is long argued that blunt proportions of behaviours are too much coarse grained analyses, for it does not offer a picture of how the sequence of actions occurs over time (Escós, Alados, & Emlen, 1995; Rutherford, Haskell, Glasbey, Jones, & Lawrence, 2003). Asher et al., 2009 use the term behavioural organization to refer to the arrangement of behavioural states relative to each other in time and space, and in relation to other individuals or behaviours. Reznikova (2012), says that we need to read ethological texts
disti guishi g et ee egula a d haoti eha iou al patte s, for this is
26
In their review on recent methods for analyses of behaviour, Asher and collaborators (2009) list four promising methods to analyse organization of behaviour: Fractal analyses; Temporal analyses (here including Markov and Monte Carlo chain), Social Network analyses, and Agent-based modelling and simulation. Despite such improved analytical tools, results are still ambiguous. For example, in two studies cited by Asher et al. (2009), one found that self-similarity of the fractal dimension of vigilance behaviour in hens decreased under stress conditions (which is in accordance with the idea that stereotypies disorganize and compromises normal pattern behaviour). However, in another study, the fractal dimension of the locomotor behaviour in hens increased (that is, became more self-similar) in worse conditions (which is in accordance with the idea of stereotypies as repetitive patterns).
Lusseau et al. (2003, 2004, 2009) published a series of papers on the impact of boats on the behaviour of dolphins. The authors found that the behaviours exhibited a first order Markov chain dependency, that is, the current behaviour was dependent of the previous behaviour (which in the Lusseau case was registered at 15 min intervals). Besides, the transition probabilities differed in situations with and without boats, with the transitions involving socializing and resting decreasing and the ones involving diving increasing in the presence of boats.
27
central individuals (or hubs) that can be important as nodes for disease transmission (for example), or cut points (e.g., by removing one individual, a group may fragment in two). The advantage of this technique is that it offers individual and group level indices that can be used to compare among social organization of different groups (populations or species). Makagon and collegues (2012) list four uses for SNA to applied ethology: i. evaluate the spread of disease, information on abnormal behaviour; ii. regrouping or separation of animals; iii. evaluate the impact of social environmental on health, and iv. evaluate differences in resource and environment use according to social interactions.
The genus Sapajus, robust capuchin monkeys, is the second primate species with higher occurrence in northeast wildlife rescue centres (28,1%) according to Levacov et al (2011). The Wildlife rescue centres (Centro de Triagem de Animais Silvestres - CETAS) are supposedly housing for animals during a short period of time, until there is a better solution for their future. Unfortunately, this rarely happens, and animals are kept, most of the times, in small and overcrowded enclosures, for an undetermined period (do Nascimento, Schiavetti, & Montaño, 2013). If animals are not kept at CETAS, they are often sent to public governmental zoos (Vidolin, Mangini, Moura-Britto, & Muchailh, 2004).
28
listed as endangered by the IUCN: Sapajus flavius and S. xanthosternos, both with occurrence in northeast Brazil.
Throughout their range capuchin monkeys display an omnivorous diet and they are known for their behavioural diversity and cognitive capabilities, which include coalitions (Izar, Ferreira, & Sato, 2006) and the use of stones to crack open nuts and dig roots and sticks to probe on holes (Ottoni & Izar, 2008). Although there is one clear alfa male and female, they are also known for their tolerant social hierarchy, with harems of one male to three or four females found in different robust species, regardless of biome (Izar et al., 2012). Because of these characteristics capuchin monkeys are seen as good models for comparative analyses on the evolution of cognition and behavioural plasticity (Fragaszy et al, 2004).
Activity budget of wild animals is composed by 20% to 30% of foraging for fruits and insects (mostly), another 20-30% is employed in eating and further 20-30%
e plo ed i Lo o otio . So ial i te a tio o poses less tha % of i di idual s
activity budget. These proportions change depending on environmental conditions, for example, black-horned capuchins (Sapajus nigritus) spent 26% of time in locomotion and 38% of their time eating at Atlantic forest, while bearded capuchin monkeys (S. libidinosus) spent 41% of time in locomotion and 16% of time eating at the dryer biome of Cerrado (source: table 8 in Verderane, 2010).
29
Energy gain related behaviours accounted for 27%, vigilance for 25%, while BPIS composed a mean of 17% of activity budget.
In this manuscript we offer two ethograms for registering captive capuchins (Sapajus spp.) behaviour: one for Genus Normative Behaviour (GNB) (Jacobsen et al., 2010) and one for Behaviour Potentially Indicative of Stress (BPIS). The ethogram for GNB was adapted from the book Complete Capuchin, authored by Fragaszy, Visalberghi, & Fedigan, therefore, we refer to this book for readers to willing access the original sources. At least half of the BPIS are already listed at Boinski et al., 1999 seminal papers on behavioural and physiological indicators of welfare in single housed capuchin (Sapajus apella) monkeys. Overall these ethograms synthesize the descriptions of GNB and BPIS found in manuscripts published in scientific journals, scientific books and PhD thesis (see references in the tables). But descriptions are also based on personal observations and practice, and informal conversations with experts.
We explore four type of analysis: Activity Budgets, Diversity indexes, Markov chains and sequence analyses, and Social Network Analyses for GNB and BPIS macro-categories, in three different capuchin species (Sapajus libidinosus, S. flavius and S. xanthosternos), kept in three different enclosures. We test the following predictions:
Previous studies indicate lack or very small sexual differences in BPIS
exhibition in capuchin (Mendonça-Furtado, 2006; Polizzi di Sorrentino, Schino, Tiddi, & Aureli, 2012), hence we expect small sexual differences. Due to great behavioural flexibility of Genus, we expect small species
30
Enclosure type is reported as one important dimension for welfare (Beisner
& Isbell, 2009a, 2009b; Vandeleest, McCowan, & Capitanio, 2011), therefore we expect that:
o The a ou t of ti e o itted to BPIS f o i di idual s a ti it
will be higher in smaller enclosures
o BPIS will be more diverse and frequent in non-enriched and
smaller enclosures;
o If repetitive behaviour is indicative of stress then Markov chain
order and probability of sequences ending in one BPIS should be higher in smaller enclosures
o If BPIS disrupts GNB pattern then centrality indexes of BPIS
should be higher in smaller than in larger enclosures.
Methods
Subjects
In this research we focused on three species of tufted capuchins: bearded capuchin (Sapajus libidinosus), blond capuchin (S. flavius Schreber, 1774 - endangered) and yellow-breasted capuchin (S. xanthosternos Wied-Neuwied, 1826 - endangered), adding 26 individuals (table 1).
Data olle tio as ade at a go e e tal ildlife s es ue e t e CETAS i
the city of Natal (Rio Grande do Norte) a d at Sal ado s Zoo (Bahia), both in Brazil. At
Natal s es ue centre, the six S. libidinosus were kept in closed enclosures, of 23 m3
31
allowed outside view. At Sal ado s Zoo e o se ed t o spe ies, S. flavius and S. xanthosternos. The 7 individuals from S. flavius were maintained in two enclosures of similar sizes (124 m3) (fig. 5 and 6). The e losu es at Sal ado s Zoo a e ulti-cage complexes, of indoor and outdoor compartments, with environmental enrichment (e.g. branches and ropes). Similar to S. flavius, one S. xanthosternos group with 5 adult individuals is kept in a closed enclosure of approximately the same size (fig. 7), while the other group, with 8 adult animals, is kept in an island of 100 m2 (fig. 8). This habitat had more environmental enrichment than the closed enclosures.
Each observed group, except one, had juveniles in their composition (table 1). However, only adults and sub-adults were considered for this study.
Both Zoo s a d CETAS s a i als e e fed du i g the o ing period and had
water ad libitum. At CETAS animals were fed fresh vegetables, fruits, boiled eggs, dried dog food and, occasionally, a vitamin supplement. At the zoo, animals were fed fresh fruits and vegetables, boiled eggs, raw meat and primate dried food.
Most individuals came from apprehensions made by the governmental organ IBAMA. Unfortunately, the origin or amount of time that the animals have been at CETAS or zoo is unknown. Each animal was identified by physical characteristics such as coat coloration, body and head shape, tuft and face.
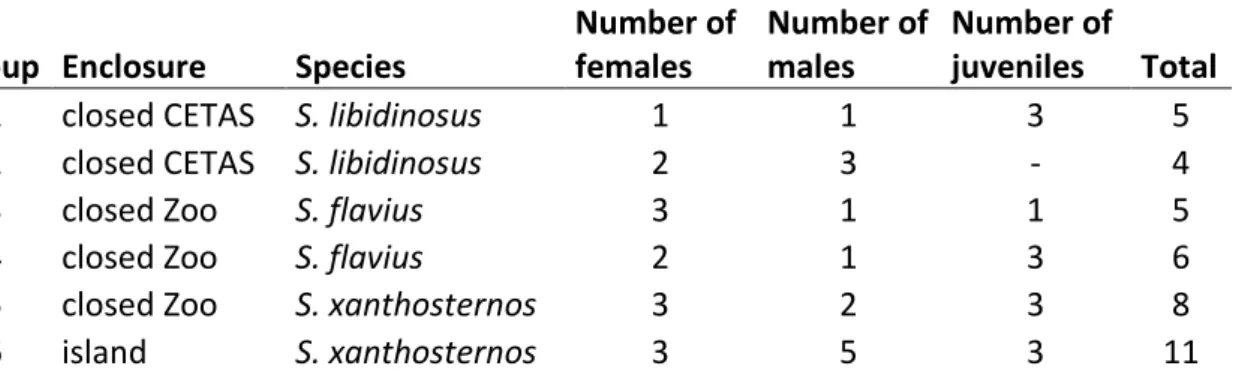
Table 1. Group composition and enclosure distribution.
Group Enclosure Species
Number of females
Number of males
Number of
juveniles Total
1 closed CETAS S. libidinosus 1 1 3 5
2 closed CETAS S. libidinosus 2 3 - 4
3 closed Zoo S. flavius 3 1 1 5
4 closed Zoo S. flavius 2 1 3 6
5 closed Zoo S. xanthosternos 3 2 3 8
32
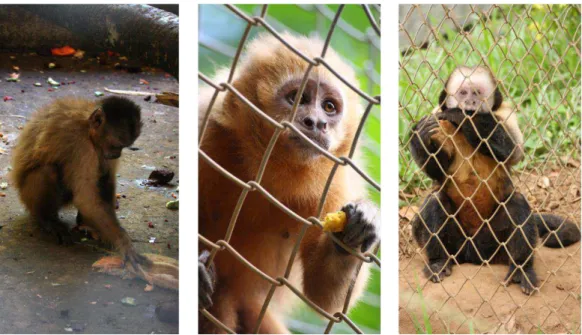
Figure 1, 2 and 3.1. Female of S. libidinosus (Queen) engages in faeces-painting. 2. Female of S.
flavius (Ruiva) observes environment. 3. Male of S. xanthosternos (Carlinhos) self-bites his arm. (Photos: Carolina Cadório).
33
Ethograms
Genus Normative Behaviours
Given the known behavioural flexibility exhibited by capuchin monkeys, it is at least risky to make a list of Species Normative Behaviour, or in this case, Genus Normative Behaviour (GNB). Nevertheless, part of the flexibility refers to differential allocation of time to the same basic functional behavioural categories.
In the ethogram, the GNB labels and definitions are adapted from the book Complete Capuchin (Fragaszy et al., 2004) to avoid unnecessary novelties. In total we use 21 GNB categories grouped into 9 GNB macro-categories.
Figure 7, 8 and 9: 7 and 8. Closed enclosure at Sal ado s zoo a d isla d left pi tu es , housi g
34
The first column in the Table 2 refers to a possible grouping of these behaviours into macro-categories. We used an a priori clustering criteria in order to mimic the four basic categories proposed by Dunbar, 1992, who argues that time act as a hidden constraint to individual fitness, for sometimes there are too many activities (e.g. foraging, patrol territory, search for mates) or much time is employed to one activity (e.g. search for food) that individuals must trade-off between activities. The author then lists four major categories that would summarize the activity cycle of a primate: forage, locomotion, rest, and socialise. The behaviour that would compose these macro-categories varies for each species and situation. The idea of trade-off is implicit in the definition of stereotypies as a functionless behaviour, therefore, verifying correlations between GNB and BPIS can help shed some light in the phenomena.
Behaviours Potentially Indicative of Stress
Most of the BPIS are listed at Boinski et al. (1999a,b) seminal papers on behavioural and physiological indicators of welfare in single housed capuchin (Sapajus apella) monkeys. New BPIS were added to the list as studies on captive capuchins increased (Mendonça-Furtado, 2006; Polizzi di Sorrentino et al., 2012; Pomerantz, Meiri, & Terkel, 2013b; Prates & Bicca-Marques, 2005; Rimpley & Buchanan-Smith, 2013; Ulyan et al., 2006). Special attention will be given to the stereotyped behaviour head-twirl, for a previous study indicates that this BPIS correlates to cortisol levels and pessimistic judgement bias in capuchin monkeys (Pomerantz et al., 2012).
35
36
Table 2. Genus Normative Behaviour s ethogram (GNB). Behaviours are compiled in macro categories.
Macro-category Behaviour Definition
Adapted from
Energy Gain (EG)
Foraging The individual moves around searching for food, but without ingestion at the moment of registration.
1, 2, 3 Eating The animal is stationary and takes food into his mouth, chews and ingests. 1, 2, 3 Drinking Animal is stationary next to a water source taking water into is mouth followed by ingestion. 1, 2, 3 Exploratory
(EX)
Food
manipulation
Food is manipulated with apparent aim to ease the ingestion (soften, crack), but without necessary ingestion afterwards.
1, 2 Manipulation of
environment
The individual touches, moves, licks, rubs or bites objects or part of the environment. 1, 2 Play alone The individual interacts with objects (manipulation of the surrounding environment with no
apparent motive). Pushes and pulls ropes, branches, twigs and wires. Swings itself with inferior or superior limbs. 1, 3 Social positive activities (SP)
Grooming The act of manipulate hair from others with hands or mouth.
Social play Two or more animals interact physically and/or chase each other without aggression involved. There may occur manipulation of the environment
1, 4 Sexual behaviours The individual opens the eyes widely and repeatedly, together with contortion body movements
(this behaviour occurs directed to another individual), body rocking from side to side. This usually happens during female oestrous.
1, 5
Scrounge The a i al app oa hes a othe a d feeds o s aps that fall f o this o e s outh.
Mount Individual mount each other and it may occur contact between genitalia. This usually happens during female oestrous.
Social
negative
37
activities (SN)
Approach/retreat One individual retracts by the approaching of another. The identity of who approached and who retreated is noted.
Vigilance (VI) Alert The individual turns the eyes and head slowly, looking at least at two different directions. The
animal alternates between looking at inside and out of the enclosure, without performing any other behaviour.
1, 2, 3
Threat to the observer
The animal threats the observer. (e.g.: shows the teeth, aggressive vocalization) 1, 2, 3 Inactivity (IN) Inactivity The individual stays in rest and static. The eyes may be open or closed. 1, 2, 3 Locomotion
(LO)
Locomotion Vertical or horizontal locomotion on the enclosure, without manipulation or search for food. 1, 2 Vocalization
(VO)
Vocalization Makes sounds and calls with different meanings. Sounds are made with mouth generally open. Sound can be high or low pitched.
1, 3 Others (O)
Others Other behaviours that are not contemplated in the ethogram. These behaviours do not occur so often.
38
Table 3. Behaviour Potentially Indicative of Stress (BPIS) ethogram. Behaviours are compiled in macro-categories.
Macro-category
Behaviour Definition Adapted
from
Pacing (PA) Pacing Walks or runs repeatedly, without aim, around the same path. 4, 5
Body-Rocking (BR)
Body-Rocking Repeated movements of body rocking, backward and forward or side to side. 2, 4 Active I (AC I)
Head twirl Turns the head looking up and side to side. 7
Pirouette Turns on itself without leaving the same spot.
Active II (AC II) Shiver Shakes body like a shiver, from head to tail. Jumper Jumps up and down on the same spot. Self-directed
(SD)
Scratching The animal scratches a body part, with his hands or feet, during a brief moment. 8
Self- grooming Grooming with hands or mouth, compulsively. 2
Self-biting Bites itself in any body part. 2, 3, 4
Crouching (CR) Crouching / self clasp / huddle
Individual holds itself with arms, legs and the tail. Eyes are opened but tend to look to floor or to itself. It does not move or bounce nor is it scanning the environment. It differs from resting in that animal is not in a relaxed position and slow changes its position just to crouch again few
centimetres away.
2, 3, 4
Ingestion (IG)
Manipulation/inges tion of faeces, urine or sperm
Li ks o tou hes u i e o spe . Eati g of o o othe s fae es, u i e o spe . 3, 4
Vomit followed by eating
Vomits and eats its o o it, o i gestio of a othe s o it.
Screaming (SC)
39
Sexual-display (SX)
Sexual-display Individual opens the eyes widely and repeatedly, together with body rocking from side to side. Hands usually located near the armpit. Legs open displaying genitalia. This behaviour is directed at humans.
4
Masturbation Manipulation with hands, or tail, of the genital and anal regions of the body. 2, 4
Own-stereotypy (OS)
Finger-sucking Sucking one or more fingers. 4
Food/Faeces painting
Smears or rubs faeces, scraps of food and other materials (e.g. pieces of wood, grass) together across the floor.
10
40
Data collection
One of the basic differences in studies of behaviour is that between state and events. States are longer lasting behavioural patterns (e.g. eating), while events as instantaneous occurrences (e.g. sneeze). Of course this distinction is not simple (e.g.
o e a eat a pea ut i a instantaneous ite . This disti tio is ot u h a atte
when one is conducting a focal continuous sample of behaviour, for any behaviour listed in the ethogram, of any length will be recorded. Although the best, this method is not always feasible, and one would need a voice recorder (and later, time to transcribe the recordings), or a help person (one to keep the focal continuously and say the behaviour to a helper, that is typing the code into a palmtop with some software for behavioural analyses, such as Observer).
Recording the behaviour at sampling intervals has the advantage that one person can record the behaviour, either in paper or directly in palmtops, which decreases the time and team demands. Such form of registering behaviour offers a table similar to excel sheet that is didactical to calculate simple descriptive statistics, such as mean, minimum and maximum values. However, in this case the difference between state and event can be an issue. Sampling will always be biased toward the
eha iou that the a i al spe ds ost ti e i . A d that s the statisti al logi ale a d
advantage of this sampling method. However, the greater the interval between two registers tothe greater the bias toward not registering fast behaviours.
41
ethograms but registered behaviours at every 30 sec. This short interval was chosen because: i. it decreases the bias towards longer lasting behaviours; ii. it was feasible; iii. The sampling interval can be extended a posteriori by filtering the registers at longer intervals in the excel table.
Furthermore, this method allow a more direct comparability to other studies for this is the method used by many research of wild (Janson, 1990; Lynch, Ziegler, & Strier, 2002; Perry, 1997) and captive animals (Boinski, Swing, et al., 1999; Jacobsen et al., 2010).
Animals were observed sequentially in a random order, and five minute interval was imposed between focals of different individuals, in order to avoid time dependency and correlations between behaviours of individuals (De Queiroz & Ferreira, 2009).
42
Data Analyses
Activity Budget
This is an estimative of the time allocated to each activity based on the proportion of registers. It is calculated by the following formula:
With Ti is the proportion of time employed by each animal in behaviour i; Ri is the
number of register in which the individual was in activity i; and Rt is the total number
of registers of that individual, in any behaviour.
Although we recorded the behaviour at every 10 sec., for activity budget analyses we used the behavioural state registered at every 30 sec., in order to allow better comparability to Ferreira et al., (2016).
Frequency
43
Diversity Indices
Prevalence: proportion of individuals that perform each one of the macro-categories of BPIS (number of individuals per category). It was calculated by the following formula:
Where, Pi is the prevalence of BPIS; Ni is the number of individuals that performed that behaviour (regardless of how much); and Nt is the total number of individuals in the sample.
Diversity: from the 17 BPIS categories, it indicates how many of them each individual performs (number of BPIS per individual). It was calculated by the following formula:
Where, Di is the diversity of BPIS; Bi is the number of different BPIS each individual exhibited (regardless of how much); and Bt is the total number of BPIS, in this case, Bt = 17.
Markov Chain and Sequence analyses
44
dependency. When one event at t+1 depends on which event occurred at t0, then the
sequence exhibits first-order. If the event at time t is dependent on the two previous events then the sequence exhibits second-order dependency (Lusseau, 2003; Venegas-Barrera, Morales-Bojórquez, & Arnaud, 2008). Based on the order of dependency one may calculate the probability of sequences (in this case, behavioural sequences).
In order to select which order the sequence exhibits we used the Bayesian Information Criterion (BIC) (Sobral & Barreto, 2011). This is a method to calculate the goodness-of-fit of data to a model, the larger the value, the greater the residuals between real values and model predicted values. The BIC imposes a correction in model selection by imposing a penalisation in values that is dependent on number of possible states the sequence may exhibit. BIC was calculated by the following formula:
BIC log ̂( log
In which, k is the order to be tested, ̂( is the function of maximum goodness-of-fit, and n is the number of observations (transitions).
Once defined the dependency order, a transition matrix is built in which each
eha iou al u it is p ese t at o s a d olu s, a d the ells a e filled ith the
probability of transitions between units. As we used 19 behavioural categories, the transition matrix was:
=[
45
The most probable sequence is calculated from this matrix. So if we want a probability of six different behaviours and, if Ma ko s o de is o fi ed to be zero, we multiply the probability of occurrence of each behaviour:
.
Given the order-dependency between transitions found we calculated the probabilities of the following sequences: i. six consecutive GNB (regardless of which macro-category), with higher probability; ii. six consecutives BPIS (regardless of the macro-category), with higher probability; iii. the probability of five GNB and one BPIS (regardless of macro-category), with higher probability. These Ma ko hai s a al ses, were conducted using a script written in R (appendix B) by us.
We employed also the program Ethoseq to extract the significant probabilistic behavioural sequences (Japyassú, Alberts, Izar, & Sato, 2006). This method is based on Graph Theory and, from the matrix of behavioural transitions, it calculates the most probable sequence based on Brown s chi-square. The program outputs Direct Trees, a hierarchical diagram summarizing the information about the sequence of acts. For each individual we calculated the number of significant behavioural sequences that contained at least one BPIS, and the probability of occurrences of sequences containing at least one BPIS.
Social Network Analyses
46
individuals. It is not a statistical method, but rather an analytical method, also grounded on Graph Theory. Several indexes can be calculated based on proportions of ties that link nodes (see review in Makagon et al., 2012, Whithead, 2008). Makagon et al. (2012) distinguish some dimensions that can be analysed: Prominence, Cohesion,
Range and Brokerage. Definitions and formulas to calculate these indexes vary from one author to another depending on penalization and power indices chosen to calculate the index, and we refer to the above cited sources for formulas. SNA can be used to analyse undirected or symmetrical interactions (e.g. proximity) or asymmetrical interactions (e.g. grooming, aggression). Indexes can be calculated per individual (e.g. the centrality of one node) or for the group (e.g. the centralization of the network as a whole).
Although traditionally used to analyse societies, SNA also has been used to unravel other types of interactions such as molecules and words in a text (Asher et al., 2009). Here we use SNA to analyse interactions between behaviours. So, nodes are behaviours, and ties between behaviours represent the transitions between them. We calculated the Prominence indexes for each BPIS, to measures the importance or key nodes. That is, we run a total of 26 SNA, in which the input was the transition matrix of the behaviours exhibited by each individual. The SNA outputs the indegree, outdegree
47
behavioural categories that at least once were followed by a BPIS. Outdegree is the opposite, it refers to the number of direct connections a node makes to other nodes (in asymmetrical interactions). So in the present analyses, outdegree of a BPIS represents the number of other behavioural categories that at least once followed a BPIS. Betweeness is the proportion of shortest paths between any two nodes in the network that pass through the focal node. So, contrary to the other two indices, betweeness considers the strength of the interactions, and it is calculated by the following formula:
Where σst is the total number of shortest paths from s node to t node and σstѵ is the number of those paths that pass through ѵ. In the present analyses, increased betweenness indicated that a BPIS is included in more behavioural sequences of that animal. SNA analyses were run on SOCPROG and NETDRAW free software packages.
Statistical Analyses
These indices (Activity Budget, Frequency, Diversity indexes, Markov Chains order, number of significant sequences, Indegree, Outdegree, and Betweeness) were used as response variables.
48
did t ha e all spe ies a oss e losu es, GLM was made for interactions between sex
and enclosure, and sex and species, and those results that were significant both in species and enclosures will be interpreted as an enclosure difference. We performed a post-hoc Tukey two-sided test. Error I was set at α = 0,05 and tendency considered α up to 0,1. Spearman correlation was used to verify associations between GNB and BPIS. All data were analysed with IBM SPSS Statistics 21.
Results
Activity Budgets: GNB and BPIS
Energy gain related behaviours composed an average of 30% of i di idual s activity budget, less 20% then the average established for wild groups. Vigilance composed 18%, and Locomotion, Social Positive and Exploratory composed, each,
a out % of i di idual s allo ated ti e. I a ti it as ep esented in less than 5% of
49 0% 5% 10% 15% 20% 25% 30% 35%
EG VI LO SP EX IN O SN VO Total BPIS
23 26
23 1 13 20 1
11 12 3 2 3 0 0 0 0 0 0 2 4 6 8 10 12 14 16 18 0% 2% 4% 6% 8% 10% Bo u ts/ h o u r Acti vi ty b u d get
Figure 11. Activity budget and frequency for BPIS. Exact number of individuals that displayed that behaviour is represented on top of each column. Activity budget is presented in mean percentage (columns, light grey) and frequency in mean bouts per hour (line, dark grey).
50
Frequency, Prevalence and Diversity of BPIS
BPIS represented a total of 11,30 % of the activity budget and all animals displayed an mean of 40,03 bouts per hour of BPIS, in a total of 360 bouts/hour. Pacing occurred with a mean frequency of 16,17 bouts per hour, followed by self-directed ( ̅= 13,46 bouts/hour) and own-stereotypy ( ̅ = 5,38 bouts/hour). Animals engaged in AC I (pirouette and head-twirl) with a mean frequency of 2,36 bouts/hour. Ingestion, sexual-display and body-rocking occur less frequently (mean frequency: 1,88 bouts/hour, 0,65 bouts/hour and 0,13 bouts/hour, respectively, see fig 11).
All 26 individuals engaged in at least one of the BPIS macro-categories. The most common macro category of BPIS was self-directed, with 100% of the individuals exhibiting scratching at least once (figure 11), followed by pacing (23 individuals) and ingestion (21 individuals). Manipulation of faeces, urine and sperm was the fourth most common BPIS in the sample, however only three individuals did bouts of vomit followed by eating, all three from the same enclosure at CETAS. Active I macro-category, composed by pirouette and head-twirl, was engaged by 14 individuals. Own-stereotypy was only displayed by two individuals, a female S. libidinosus named Queen and a male S. xanthosternos, Carlinhos, both living in closed enclosures. It is noteworthy that, for these two individuals, the behavioural category Own-stereotypy is also the one most represented in the activity budget of each animal.
51
Two macro-categories were never seen in this research, active II and screaming, even though they are referred to and described in literature (Boinski, Gross, et al., 1999).
Table 4. Diversity of BPIS across variables sex, enclosures and species. Frequency (bouts per hour) of BPIS (macro-categories) across sex, enclosures and species. PA: pacing; BR: body-rocking; SD: self-directed; OS: own-stereotypy; SX: sexual-display; IG: Ingestion; ACI: active I.
Analyses by Sex, Species and Allocation type
We found sex differences for one GNB, with males being more exploratory (F = 0,08 %, M = 0,11%), and one BPIS, active I (head twirl and pirouette), with females exhibiting more ACI than males (F = 0,9%, M = 0,4%). There was also a tendency for females to be involved in more social negative behaviours (0,3% vs 0,2%) and to exhibit more body-rocking than males (0,06%).
We found three statistical significant species differences in GNB, and three in BPIS. Blonde capuchins (S. flavius) exhibited more GNB exploration and more diversity in BPIS. S. xanthosternos were more GNB vigilant, inactive, and exhibited more BPIS ingestion and sexual display.
Diversity Frequency
Mean PA BR SD OS SX IG AC I
Sex Female 0,33 12,70 0,24 14,17 7,49 0,87 2,03 3,15 Male 0,29 20,23 0,00 12,63 2,92 0,40 1,70 1,44
Enclosure CETAS 0,38 21,57 0,00 12,74 17,47 0,10 0,69 6,41
Closed Zoo 0,35 13,18 0,29 15,94 2,92 1,17 2,90 1,91 Island 0,20 16,63 0,00 10,27 0,00 0,30 1,23 0,00
Species S. libidinosus 0,38 21,57 0,00 12,74 17,47 0,10 0,68 6,41
S. flavius 0,40 16,14 0,49 17,82 0,00 0,77 1,37 3,24
52
Enclosure size affected four GNB categories, and three BPIS indices (fig. 12). Animals kept in the island exhibited more energy gain, while animals in closed zoos exhibited more exploration, vigilance, locomotion, and the BPIS sexual display and ingestion. Animals kept either in closed CETAS or in Zoos exhibited more diversity of BPIS than animals kept in the island.
Sex and enclosure had significant joint interaction in GNB, with males exhibiting more energy gain and less vigilance than females, both in closed enclosures, while females exhibited more energy gain and less vigilance at the island.
Sex and species had significant joint interaction in GNB exploratory, inactivity, locomotion, and in BPIS pacing and self-directed. Female blonde capuchins explored, paced and self-directed more, and locomoted less, while male yellow breasted capuchins showed this pattern (males explored, paced and self-directed more and locomoted less).
Figure 12. Differences in GNB and BPIS' activity budget, across enclosures (dark grey: CETAS;
53
Correlations GNB and BPIS
Our analyses showed that GNB energy gain is negatively correlated with total BPIS; Active 1 (pirouette and head-twirl) and Own-stereotypy. There was a tendency for negative correlation to Self-Directed, Sexual display (see σ and p values at table 5)
BPIS Pacing correlated negatively to GNB Exploratory and Locomotion. Self-directed correlated negatively to Energy Gain.
BPIS Active 1 (pirouette and head-twirl) correlated negatively to GNB energy gain, and tendency for negative correlate to Social positive, Inactivity and Vocalization.
BPIS Sexual display correlated positively to Vigilance and Inactivity. BPIS screaming, ingestion and active II did not correlate to any GNB.
54 0% 10% 20% 30% 40% 50% 60% 70% 80% q u ee n lei a h u lk carl in h o s wol veri n e so lei l vesgo ru iva cab el u d a d ar k yo d a lu la care ca ru fi o go lias b ab a to lo am id al a b arb u d o es te r lan go p ret a lisa cha to p el ad o ew o k Acti vi ty b u d get
55
Table 5. Summary of all significant results across analyses (Yes: significant results; Ŧ: te de ; numbers in potency: F, χ , ρ a d p values under the tabel).
Sex Species # Enclosure Interactions Correlations
Energy gain Yes15 Sex-encl.22 Negative AC I, OS33
Negative SD, SX34Ŧ
Exploratory Yes1 Yes7 Yes16 Sex-sp.23 Negative PA35
Social positive Negative AC I36Ŧ
Social negative Ŧ 2 Sex-sp.24 Ŧ
Vigilance Yes8 Yes17 Sex-encl.25 Positive SX37
Positive BR38 Ŧ
Inactivity Yes9 Sex-sp.26 Positive SX39
Negative AC I40 Ŧ
Locomotion Yes18 Sex-sp.27
Sex-encl.28Ŧ
Negative PA41
Vocalization Positive AC I42
Others Yes3 Yes10 Sex-encl.29 Negative AC I43
% BPIS Frequency Prevalence
Diversity Yes11 Yes19
Pacing Sex-sp.30 Negative EX, LO
Body-rocking Ŧ 4 Ŧ 12 Sex-sp.31 Ŧ Positive VI Ŧ
Self-directed Sex-sp.32 Negative EG Ŧ