EVALUATION OF INFORMATION RETRIEVAL
SYSTEMS
Keneilwe Zuva
1and Tranos Zuva
21
Department of Computer Science, University of Botswana, Gaborone, Botswana [email protected]
2
Department of Computer Systems Engineering, Tshwane University Technology, Pretoria, SA
A
BSTRACTOne of the challenges of modern information retrieval is to adequately evaluate Information Retrieval System (IRS) in order to estimate future performance in a specified application domain. Since there are many algorithms in literature the decision to select one for usage depends mostly on the evaluation of the
systems’ performance in the domain. This paper presents how visual and scalar evaluation methods complement one another to adequately evaluate information retrieval systems. The visual evaluation methods are capable of indicating whether one IRS performs better than another IRS fully or partially. An overall performance of IRS is revealed using scalar evaluation methods. The use of both types of evaluation methods will give a clear picture of the performance of the IRSs. The Receiver Operator Characteristic (ROC) curve and Precision-Recall (P-R) curve were used to illustrate the visual evaluation methods. Scalar methods notably precision, recall, Area Under Curve (AUC) and F measure were used.
K
EYWORDSROC curve, Precision, Recall, Area Under Curve, Information Retrieval System
1. I
NTRODUCTIONEvaluation is very crucial and tedious task in information retrieval system. There are many retrieval models, algorithms and systems in literature so in order to proclaim the best among many, choose one to use and improve there is need to evaluate them. One way to evaluate is to measure the effectiveness of the systems. The difficult of measuring effectiveness is that it is associated with the relevancy of the retrieved items. This makes relevance the foundation on which information retrieval evaluation stands. Thus it is important to understand relevance. In order to support laboratory experimentation in the early studies, relevance was considered to be topical relevance, a subject relationship between item and query. According to [1] relevance is seen as a relationship between any one of a document, surrogate, item, or information and a problem, information need, request, or query. Relevancy from the human perspective is
subjective (depends upon a specific user’s judgement), situational (relates to user’s current
Evaluation Techniques For IR Systems
Techniques for Evaluation of unranked Results
Techniques for Evaluation of ranked Results
Non-Graphical Representation Techniques
Non-Graphical Representation Techniques Graphical
Representation Techniques
relevance of a document/item to one information need. There are many algorithms to evaluate the retrieval systems and can be classified into those that are used to evaluate ranked or unranked retrieval results [4]. They can also be regrouped into visual (graphical techniques) and scalar (non-visual techniques) [5]. The overview of the classification of the techniques is shown in Figure 1.
Figure 1: Hierarch of classification of evaluation techniques for IR systems
In this brief review of the evaluation techniques for information retrieval system, the following techniques will be reviewed using the classification in Figure 1: Precision, Recall, F-measure, Precision-Recall curve, Mean Average Precision, Receiver Operating Characteristics (ROC) curve and Area Under ROC Curve (AUC). The merits and demerits of these techniques will be discussed then investigate criteria to choose the appropriate algorithm(s) to use in different situations. Finally open issues will also be discussed and then conclusion.
2.
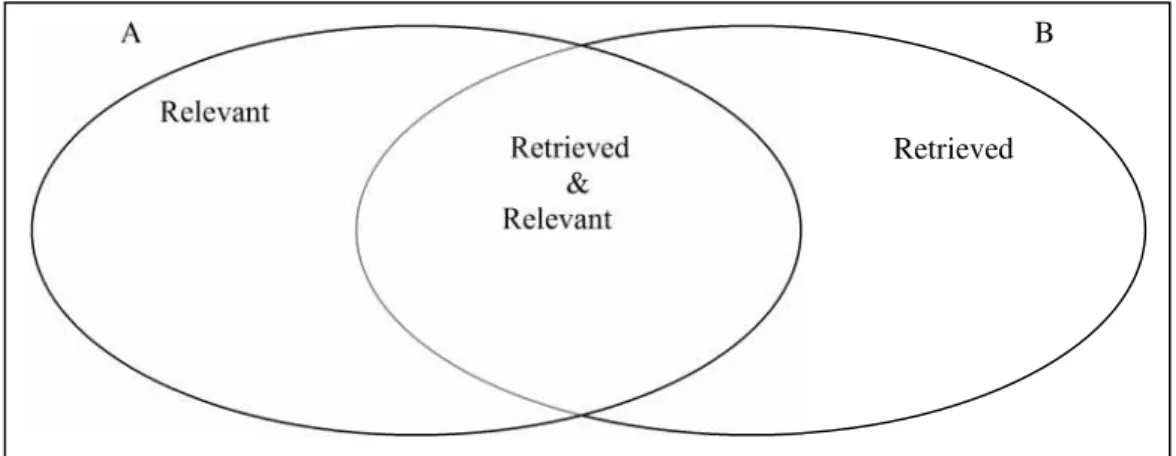
TECHNIQUES FOR EVALUATION OF UNRANKED RETRIEVAL RESULTSFigure 2: Set Diagram showing elements of Precision and Recall
The formulas for Precision (P) and recall (R) using set notation are in equation 1 and 2:
(
)
( )
B nB A n P=
(1)
(
)
( )
A nB A n R=
(2)
To the user the scalar value of recall indicates the ability of the system to find relevant items as per query from the collection of different items and precision ability to output top ranked relevant items as per query. In general the user is interested in the relevant retrieved items thus the measures of precision and recall concentrate the evaluation on the relevant output of the system. The lower the values indicates bad performance of the system and the higher the values the more the user is encouraged to use the system due to the anticipation of getting more of the relevant search items. These evaluation measures are inter-dependent measures in that as the number of retrieved items increases the precision usually decreases while recall increases.
From these measures there are other measures that are derived from them. F-measure is one known measure derived from precision and recall measures. This is scalar quantity that trade off precision versus recall which is the weighted harmonic mean of precision and recall. The formula is given in the equation below [6, 7]:
R P
F
1 * ) 1 ( 1 *
1
+ −=
(3)
where
∈[0,1]. The default balanced F measure equally weights precision and recall, whichmeans making
= 1 . The weights can be varied as required.A B
Retrieved Relevant
It is important to note that precision, recall and F measure are set oriented measures thus cannot adequately be used in ranked results systems [3].
3.
TECHNIQUES FOR EVALUATION OF RANKED RETRIEVAL RESULTSThis section describes techniques for evaluation of ranked information retrieval results. Among these techniques are Precision-Recall curve (P-R-curve), ROC curve, R-precision, Mean Average Precision (MAP), ROC Area Under Curve and Precision at k just to mention a few.
Most current systems present ranked results thus to be able to use the precision and recall measures there is need to pair them at each given position. Considering the first
k
retrieved items, the precision and the recall values can be calculated as long as the total relevant items are known in the database. The following example illustrates the construction of the precision-recall curve.Table 1: Showing the calculation of precision-recall coordinates
Calculating Precision-Recall Points
Query Item=I56 Known #relevant items in
database=5
Rp 1 2 3 4 5 6 7 8 9 10 11
ItemID I2 I33 I12 I8 I67 I99 I5 I1 I23 I3 I9
Relevance Yes No Yes Yes Yes No No No No No Yes
Recall Value(r’) 1/5= 0,2 1/5= 0,2 2/5= 0,4 3/5= 0,6 4/5= 0,8 4/5= 0,8 4/5= 0,8 4/5= 0,8 4/5= 0,8 4/5= 0,8 5/5= 1,0 Precision Value 1/1= 1,0 1/2= 0,5 2/3= 0,67 3/4= 0,75 4/5= 0,8 4/6= 0,67 4/7= 0,57 4/8= 0,5 4/9= 0,44 4/10= 0,4 5/11= 0,45
From table 1 Rpis the ranked position of an item retrieved and ItemID is the item identification. It
can also be observed that when the item on Rp+1is not relevant the recall remains the same and
precision decreases as shown in Table 1 when Rp+1=2, recall remained 0,2 as it was in Rp=1,
precision decreased from 1,0 to 0,5. In case where the item in Rp+1is relevant the recall increases
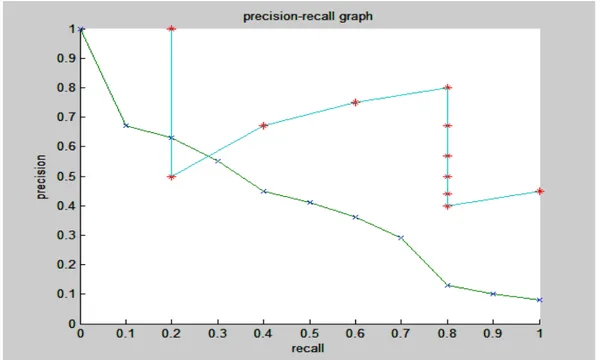
and the precision increases or remains the same. The P-R graph is the plotted from the precision-recall values in Table 1. The graph can be seen in Figure 2 with points marked using stars that have distinct saw-tooth shape. In order to smoothen the graph the interpolated precision is used
and the interpolated precision ∧
Pat certain recall level ris defined as the maximum precision
found for any recall level r’ as in equation4.
' ) ' ( max ) ( r r r p r P ≤ ∧ = (4)
Interpolate a precision value for each standard recall level in Table 1 and the following Table 2 of 11-point interpolated average precision is obtained.
Table 2:11-Point Interpolated Average Precision
r’ 0,2 0,2 0,4 0,6 0,8 0,8 0,8 0,8 0,8 0,8 1,0
R 0,0 0,1 0,2 0,3 0,4 0,5 0,6 0,7 0,8 0,9 1,0
) (r p
So the graph in first curve marked with * in Figure 2 is transformed to the second curve whose
points are marked with “X”.
Figure 3: Graphs for values in Table 1 and Table 2
For more variations of Precision-Recall curves consult [4, 6].
Looking at non graphical evaluation techniques related to precision and/or recall, there is MAP which has gained popularity among the Text Retrieval Conference (TREC) members [4]. MAP is one of the various ways of combining precision and recall into a single scalar value measure which is defined as an average of the average precision value for a set of queries. Average precision is calculated by averaging the precision for every position in the ranking at which a relevant item is retrieved. Relevant items not retrieved by cut-off depth are assigned a precision of zero. The scalar value obtained is approximately equal to the area under the precision-recall curve. MAP expresses the quality of the system in one number. The formula that is used to calculate the MAP is given in equation 5.
( )
∑
∑
= = =
1 1
Re Re
Re 1
k
k
i i
k k n
MAP
(5)
where
n
( )
Re
is the number of relevant items, Rekand Rei take zero or one indicating not relevant or relevant at position k and i respectively.measure the number of relevant items is known and it becomes the cut-off point. The formula is given in equation 6:
( )
∑
=
−
(Re)Re
Re
1
Pr
n
k k
n
ecision
R
(6)
The R-precision measure is also called break-even point. R-precision refers to the best precision on the precision-recall curve.
Receiver Operating Characteristics curve is also used in information retrieval systems performance evaluation. In order to illustrate how ROC works it is important to understand the confusion matrix. A confusion matrix shows the differences between the true and predicted classes [8]. The confusion matrix is shown in Table 3.
Table 3: Confusion Matrix
Actual Positive Actual Negative Total predicated
Predicated Positive TP FP TP+FP=TPP
Predicated Negative FN TN FN+TN=TPN
Total Actual TP+FN=TAP FP+TN=TAN N
where TP is true positive (items correctly labelled as similar to query), FP false positive (items incorrectly labelled as similar to query item), FN false negative (items incorrectly labelled as not similar to query), TN true negative (items correctly labelled as not similar to query item), TPP total predicated positive, TPN total predicted negative, TAP total actual positive, TAN total actual negative and N =TAP+TAN=TPP+TPN. From the confusion matrix more meaningful measures can be derived from it to illustrate performance criteria as shown below [9, 10]:
TAP TP FN TP
TP recall
or y Sensitivit or
TPR =
+ =
(7)
TAN FP TN FP
FP y
Specificit or
FPR =
+ = −
1
(8)
Figure 4: Graphs illustrating the appearance of P-R and ROC curves
The ROC curve also brings another form of measure of the performance of a system. This measure is ROC Area Under Curve (AUC) a simple scalar metric that defines how an algorithm performs over the whole space. The area can be calculated using the trapezoidal area created between each ROC curve points [13]. AUC value range is [0 1]. One indicates an ideal performance of a system, 0.5 a random guess performance of the system and a zero a system that never retrieves anything similar to the query [14]
4. R
ELATIONSHIP BETWEENROC AND
P-
R RELATED MEASURESThe ROC and P-R curves are visual performance measures as seen in Figure 4. In [9] it is shown that a curve that that dominates in ROC space also dominates in P-R space and vice versa. This is illustrated in Figure 4, the comparison of the two systems in P-R space and ROC space shows that system represented with dashed line performs better in both spaces. Again from these graphs it can be appreciated that the area under the curves in both spaces are approximately equal. In P-R space the area under the curve is called MAP and in ROC space ROC-AUC. The bigger the area the better the system performs.
5. C
ONCLUSIONPerformance evaluation is crucial at many stages in information retrieval system development. At the end of development process it is significant to show that the final retrieval system achieves an acceptable level of performance and that it represents a significant improvement over existing retrieval systems. To evaluate a retrieval system, there is need to estimate the future performance of the system. The information retrieval performance evaluation methods measures highlights
different aspects of a model’s classification performance and so selecting the most appropriate
performance measure is clearly application dependent [10]. The scalar measures are attractive to use because they give a definitive answer to which retrieval system is better, this gives authors the authority to claim the superiority of their algorithm. The scalar measure gives an overall value of performance of the system and no any other information. The visual performance measure preserves all performance related information about a retrieval system. The visual performance measure is capable of showing if one system dominates the other system totally or partially.
precision [7]. Precision-recall analysis has remained as the appropriate evaluation performance measures of choice in applications such as database image retrieval. Precision-Recall Curve (PRC) which plot precision vs recall across all thresholds represents a more natural way of looking at classification performance when it comes to search relevant items (information retrieval) in situations where the available data is heavily imbalanced in favour of the negative class [15]. The end-users relate to precision-recall curves as they indicate how many true positives are likely to be found in a typical search. Evaluation at single operating point is suitable in well defined environment where class priors and misclassification cost are known [1, 10].
ROC curve is helpful in assessing the performance of a system independently of any given threshold. The ROC curve which plot TPR vs FPR allows authors to quickly see if one method dominates another, and using convex hull to identify potentially optimal methods without committing to a specific performance measure. There is a scalar measure related to ROC curve which is ROC Area Under Curve (ROC-AUC) is also used to measure predictive system’s
performance.
There many other methods suggested in literature, they all fall within these two categories: Scalar and Visual measures. The few described above seem to be the mostly used in evaluation methods of information retrieval systems’ performance.
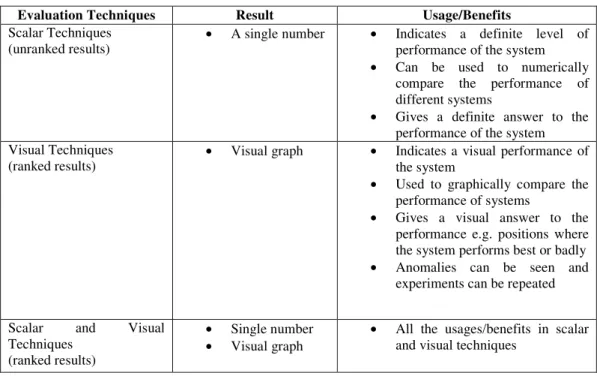
Combining scalar and visual evaluation techniques of information retrieval systems gives a full picture and a definite answer about the performance of the system being evaluated. The following Table 4 gives the summary of the benefits of the techniques when used alone and when combined.
Table 4: Summary of benefits of using the evaluation techniques
Evaluation Techniques Result Usage/Benefits
Scalar Techniques (unranked results)
• A single number • Indicates a definite level of performance of the system • Can be used to numerically
compare the performance of different systems
• Gives a definite answer to the performance of the system Visual Techniques
(ranked results)
• Visual graph • Indicates a visual performance of the system
• Used to graphically compare the performance of systems
• Gives a visual answer to the performance e.g. positions where the system performs best or badly • Anomalies can be seen and
experiments can be repeated
Scalar and Visual Techniques
(ranked results)
• Single number • Visual graph
R
EFERENCES[1] E. Rasmussen, "Evaluation in Information Retrieval," in 3rd International Conference on Music Information Retrieval, Paris, France, 2002, pp. 45-49.
[2] Y. Choi and E. Rasmussen, "User's relevance criteria in image retrieval in America history," Information Processing and Management, vol. 38, pp. 695-726, 2002.
[3] T. Mandl, "Recent Developments in the Evaluation of Information Retrieval System: Moving Towards Diversity and Practical Relevance," Informatica, vol. 32, pp. 27-38, 2008.
[4] C. D. Manning, et al., Introduction to Information Retrieval: Cambridge University Press, 2008. [5] R. Hoshino, et al., "Applications and extensions of cost curves to marine container inspection,"
Annals OR, vol. 187, pp. 159-183, 2009.
[6] R. Baeza-Yates and B. Ribeiro-Neto, Modern Information Retrieval. New York: ACM Press, 1999. [7] B. Zhou and Y. Yao, "Evaluation information retrieval system performance based on user
preference," Journal of Intelligent Information Systems, vol. 34, pp. 227-248, 2010.
[8] A. P. Bradley, "The use of the area under the ROC curve in the evaluation of machine learning algorithms," Pattern Recognition, vol. 30, pp. 1145-1159, 1997.
[9] J. Davis and M. Goadrich, "The Relationship Between Precision-Recall and ROC Curves," in Proceedings of the 23rd International Conference on Machine Learning, Pittsburgh, PA, 2006, pp. 233-240.
[10] T. C. W. Landgrebe, et al., "Precision-recall operating characteristic (P-ROC) curves in imprecise environments," in The 18th International Conference on Pattern Recognition (ICPR'06), Washington, DC, 2006, pp. 123-127.
[11] K. H. Brodersen, et al., "The binormal assumption on precision-recall curves," in International Conference on Pattern Recognition, 2010, pp. 4263-4266.
[12] C. Ferri, et al., "Volume Under the ROC surface for Multi-class Problems. Exact Computation and Evaluation of Approximations," in Proc. of 14th European Conference on Machine Learning, 2003, pp. 108-120.
[13] C. Drummond and R. C. Holte, "Explicity Representing Expected Cost: An Alternative to ROC Representation," in In Proceedings of the Six ACM SIGKDD International Conference on Knowledge Discovery and Data Mining, 2000, pp. 198-207.
[14] S. D. Walter, "Properties of the Summary Receiver Operating Characteristic (SROC) curve for diagnostic test data," Statistics in Medicine, vol. 21, pp. 1237-1256, 10 April 2002.
[15] K. Jarvelin and J. Kekalainen, "IR evaluation methods for retrieving highly relevant documents," in Proceedings of the 23rd Annual Internationa ACM SIGIR Conference on Research and Development in Information Retrieval, New York NY, 2000, pp. 41-48.
Author