Astrocyte Elevated Gene-1 as a Novel
Clinicopathological and Prognostic Biomarker
for Gastrointestinal Cancers: A Meta-Analysis
with 2999 Patients
Yihuan Luo, Xin Zhang, Zhong Tan, Peirong Wu, Xuelian Xiang, Yiwu Dang, Gang Chen*
Department of Pathology, First Affiliated Hospital of Guangxi Medical University, Nanning, Guangxi Zhuang Autonomous Region, People’s Republic of China
*chen_gang_triones@163.com
Abstract
Background
There have been numerous articles as to whether the staining index (SI) of astrocyte ele-vated gene-1 (AEG-1) adversely affects clinical progression and prognosis of gastrointesti-nal cancers. Nevertheless, controversy still exists in terms of correlations between AEG-1 SI and clinicopathological parameters including survival data. Consequently, we conducted a comprehensive meta-analysis to confirm the role of AEG-1 in clinical outcomes of gastro-intestinal carcinoma patients.
Methods
We performed a comprehensive search in PubMed, ISI Web of Science, Cochrane Central Register of Controlled Trials, EMBASE, Science Direct, Wiley Online Library, China National Knowledge Infrastructure (CNKI), WanFang and Chinese VIP databases. STATA 12.0 (STATA Corp., College, TX) was used to analyze the data extracted from suitable stud-ies and Newcastle-Ottawa Scale was applied to assess the quality of included articles.
Results
The current meta-analysis included 2999 patients and our results suggested that strong associations emerged between AEG-1 SI and histological differentiation (OR = 2.129, 95% CI: 1.377–3.290, P = 0.001), tumor (T) classification (OR = 2.272, 95%CI: 1.147–4.502, P = 0.019), lymph node (N) classification (OR = 2.696, 95%CI: 2.178–3.337, P<0.001) and metastasis (M) classification (OR = 3.731, 95%CI: 2.167–6.426, P<0.001). Furthermore, high AEG-1 SI was significantly associated with poor overall survival (OS) (HR = 2.369, 95%CI: 2.005–2.800, P<0.001) and deteriorated disease-free survival (DFS) (HR = 1.538, 95%CI: 1.171–2.020, P = 0.002). For disease-specific survival (DSS) and relapse-free sur-vival (RFS), no statistically significant results were observed (HR = 1.573, 95%CI: 0.761–
3.250, P = 0.222; HR = 1.432, 95%CI: 0.108–19.085, P = 0.786). Subgroup analysis OPEN ACCESS
Citation:Luo Y, Zhang X, Tan Z, Wu P, Xiang X, Dang Y, et al. (2015) Astrocyte Elevated Gene-1 as a Novel Clinicopathological and Prognostic Biomarker for Gastrointestinal Cancers: A Meta-Analysis with 2999 Patients. PLoS ONE 10(12): e0145659. doi:10.1371/journal.pone.0145659
Editor:Domenico Coppola, H. Lee Moffitt Cancer Center & Research Institute, UNITED STATES
Received:August 16, 2015
Accepted:December 7, 2015
Published:December 28, 2015
Copyright:© 2015 Luo et al. This is an open access article distributed under the terms of theCreative Commons Attribution License, which permits unrestricted use, distribution, and reproduction in any medium, provided the original author and source are credited.
Data Availability Statement:All relevant data are within the paper and its Supporting Information files.
demonstrated that high AEG-1 SI was significantly related to poor prognosis in esophageal squamous cell carcinoma (ESCC) (HR = 1.715, 95%CI: 1.211–2.410, P = 0.002), gastric carcinoma (GC) (HR = 2.255, 95%CI: 1.547–3.288, P<0.001), colorectal carcinoma (CRC) (HR = 2.922, 95%CI: 1.921–4.444, P<0.001), gallbladder carcinoma (GBC) (HR = 3.047, 95%CI: 1.685–5.509, P<0.001), hepatocellular carcinoma (HCC) (HR = 2.245, 95%CI: 1.620–3.113, P<0.001), pancreatic adenocarcinoma (PAC) (HR = 2.408, 95%CI: 1.625–
3.568, P<0.001).
Conclusions
The current meta-analysis indicated that high AEG-1 SI might be associated with tumor pro-gression and poor survival status in patients with gastrointestinal cancer. AEG-1 might play a vital role in promoting tumor aggression and could serve as a potential target for molecular treatments. Further clinical trials are needed to validate whether AEG-1 SI provides valu-able insights into improving treatment decisions.
Introduction
Cancers in digestive system can be mainly divided into esophageal cancer (EC), gastric noma (GC), colorectal carcinoma (CRC), gallbladder carcinoma (GBC), hepatocellular carci-noma (HCC) and pancreatic adenocarcicarci-noma (PAC). According to global cancer statistics in 2012, HCC and GC are identified as the second and third most frequently diagnosed cancers among men in less developed countries. It is estimated that EC, with highest rates in East Asia, caused 400,200 deaths in 2012 worldwide, while there were 1.4 million cases of CRC patients and 693,900 deaths occurred due to CRC [1]. In spite of advanced techniques of diagnosis and treatments nowadays, approaches to distinguish tumor progression and prognosis of patients with gastrointestinal cancers still need to improve. Hence, it is urgently demanded to find bet-ter makers, which can reflect the clinicopathological albet-terations and predicate prognosis accu-rately in the early stages of tumors.
Astrocyte elevated gene-1 (AEG-1), also known as metadherin (MTDH) [2] or LYsine-RIch CEACAM1 coisolated (LYRIC) [3], was first identified in 2002 as a novel protein induced in primary human fetal astrocytes infected by human immunodeficiency virus 1 (HIV)-1 and
tumor necrosis factor-α(TNF-α) [4]. The AEG-1 gene is an oncogene, which is located at
chromosome 8q22 [5], and it is observed that elevated expression of AEG-1 promoted tumor proliferation, progression or metastasis in multiple carcinomas such as EC [6], HCC [7], neu-roblastoma [8], breast cancer [9], prostate cancer [10] and malignant glioma [11]. In addition, AEG-1 could activate multiple molecular mechanisms to exert its functions, including nuclear
factorκ-B (NF-κB) [12], phosphatidylinositol 3-kinase (PI3K)/Akt and c-Myc [13,14], Wnt/
b-catenin [15], extracellular signal-regulated kinase (ERK) [7], activator protein 1 (AP-1) [10] and non-thyroidal illness syndrome (NTIS) [16]. Also, it was reported that AEG-1 could increase the expression of angiopoietin-1, matrix metalloprotease-2 (MMP2),
hypoxia-induc-ible factor 1-α(HIF-α) and Tie2, which are essential in angiogenesis [17].
The evidences above reveal that AEG-1 is involved in the process of tumor proliferation, infiltration and metastasis. Furthermore, a meta-analysis have been conducted to explore the relationships between AEG-1 staining index (SI) and clinicopathological features in squamous cell carcinoma (SCC) [18], which offered clear information regarding the influence of AEG-1 study design, data collection and analysis,
preparation of the manuscript, or decision to publish.
on SCC. Nonetheless, the association of AEG-1 with clinical prognosis has not been estimated and its limited sample size devalued the analysis to some extent. Meanwhile, no consistent con-clusion was reached on the possible role that AEG-1 might play in the progression and progno-sis of gastrointestinal cancers. Therefore, we reviewed the observational studies available quantitatively and performed the current meta-analysis in an attempt to investigate the clinico-pathological and prognostic significance of AEG-1 in patients with gastrointestinal cancers.
Materials and Methods
Literature Reviewing and Selecting
Initially, we performed an electronic search to identify all literature related to AEG-1 SI in patients with cancers in following databases: PubMed, ISI Web of Science, Cochrane Central Register of Controlled Trials, EMBASE, Science Direct, Wiley Online Library, China National Knowledge Infrastructure (CNKI), WanFang and Chinese VIP. The search strategy consisted
of the combinations of“AEG1”,“AEG-1”,“astrocyte elevated gene-1”,“MTDH”,“
metad-herin”,“LYRIC”and“tumor”,“cancer”,“neoplas
”,“malignan
”,“carcinoma”. Reviews and
references related were also scrutinized. The closing date for our search was August 14, 2015, which denoted that no literature after the time point would be included.
Two independent investigators (YiHuan Luo, Zhong Tan) reviewed the literature quantita-tively with the same multi-step process. Firstly, the abstracts were screened to exclude the ineli-gible studies which were irrelevant or duplicate. Then, full-text contents of the remaining studies were further reviewed by the investigators independently to decide whether to subsume in accordance with the inclusion criteria listed below: (1) The samples should be collected form patients with gastrointestinal cancers; (2) The studies should explore the correlation between AEG-1 SI and survival data, be published in whether English or Chinese, and detect the AEG-1 levels by immunohistochemistry (IHC); (3) The studies should offer available data to calculate hazard ratios (HRs) value and its 95% confidence interval (95% CI). In addition, trails using either animals or cell lines, reviews, case reports and letters were excluded. If survival analyses were displayed in the articles but proved insufficient to calculate the HR value, we would strive to contact the authors to obtain primary survival data whenever and wherever possible. To avoid duplications of data, only the study with the most complete data would be included when there existed different studies investigating the same or overlapping cohort of patients. Finally, controversies were resolved by a third reviewer (Gang Chen).
Data Extraction
Data were extracted carefully from eligible studies by two investigators (YiHuan Luo and Zhong Tan) independently and consistency was reached in all items. The extracted
characteris-tics included the first author’s name, published year, cancer type, country and number of the
patients, antibody, cut-off value for AEG-1 positivity, blinding of AEG-1 measurements, fol-low-up times, analysis types and prognostic data. To evaluate the relationship between AEG-1 and tumor aggressivity, the following clinicopathological parameters were extracted: differenti-ation degree, tumor (T) classificdifferenti-ation, lymph node (N) classificdifferenti-ation, metastasis (M) classifica-tion. Disagreements would be discussed by two investigators till consensus was achieved.
Quality Assessment
and scoring each studies according to Newcastle–Ottawa Scale (NOS) [19]. The scale evaluates the selection of cohorts, the comparability of cohorts and the ascertainment of outcomes. Each study could be credited at most one star for every numbered item in the Selection and Out-comes section. Meanwhile, the Comparability section was entitled to a maximum of two stars. The final stars were calculated in the end, which could not exceed an overall of nine stars. The more stars a study collected, the better methodological quality it presented.
Statistical Methods
The odds ratio (OR) value was adopted to estimate the associations of AEG-1 SI with
clinico-pathological features in patients with gastrointestinal cancers. When OR>1, it indicated that
high AEG-1 SI was more likely to correlate with poorer degree of histological differentiation and more advanced stage of TNM classification.
To evaluate the impact of AEG-1 SI on patients’survival, HR value and its 95% CI of each
single study were extracted and later combined. The simplest method was to extract HR values and their 95% CIs directly from the studies. For the studies which only presented the Kaplan-Meier curves or primary data, we calculated the HR value by the methods that Jayne F Tierney had described [20], i.e. using either the software Engauge Digitizer version 4.1 (http://digitizer. sourceforge.net/) or SPSS20.0. High AEG-1 SI indicated poor prognosis if a pooled HR>1 was
observed. For heterogeneity analysis, Cochrane Q test (Chi-squared test) was conducted to measure the potential heterogeneity among the included studies. If no statistically significant
heterogeneity (P>0.05) existed, a fixed-effect model (Mantel-Haenszel method) was conducted
to combine the HR values. Otherwise, a random-effect model (DerSimonian and Laird method) would be employed. Meanwhile, funnel plots were applied to examine the publication bias. All the statistical analyses above were performed on STATA12.0 (STATA Corp., College,
Texas), and it was considered statistically significant when a two-sidedPvalue was less than
0.05.
Results
Summarized Characteristics of Eligible Literature
The primary search identified a total of 795 studies and we evaluated 100 of them in full text. Among full-text studies, 74 studies were excluded for the lack of survival data and 3 studies were excluded for failure to estimate HR (Fig 1). Finally, 23 independent studies (n = 2999 patients),
published from 2009 to 2015, were included in our meta-analysis [6,18,21–41] except that
par-tial data of one study were excluded due to failure to estimate reasonable HR value [29]. The
main characteristics of the included studies were listed inTable 1. The number of the patients
ranged from 41 to 520. In the current meta-analysis, 16 studies provided available information for histological differentiation, 13 studies for T classification, 15 studies for N classification and 11 studies for M classification. Meanwhile, this meta-analysis included 19 studies evaluable for overall survival (OS), 3 studies for disease-free survival (DFS), 2 studies for disease-specific sur-vival (DSS) and 2 studies for relapse-free sursur-vival (RFS). Fifteen studies assessed the IHC results with blind reading, while 8 studies were not reported. The follow-up times varied from 18 to 193 months. Among all 23 studies, 18 provided available survival data of multivariate analyses [18, 21–28,30,34–41]and 5 contained only survival curves [6,29,31–33].
Quality Assessment
The information of scoring was summarized inTable 1. For quality assessment, the highest
current meta-analysis, each study included in our meta-analysis was with a score6, which ensured its eligibility in terms of methodological quality.
Associations of AEG-1 SI with clinicopathological features
Listed inTable 2were the main statistical results evaluating the effects of AEG-1 SI on
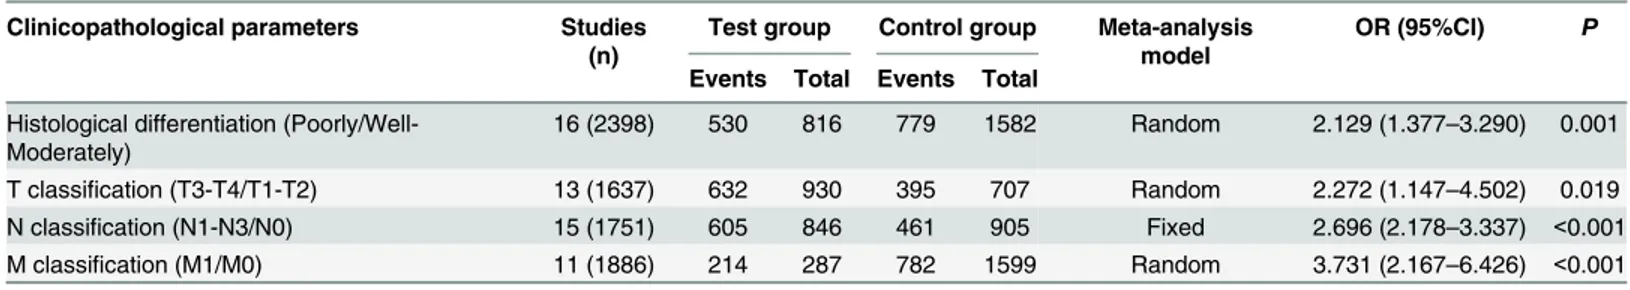
clinico-pathological features of patients with gastrointestinal cancer. Overall, 16 studies (n = 2398 patients) estimated the relationship between AEG-1 SI and histological differentiation. The
pooled OR was 2.129 (95%CI: 1.377–3.290, P = 0.001) (Fig 2A), suggesting that high AEG-1 SI
closely correlated with poor degree of histological differentiation. In addition, our meta-analy-sis unveiled the significant associations between AEG-1 SI and T classification (n = 1637 patients), N classification (n = 1751 patients) and M classification (n = 1886 patients). The
combined OR were 2.272 (95%CI: 1.147–4.502, P = 0.019) (Fig 2B), 2.696 (95%CI: 2.178–
3.337, P<0.001) (Fig 2C) and 3.731 (95%CI: 2.167–6.426, P<0.001) (Fig 2D), respectively
(Table 3). The results above indicated that high AEG-1 SI correlated with worsened situations of tumor invasion, lymph node metastasis and distant metastasis.
Impact of AEG-1 SI on Survival
The main combined results of the effects of AEG-1 SI on survival were outlined inTable 3.
According to our meta-analysis, there were statistically significant associations of AEG-1 SI
with OS and DFS. The pooled HRs for OS and DFS were 2.412 (95%CI: 2.136–2.723, P<0.001)
(Fig 3) and 1.538 (95%CI: 1.171–2.020, P = 0.002) (Fig 4), respectively. However, no
statisti-cally significant association was observed between AEG-1 SI and DSS. HR was 1.573 (95%CI:
0.761–3.250, P = 0.222) (Fig 5) when combined with random effect model. Moreover, similar
results were found in the case of RFS (HR = 1.432, 95%CI: 0.108–19.085, P = 0.786) (Fig 5).
Subgroup analysis demonstrated that high AEG-1 SI was significantly related to poor prognosis
in ESCC (HR = 1.715, 95%CI: 1.211–2.410, P = 0.002), GC (HR = 2.255, 95%CI: 1.547–3.288,
P<0.001), CRC (HR = 2.922, 95%CI: 1.921–4.444, P<0.001), GBC (HR = 3.047, 95%CI:
1.685–5.509, P<0.001), HCC (HR = 2.245, 95%CI: 1.620–3.113, P<0.001), PAC (HR = 2.408,
95%CI: 1.625–3.568, P<0.001). The results of heterogeneity test were listed inTable 3.
Fig 1. Flow diagram of literature reviewing and selection.
Table 1. Main characteristics of the included studies.
First author
Year Country Cancer types
N (M/F) Staining for high AEG-1 SI
Blinded reading Follow-up (Months) Analysis types for survival
HR (95%CI) Quality score
Yu CP [6] 2009 China ESCC 168 (129/39) Staining index score6 Yes 80* OS 1.655 (1.095–2.495) 6 Song HT
[21]
2010 China CRC 146 (90/56) Staining index score4 Yes 70* OS 3.174 (1.698–5.931) 8
Liu DC [23]
2011 China GBAC 67 (19/48) Positive cells25% and staining intensity2
NR 18* OS 3.047 (1.420–6.560) 6
Sun W [24]
2011 China GBC 41 (16/25) Staining index score4 NR 60 OS 3.046 (1.195–7.761) 8
Xu JB [22]
2011 China GC 101 (61/44) Staining index score3 Yes 60 OS 2.110 (1.640–2.780) 8
Wang N [26]
2012 China CC 196 (94/102) positive cells25% and staining intensity2
Yes 103 OS 2.890 (1.060–6.690) 7
Jiang T [25]
2012 China CRC 520 (291/229) Positive cells1% NR 70* DSS 2.351 (1.422–4.537) 7
Gong ZB [27]
2012 China HCC 73 (62/11) Staining index score6 Yes 60* OS 7.314 (1.848–28.398) 7
Ahn S [28]
2013 Korea HCC 288 (237/51) Staining index score7 Yes 126 DFS 1.451 (1.082–1.944) 7
DSS 1.118 (0.746–1.673) Chen XJ
[38]
2013 China HCC 107 (73/34) Staining index score4 NR 72* DFS 3.431 (1.254–7.318) 7
Shi S [37]
2013 China PAC 89 (52/37) Staining index score7 Yes 33 OS 2.638 (1.537–4.528) 7
Casimiro S [30]
2014 Portugal CRC 85 (52/33) Positive cells>10% and Yes 60* OS 4.570 (1.390–14.990) 7
staining intensity2 RFS 5.070 (1.970–13.060) Li SH
[31]
2014 China GC 216 (80/136) Staining index score2 Yes 80* OS 3.345 (3.165–5.170) 6
Dong LP [32]
2014 China GC 119 (67/52) Staining index score2 Yes 60 OS 1.580 (0.860–2.900) 6
Li GH [33]
2014 China GC 93 (64/29) Staining index score3 NR 80* OS 1.520 (0.585–3.970) 6
Li Q [39] 2014 China HCC 87 (44/43) Staining index score2 Yes 60 OS 2.190 (1.240–3.950) 7 Huang Y
[34]
2014 China PDAC 105 (63/42) Staining index score4 Yes 35* OS 2.173 (1.288–4.055) 7
Gnosa S [29]
2014 Sweden RC 74 (NR) Staining intensity score2 Yes 193 RFS 0.360 (0.085–1.525) 6
DFS 0.790 (0.200–3.110) Zhang W
[41]
2015 China CAC 60 (32/28) Staining index score3 NR 70 OS 5.473 (1.068–28.053) 7
Wang B [35]
2015 China CRC 50 (29/21) NR NR 50* OS 1.228 (0.419–3.594) 7
Yang CC [18]
2015 China ESCC 77 (NR) Staining index score6 Yes 80* OS 1.852 (1.013–3.387) 7
Jung HL [36]
2015 Korea HCC 85 (69/16) Staining index score3 Yes 130* OS 4.756 (1.697–13.329) 7
Li JM [40]
2015 China HCC 152 (132/20) Staining index score7 NR 80* OS 1.736 (1.106–2.726) 7
N (M/F): number (male/female); HR: hazard ratio; CI: confidence interval; ESCC: esophageal squamous cell carcinoma; C(R)C: colon (rectal) carcinoma; GB(A)C: gallbladder (adeno) carcinoma; GC: gastric carcinoma; P(D)AC: pancreatic (ductal) adenocarcinoma; HCC: hepatocellular carcinoma; OS: overall survival; DSS: disease-specific survival; DFS: disease-free survival; RFS: relapse-free survival; NR: not report
*: approximate times extracted form survival curve.
Heterogeneity was detected in studies evaluating DSS (Q = 4.25, P = 0.039), RFS (Q = 4.25, P = 0.003) as well as the subgroup of GC (Q = 10.18, P = 0.017). No heterogeneity existed
among other groups of studies (P>0.05).
Publication Bias
We did not perform Begg’s test for DFS, DSS or RFS because of the limited scale of studies
included. For OS, no publication bias appeared among 19 studies included in our meta-analysis according to funnel plots (Fig 6, P = 0.054). For the studies evaluating the associations of AEG-1 SI with clinicopathological features, no publication bias was observed in the group of histo-logical differentiation (Fig 7A, P = 0.322), T classification (Fig 7B, P = 1.000), N classification (Fig 7C, P = 0.067) or M classification (Fig 7D, P = 0.102).
Discussion
AEG-1 has attracted attention of numerous researchers since 2002 for its potential vital con-nection with tumor aggression and prognosis. Recently, several studies demonstrated that
overexpression of AEG-1 was associated with clinical prognosis in different cancers [6,21,22,
42–44]. In addition, reviews have comprehensively summarized the crucial role that AEG-1
might play in the prognosis of cancers [45,46]. In gastrointestinal tumors, lots of research
explored the relationship between AEG-1 SI and clinical parameters including follow-up rec-ords. Nevertheless, the results were not consistent. We conducted the current quantitative meta-analysis by merging the results of published literature in order to draw a clearer conclu-sion on the relationships between AEG-1 SI and clinicopathological features as well as progno-sis in patients with gastrointestinal tumors.
Recently, a meta-analysis [18], with 10 studies enrolled, demonstrated that values of AEG-1 SI were significantly different between SCC tissues and corresponding normal adjacent tissues, and later discovered that AEG-1 SI was associated with lymph node metastasis, clinical stage and T classification. Indeed, the published meta-analysis has provided readers with the unprec-edentedly constructive knowledge over the crucial role that AEG-1 plays in tumor aggression. However, in the previous meta-analysis [18], the prognostic significance of AEG-1 SI was not well established and the scarcity of patients involved added to its deficiencies. In our meta-anal-ysis, we combined the data extracted from 23 studies, involving 2999 patients in total, concern-ing the associations of AEG-1 SI with clinicopathological features and prognosis. AEG-1 was detected by IHC in all included studies. Meanwhile, all the included studies harbored high
methodological qualities (5 stars), which were evaluated and verified by NOS. For
clinico-pathological features, the results of meta-analysis indicated that high AEG-1 SI significantly
Table 2. Combinations of data evaluating the relationships between AEG-1 SI and clinicopathological parameters. Clinicopathological parameters Studies
(n)
Test group Control group Meta-analysis model
OR (95%CI) P
Events Total Events Total
Histological differentiation (Poorly/Well-Moderately)
16 (2398) 530 816 779 1582 Random 2.129 (1.377–3.290) 0.001
T classification (T3-T4/T1-T2) 13 (1637) 632 930 395 707 Random 2.272 (1.147–4.502) 0.019 N classification (N1-N3/N0) 15 (1751) 605 846 461 905 Fixed 2.696 (2.178–3.337) <0.001 M classification (M1/M0) 11 (1886) 214 287 782 1599 Random 3.731 (2.167–6.426) <0.001
OR: odds ratio; CI: confidence interval.
Fig 2. Meta-analysis evaluating the relationships between AEG-1 SI and clinicopathological parameters in patients with gastrointestinal cancer.A, histological differentiation (random effect model); B, T classification (random effect model); C, N classification (fixed effect model); D, M classification (random effect model).
Table 3. Meta-analysis of included studies and subgroup analysis assessing the association between AEG-1 SI and clinical prognosis.
Groups Studies (n)
Pooled HR with
fixed model (95%CI)
Test for heterogeneity
Pooled HR with random model
(95%CI)
Q P
Overall survival (OS)
19 (2010)
2.412 (2.136–2.723) 26.18 0.096 2.369 (2.005–2.800)
Cancer types
ESCC 2 (245) 1.715 (1.211–2.410) 0.09 0.763 1.715 (1.211–2.410) CRC 5 (537) 2.922 (1.921–4.444) 3.68 0.451 2.922 (1.921–4.444) GBC 2 (108) 3.047 (1.685–5.509) 0 1.000 3.047 (1.685–5.509) GC 4 (529) 2.545 (2.148–3.015) 10.18 0.017 2.255 (1.547–3.288) HCC 4 (397) 2.245 (1.620–3.113) 6.17 0.104 2.656 (1.554–4.540) PAC 2 (194) 2.408 (1.625–3.568) 0.23 0.630 2.408 (1.625–3.568) Disease-free
survival (DFS)
3 (469) 1.538 (1.171–2.020) 4.24 0.120 1.683 (0.878–3.227)
Disease-specific survival (DSS)
2 (808) 1.425 (1.023–1.985) 4.25 0.039 1.573 (0.761–3.250)
Relapse-free survival (RFS)
2 (159) 2.291 (1.039–5.053) 9.02 0.003 1.432 (0.108–19.085)
ESCC: esophageal squamous cell carcinoma; CRC: colorectal carcinoma; GBC: gallbladder carcinoma; GC: gastric carcinoma; HCC: hepatocellular carcinoma; PAC: pancreatic adenocarcinoma.
doi:10.1371/journal.pone.0145659.t003
Fig 3. Meta-analysis of included studies evaluating the association between AEG-1 SI and overall survival (OS) (fixed effect model).
correlated with deteriorated situations in general, including histological differentiation
(OR = 2.129, 95%CI: 1.377–3.290), depth of tumor invasion (OR = 2.272, 95%CI: 1.147–
4.502), lymph node metastasis (OR = 2.696, 95%CI: 2.178–3.337) and distant metastasis
Fig 4. Meta-analysis of included studies evaluating the association between AEG-1 SI and disease-free survival (DFS) (fixed effect model).
doi:10.1371/journal.pone.0145659.g004
Fig 5. Meta-analysis of included studies evaluating the associations of AEG-1 SI with disease-specific survival (DSS) (random effect model) and relapse survival (RFS) (random effect model).
(OR = 3.731, 95%CI: 2.167–6.426). For the prognosis of patients with gastrointestinal cancers, our meta-analysis suggested that high AEG-1 SI was significantly associated with poor OS
(HR = 2.412, 95%CI: 2.136–2.723) and DFS (HR = 1.538, 95%CI: 1.171–2.020), but no
statisti-cally significant results were observed in terms of DSS (HR = 1.573, 95%CI: 0.761–3.250) and
RFS (HR = 1.432, 95%CI: 0.108–19.085). Meantime, subgroup analyses implied that AEG-1 SI
significantly correlated with all the gastrointestinal cancers, including ESCC, CRC, GBC, GC,
Fig 6. A funnel plot was used to estimate potential publication bias.(Begg’s method was employed.) doi:10.1371/journal.pone.0145659.g006
Fig 7. Funnel plots were applied to estimate potential publication bias.A, histological differentiation. B, T classification. C, N classification. D, M classification. (Begg’s method was employed.)
HCC and PAC. According to our meta-analysis, AEG-1 seems to be a novel biomarker reflect-ing the status of aggression, which was partly identified by the previous meta-analysis, and pre-dicting the state of prognosis, which underlined the novelty of the current study. Nonetheless, the results mainly presented the circumstances in Asia since the population included in the current meta-analysis mainly consisted of Asians. Whether the novel biomarker would be also suitable for the patients from other regions should be further tested and verified in the oncom-ing clinical trials in different countries.
In the light of the current meta-analysis, high AEG-1 SI effectively indicated aggravated tumor progression and poor prognosis in gastrointestinal cancers. Moreover, AEG-1 mediates drug resistance via multiple mechanisms [47]. Consequently, down-regulation of AEG-1 mRNA or suppression of relative signal pathways by drugs or siRNA might be a feasible strat-egy to treat gastrointestinal cancers. Recently, literature have demonstrated that down-regu-lated AEG-1 expression by siRNA effectively inhibited cell proliferation, invasion and
metastasis, induced cell apoptosis and altered cell cycle in gastrointestinal cancers [7,37,48–
51]. According to Devaraja Rajasekaran et al., combination of nanoparticle-delivered siRNA for AEG-1 and all-trans retinoic acid (ATRA) was an effective strategy to combat HCC [52]. Furthermore, it was reported that perifosine might be a targeted therapy drug which sup-pressed AEG-1 gene expression by inhibiting Akt/GSK3b/C-MYC signaling pathway in GC [53]. In summary, AEG-1 is a potential target to cure gastrointestinal cancers and more clinic trails for AEG-1 targeted drugs are required to explore therapeutic value of the novel bio-marker AEG-1.
Heterogeneity is among the delicate issues that should be dealt with carefully since there exist potential risks for it to adversely affect the combinations of values in meta-analysis [54]. In our
meta-analysis, heterogeneity was noted in the studies with DSS and RFS (P<0.05). When
com-bining the OR values for clinicopathological features, heterogeneity also emerged in the groups of
histological differentiation, T classification, and M classification (P<0.05). To tackle and
mini-mize the effects of heterogeneity, random effect model was employed for combinations of related data. Publication bias should be considered in meta-analysis given the fact that papers with
posi-tive results often share greater chances to get published. According to Begg’s test and funnel plots
in our meta-analysis, no publication bias was observed in either studies with OS data or groups
of histological differentiation, T classification or N classification (P>0.05).
In spite of heterogeneity and publication bias, there were still some unavoidable limitations in the current meta-analysis. Firstly, only studies reported in either English or Chinese were included, which might result in omitting some qualified papers due to language criteria. Sec-ondly, since some eligible reports did not present the results of multivariate analysis directly, related data needed to be extracted from Kaplan-Meier curves, which might lead to a less accu-rate HR. Meanwhile, different cut off values for AEG-1 SI in studies were also a factor to pro-duce bias. Moreover, there were different subtypes and locations of various gastrointestinal cancers, which might generate unavoidable clinical biases. Finally, follow-up periods and dura-tions varied considerably and there were censored cases in different studies, which might cause biased HR values to a certain degree.
Supporting Information
S1 File. Process of search, data extraction and combination. (PPTX)
S2 File. Studies excluded for reasons. (DOCX)
S1 Table. PRISMA Checklist. (DOC)
Acknowledgments
The study was partly supported by the Fund of Guangxi Zhuang Autonomous Region Univer-sity Student Innovative Plan (No. 201410598003), Guangxi Provincial Health Bureau Scientific Research Project (Z2014054), Youth Science Foundation of Guangxi Medical University (GXMUYSF201311), Guangxi University Science and Technology Research Projects (LX2014075), and the Fund of National Natural Science Foundation of China
(NSFC81360327). The funders had no role in study design, data collection and analysis, prepa-ration of the manuscript, or decision to publish.
Author Contributions
Conceived and designed the experiments: YL YD GC. Performed the experiments: YL XZ ZT PW XX. Analyzed the data: YL XZ ZT PW XX. Wrote the paper: YL XZ ZT PW XX. Corrected the manuscript: YD GC.
References
1. Torre LA, Bray F, Siegel RL, Ferlay J, Lortet-Tieulent J, Jemal A. Global cancer statistics, 2012. CA: a cancer journal for clinicians. 2015; 65(2):87–108. doi:10.3322/caac.21262PMID:25651787.
2. Brown DM, Ruoslahti E. Metadherin, a cell surface protein in breast tumors that mediates lung metasta-sis. Cancer cell. 2004; 5(4):365–74. doi:10.1016/s1535-6108(04)00079-0PMID:
WOS:000221157600011.
3. Britt DE, Yang DF, Yang DQ, Flanagan D, Callanan H, Lim YP, et al. Identification of a novel protein, LYRIC, localized to tight junctions of polarized epithelial cells. Experimental cell research. 2004; 300 (1):134–48. doi:10.1016/j.yexcr.2004.06.026PMID:15383321.
4. Su ZZ, Kang DC, Chen Y, Pekarskaya O, Chao W, Volsky DJ, et al. Identification and cloning of human astrocyte genes displaying elevated expression after infection with HIV-1 or exposure to HIV-1 envelope glycoprotein by rapid subtraction hybridization, RaSH. Oncogene. 2002; 21(22):3592–602. doi:10.1038/ sj.onc.1205445PMID:12032861.
5. Hu G, Chong RA, Yang Q, Wei Y, Blanco MA, Li F, et al. MTDH activation by 8q22 genomic gain pro-motes chemoresistance and metastasis of poor-prognosis breast cancer. Cancer cell. 2009; 15(1):9–20. Epub 2008/12/30. doi:10.1016/j.ccr.2008.11.013PMID:19111877; PubMed Central PMCID:
PMCPmc2676231.
6. Yu C, Chen K, Zheng H, Guo X, Jia W, Li M, et al. Overexpression of astrocyte elevated gene-1 (AEG-1) is associated with esophageal squamous cell carcinoma (ESCC) progression and pathogenesis. Carci-nogenesis. 2009; 30(5):894–901. Epub 2009/03/24. doi:10.1093/carcin/bgp064PMID:19304953.
7. Yoo BK, Emdad L, Su ZZ, Villanueva A, Chiang DY, Mukhopadhyay ND, et al. Astrocyte elevated gene-1 regulates hepatocellular carcinoma development and progression. The Journal of clinical investigation. 2009; 119(3):465–77. Epub 2009/02/18. doi:10.1172/jci36460PMID:19221438; PubMed Central PMCID: PMCPmc2648696.
8. Lee SG, Jeon HY, Su ZZ, Richards JE, Vozhilla N, Sarkar D, et al. Astrocyte elevated gene-1 contributes to the pathogenesis of neuroblastoma. Oncogene. 2009; 28(26):2476–84. Epub 2009/05/19. doi:10. 1038/onc.2009.93PMID:19448665.
9. Liu X, Zhang N, Li X, Moran MS, Yuan C, Yan S, et al. Identification of novel variants of metadherin in breast cancer. PloS one. 2011; 6(3):e17582. Epub 2011/03/17. doi:10.1371/journal.pone.0017582
10. Kikuno N, Shiina H, Urakami S, Kawamoto K, Hirata H, Tanaka Y, et al. Knockdown of astrocyte-elevated gene-1 inhibits prostate cancer progression through upregulation of FOXO3a activity. Oncogene. 2007; 26(55):7647–55. Epub 2007/06/15. doi:10.1038/sj.onc.1210572PMID:17563745.
11. Emdad L, Sarkar D, Lee SG, Su ZZ, Yoo BK, Dash R, et al. Astrocyte elevated gene-1: a novel target for human glioma therapy. Molecular cancer therapeutics. 2010; 9(1):79–88. Epub 2010/01/08. doi:10.1158/ 1535-7163.mct-09-0752PMID:20053777; PubMed Central PMCID: PMCPmc3165052.
12. Sarkar D, Park ES, Emdad L, Lee SG, Su ZZ, Fisher PB. Molecular basis of nuclear factor-kappaB activa-tion by astrocyte elevated gene-1. Cancer research. 2008; 68(5):1478–84. Epub 2008/03/05. doi:10. 1158/0008-5472.can-07-6164PMID:18316612.
13. Lee SG, Su ZZ, Emdad L, Sarkar D, Franke TF, Fisher PB. Astrocyte elevated gene-1 activates cell sur-vival pathways through PI3K-Akt signaling. Oncogene. 2008; 27(8):1114–21. Epub 2007/08/21. doi:10. 1038/sj.onc.1210713PMID:17704808.
14. Lee SG, Su ZZ, Emdad L, Sarkar D, Fisher PB. Astrocyte elevated gene-1 (AEG-1) is a target gene of oncogenic Ha-ras requiring phosphatidylinositol 3-kinase and c-Myc. Proceedings of the National Acad-emy of Sciences of the United States of America. 2006; 103(46):17390–5. Epub 2006/11/08. doi:10. 1073/pnas.0608386103PMID:17088530; PubMed Central PMCID: PMCPmc1859939.
15. Hu G, Wei Y, Kang Y. The multifaceted role of MTDH/AEG-1 in cancer progression. Clinical cancer research: an official journal of the American Association for Cancer Research. 2009; 15(18):5615–20. Epub 2009/09/03. doi:10.1158/1078-0432.ccr-09-0049PMID:19723648; PubMed Central PMCID: PMCPmc2747034.
16. Srivastava J, Robertson CL, Gredler R, Siddiq A, Rajasekaran D, Akiel MA, et al. Astrocyte Elevated Gene-1 (AEG-1) Contributes to Non-thyroidal Illness Syndrome (NTIS) Associated with Hepatocellular Carcinoma (HCC). The Journal of biological chemistry. 2015; 290(25):15549–58. Epub 2015/05/07. doi:
10.1074/jbc.M115.649707PMID:25944909; PubMed Central PMCID: PMCPmc4505468.
17. Emdad L, Lee SG, Su ZZ, Jeon HY, Boukerche H, Sarkar D, et al. Astrocyte elevated gene-1 (AEG-1) functions as an oncogene and regulates angiogenesis. Proceedings of the National Academy of Sciences of the United States of America. 2009; 106(50):21300–5. Epub 2009/11/27. doi:10.1073/pnas.
0910936106PMID:19940250; PubMed Central PMCID: PMCPmc2795510.
18. Yang C, Zheng S, Liu Q, Liu T, Lu M, Dai F, et al. Metadherin is required for the proliferation, migration, and invasion of esophageal squamous cell carcinoma and its meta-analysis. Translational research: the journal of laboratory and clinical medicine. 2015. Epub 2015/06/09. doi:10.1016/j.trsl.2015.05.004PMID:
26051629.
19. Stang A. Critical evaluation of the Newcastle-Ottawa scale for the assessment of the quality of nonrando-mized studies in meta-analyses. European journal of epidemiology. 2010; 25(9):603–5. doi:10.1007/ s10654-010-9491-zPMID:20652370.
20. Tierney JF, Stewart LA, Ghersi D, Burdett S, Sydes MR. Practical methods for incorporating summary time-to-event data into meta-analysis. Trials. 2007; 8:16. doi:10.1186/1745-6215-8-16PMID:17555582; PubMed Central PMCID: PMC1920534.
21. Song H, Li C, Li R, Geng J. Prognostic significance of AEG-1 expression in colorectal carcinoma. Interna-tional journal of colorectal disease. 2010; 25(10):1201–9. Epub 2010/07/14. doi: 10.1007/s00384-010-1009-3PMID:20625905.
22. Jian-bo X, Hui W, Yu-long H, Chang-hua Z, Long-juan Z, Shi-rong C, et al. Astrocyte-elevated gene-1 overexpression is associated with poor prognosis in gastric cancer. Medical oncology (Northwood, Lon-don, England). 2011; 28(2):455–62. Epub 2010/03/20. doi:10.1007/s12032-010-9475-6PMID:
20300973.
23. Liu DC, Yang ZL. MTDH and EphA7 are markers for metastasis and poor prognosis of gallbladder adeno-carcinoma. Diagnostic cytopathology. 2013; 41(3):199–205. Epub 2011/10/04. doi:10.1002/dc.21821
PMID:21964981.
24. Sun W, Fan YZ, Xi H, Lu XS, Ye C, Zhang JT. Astrocyte elevated gene-1 overexpression in human pri-mary gallbladder carcinomas: an unfavorable and independent prognostic factor. Oncology reports. 2011; 26(5):1133–42. Epub 2011/07/14. doi:10.3892/or.2011.1387PMID:21750868.
25. Jiang T, Zhu A, Zhu Y, Piao D. Clinical implications of AEG-1 in liver metastasis of colorectal cancer. Med-ical oncology (Northwood, London, England). 2012; 29(4):2858–63. Epub 2012/02/22. doi:10.1007/ s12032-012-0186-zPMID:22351252.
26. Wang N, Du X, Zang L, Song N, Yang T, Dong R, et al. Prognostic impact of Metadherin-SND1 interaction in colon cancer. Molecular biology reports. 2012; 39(12):10497–504. Epub 2012/10/16. doi:10.1007/ s11033-012-1933-0PMID:23065261.
28. Ahn S, Hyeon J, Park CK. Metadherin is a prognostic predictor of hepatocellular carcinoma after curative hepatectomy. Gut and liver. 2013; 7(2):206–12. Epub 2013/04/06. doi:10.5009/gnl.2013.7.2.206PMID:
23560157; PubMed Central PMCID: PMCPmc3607775.
29. Gnosa S, Zhang H, Brodin VP, Carstensen J, Adell G, Sun XF. AEG-1 expression is an independent prognostic factor in rectal cancer patients with preoperative radiotherapy: a study in a Swedish clinical trial. British journal of cancer. 2014; 111(1):166–73. Epub 2014/05/31. doi:10.1038/bjc.2014.250PMID:
24874474; PubMed Central PMCID: PMCPmc4090728.
30. Casimiro S, Fernandes A, Oliveira AG, Franco M, Pires R, Peres M, et al. Metadherin expression and lung relapse in patients with colorectal carcinoma. Clinical & experimental metastasis. 2014; 31(6):689–
96. Epub 2014/06/21. doi:10.1007/s10585-014-9659-0PMID:24946951.
31. Li S, Guo X, Ma X, Tang C, Ke Z, Huang W. Expression of astrocyte elevated gene-1 closely correlates with the angiogenesis of gastric cancer. Oncology letters. 2014; 7(5):1447–54. Epub 2014/04/26. doi:10. 3892/ol.2014.1950PMID:24765154; PubMed Central PMCID: PMCPmc3997719.
32. Dong L, Qin S, Li Y, Zhao L, Dong S, Wang Y, et al. High expression of astrocyte elevated gene-1 is asso-ciated with clinical staging, metastasis, and unfavorable prognosis in gastric carcinoma. Tumour biology: the journal of the International Society for Oncodevelopmental Biology and Medicine. 2015; 36(3):2169–
78. Epub 2014/11/20. doi:10.1007/s13277-014-2827-7PMID:25407490.
33. Li G, Wang Z, Ye J, Zhang X, Wu H, Peng J, et al. Uncontrolled inflammation induced by AEG-1 promotes gastric cancer and poor prognosis. Cancer research. 2014; 74(19):5541–52. Epub 2014/08/06. doi:10. 1158/0008-5472.can-14-0968PMID:25092897.
34. Zhao J, Wang W, Huang Y, Wu J, Chen M, Cui P, et al. HBx elevates oncoprotein AEG-1 expression to promote cell migration by downregulating miR-375 and miR-136 in malignant hepatocytes. DNA and cell biology. 2014; 33(10):715–22. Epub 2014/07/23. doi:10.1089/dna.2014.2376PMID:25050974.
35. Wang B, Shen ZL, Jiang KW, Zhao G, Wang CY, Yan YC, et al. MicroRNA-217 functions as a prognosis predictor and inhibits colorectal cancer cell proliferation and invasion via an AEG-1 dependent mecha-nism. BMC cancer. 2015; 15:437. Epub 2015/05/29. doi:10.1186/s12885-015-1438-zPMID:26016795; PubMed Central PMCID: PMCPmc4446846.
36. Jung HI, Ahn T, Bae SH, Chung JC, Kim H, Chin S, et al. Astrocyte elevated gene-1 overexpression in hepatocellular carcinoma: an independent prognostic factor. Annals of surgical treatment and research. 2015; 88(2):77–85. Epub 2015/02/19. doi:10.4174/astr.2015.88.2.77PMID:25692118; PubMed Central PMCID: PMCPmc4325651.
37. Wang K, Lim HY, Shi S, Lee J, Deng S, Xie T, et al. Genomic landscape of copy number aberrations enables the identification of oncogenic drivers in hepatocellular carcinoma. Hepatology (Baltimore, Md). 2013; 58(2):706–17. Epub 2013/03/19. doi:10.1002/hep.26402PMID:23505090.
38. Chen X, Shen Y, Wang J, Zhong Z, Pan H. Expressions and prognostic value of metadherin, E-cadherin, and p-catenin in patients with hepatocellular carcinoma. Chin J Hepatobiliary Surg. 2013; 19(8):597–600. doi:10.3760/cma.j.issn.1007-8118.2013.08.011
39. Li Q, Han T, Li K, Li W, Zhao L, Han Y, et al. LYRIC in hepatocellular carcinoma: Expression and potential prognostic significance. Chin J Cancer Biother. 2014;(05: ):565–9.
40. Li J, Huang Z, Zhou G. High expression of metadherin in alpha fetoprotein negative hepatocellular carci-noma patients following curative hepatectomy and its significance. Chin J Bases Clin General Surg. 2015;(05: ):597–600.
41. Li C, Wu X, Zhang H, Yang G, Hao M, Sheng S, et al. A Huaier polysaccharide restrains hepatocellular carcinoma growth and metastasis by suppression angiogenesis. International journal of biological macro-molecules. 2015; 75:115–20. Epub 2015/01/20. doi:10.1016/j.ijbiomac.2015.01.016PMID:25597429.
42. Song L, Li W, Zhang H, Liao W, Dai T, Yu C, et al. Over-expression of AEG-1 significantly associates with tumour aggressiveness and poor prognosis in human non-small cell lung cancer. The Journal of pathol-ogy. 2009; 219(3):317–26. Epub 2009/08/01. doi:10.1002/path.2595PMID:19644957.
43. Song H, Li C, Lu R, Zhang Y, Geng J. Expression of astrocyte elevated gene-1: a novel marker of the pathogenesis, progression, and poor prognosis for endometrial cancer. International journal of gyneco-logical cancer: official journal of the International Gynecogyneco-logical Cancer Society. 2010; 20(7):1188–96. Epub 2011/04/19. PMID:21495225.
44. Nohata N, Hanazawa T, Kikkawa N, Mutallip M, Sakurai D, Fujimura L, et al. Tumor suppressive micro-RNA-375 regulates oncogene AEG-1/MTDH in head and neck squamous cell carcinoma (HNSCC). Jour-nal of human genetics. 2011; 56(8):595–601. Epub 2011/07/15. doi:10.1038/jhg.2011.66PMID:
21753766.
46. Sarkar D, Fisher PB. AEG-1/MTDH/LYRIC: clinical significance. Advances in cancer research. 2013; 120:39–74. Epub 2013/07/31. doi:10.1016/b978-0-12-401676-7.00002–4PMID:23889987; PubMed Central PMCID: PMCPmc3924591.
47. Meng X, Thiel KW, Leslie KK. Drug resistance mediated by AEG-1/MTDH/LYRIC. Advances in cancer research. 2013; 120:135–57. Epub 2013/07/31. doi:10.1016/b978-0-12-401676-7.00005-xPMID:
23889990; PubMed Central PMCID: PMCPmc3967868.
48. Zhou Z, Deng H, Yan W, Luo M, Tu W, Xia Y, et al. AEG-1 promotes anoikis resistance and orientation chemotaxis in hepatocellular carcinoma cells. PloS one. 2014; 9(6):e100372. Epub 2014/06/19. doi:10. 1371/journal.pone.0100372PMID:24941119; PubMed Central PMCID: PMCPmc4062488.
49. Deng H, Zhou Z, Tu W, Xia Y, Huang H, Tian D. Knockdown of astrocyte elevated gene-1 inhibits growth through suppression of IL-6 secretion in HepG2 human hepatoma cells. Oncology letters. 2014; 7 (1):101–6. Epub 2013/12/19. doi:10.3892/ol.2013.1645PMID:24348829; PubMed Central PMCID: PMCPmc3861575.
50. Zhang CF, Xia YH, Zheng QF, Li ZJ, Guo XH, Zhou HC, et al. [Effect of silencing AEG-1 with small inter-fering RNA on the proliferation and cell cycle of gastric carcinoma SGC-7901 cells]. Zhonghua zhong liu za zhi [Chinese journal of oncology]. 2013; 35(1):22–7. doi:10.3760/cma.j.issn.0253-3766.2013.01.005
PMID:23648295.
51. Zhang F, Yang Q, Meng F, Shi H, Li H, Liang Y, et al. Astrocyte elevated gene-1 interacts with beta-cate-nin and increases migration and invasion of colorectal carcinoma. Molecular carcinogenesis. 2013; 52 (8):603–10. doi:10.1002/mc.21894PMID:22431469.
52. Rajasekaran D, Srivastava J, Ebeid K, Gredler R, Akiel M, Jariwala N, et al. Combination of Nanoparticle-Delivered siRNA for Astrocyte Elevated Gene-1 (AEG-1) and All-trans Retinoic Acid (ATRA): An Effective Therapeutic Strategy for Hepatocellular Carcinoma (HCC). Bioconjugate chemistry. 2015. Epub 2015/06/ 17. doi:10.1021/acs.bioconjchem.5b00254PMID:26079152.
53. Huang W, Yang L, Liang S, Liu D, Chen X, Ma Z, et al. AEG-1 is a target of perifosine and is over-expressed in gastric dysplasia and cancers. Digestive diseases and sciences. 2013; 58(10):2873–80. doi:10.1007/s10620-013-2735-5PMID:23912246.