Oligonucleotide Microarray Analysis of Dietary-Induced
Hyperlipidemia Gene Expression Profiles in Miniature
Pigs
Junko Takahashi1*, Shiori Waki2,3, Rena Matsumoto2, Junji Odake2, Takayuki Miyaji2, Junichi Tottori4, Takehiro Iwanaga4, Hitoshi Iwahashi2,3
1National Metrology Institute of Japan, National Institute of Advanced Industrial Science and Technology, Tsukuba, Ibaraki, Japan,2Health Research Institute, National
Institute of Advanced Industrial Science and Technology, Takamatsu, Kagawa, Japan,3Faculty of Applied Biological Sciences, Gifu University, Gifu, Japan,4Japan Farm
Co., Ltd, Kagoshima, Japan
Abstract
Background:Hyperlipidemia animal models have been established, but complete gene expression profiles of the transition
from normal lipid levels have not been obtained. Miniature pigs are useful model animals for gene expression studies on dietary-induced hyperlipidemia because they have a similar anatomy and digestive physiology to humans, and blood samples can be obtained from them repeatedly.
Methodology: Two typical dietary treatments were used for dietary-induced hyperlipidemia models, by using specific
pathogen-free (SPF) Clawn miniature pigs. One was a fat and cholesterol diet (HFCD) and the other was a high-fat, high-cholesterol, and high-sucrose diet (HFCSD). Microarray analyses were conducted from whole blood samples during the dietary period and from white blood cells at the end of the dietary period to evaluate the transition of expression profiles of the two dietary models.
Principal Findings:Variations in whole blood gene expression intensity within the HFCD or the HFCSD group were in the
same range as the controls provide with normal diet at all periods. This indicates uniformity of dietary-induced hyperlipidemia for our dietary protocols. Gene ontology- (GO) based functional analyses revealed that characteristics of the common changes between HFCD and HFCSD were involved in inflammatory responses and reproduction. The correlation coefficient between whole blood and white blood cell expression profiles at 27 weeks with the HFCSD diet was significantly lower than that of the control and HFCD diet groups. This may be due to the effects of RNA originating from the tissues and/or organs.
Conclusions: No statistically significant differences in fasting plasma lipids and glucose levels between the HFCD and
HFCSD groups were observed. However, blood RNA analyses revealed different characteristics corresponding to the dietary protocols. In this study, whole blood RNA analyses proved to be a useful tool to evaluate transitions in dietary-induced hyperlipidemia gene expression profiles in miniature pigs.
Citation:Takahashi J, Waki S, Matsumoto R, Odake J, Miyaji T, et al. (2012) Oligonucleotide Microarray Analysis of Dietary-Induced Hyperlipidemia Gene Expression Profiles in Miniature Pigs. PLoS ONE 7(5): e37581. doi:10.1371/journal.pone.0037581
Editor:Lynette Kay Rogers, The Ohio State Unversity, United States of America
ReceivedDecember 12, 2011;AcceptedApril 20, 2012;PublishedMay 25, 2012
Copyright:ß2012 Takahashi et al. This is an open-access article distributed under the terms of the Creative Commons Attribution License, which permits
unrestricted use, distribution, and reproduction in any medium, provided the original author and source are credited.
Funding:This work was partially supported by a Regional Innovation Creation R&D Programs from the Ministry of Economy, Trade and Industry (METI), Japan. The funders had no role in study design, data collection and analysis, decision to publish, or preparation of the manuscript. No additional external funding was received for this study.
Competing Interests:Employment: Dr. Junich Tottori (Japan Farm Co., Ltd), Mr. Takehiro Iwanaga (Japan Farm Co., Ltd). This does not alter the authors’ adherence to all the PLoS ONE policies on sharing data and materials.
* E-mail: [email protected]
Introduction
Hyperlipidemia is well recognized as a risk factor for cardiovascular disease (CVD). As diet represents the most important determinant of hyperlipidemia, dietary animal models can be useful for the study of CVD progression [1]. High-fat, high-cholesterol, and high-sugar diets have been shown to induce hyperlipidemia, obesity, and insulin resistance in humans and rodents [2–4]. Dietary-induced hyperlipidemia pig models have also been established [5–11].
Compared to rodents, pigs are a useful animal model for elucidating the molecular mechanisms underlying the transition from a healthy state to the progression of diseases caused by hyperlipidemia because they are able to breed stably over a long period, and have a similar anatomy and digestive physiology to humans [12,13]. In addition, miniature pigs are easier to breed and to handle than other non-primates are, making them a convenient species for preclinical tests [14]. In September 2003, the Swine Genome Sequencing Consortium (SGSC) was formed to promote pig genome sequencing under international coordina-tion [15]. The swine research environment has been enhanced
since members of the SGSC announced a completed swine genome map in November 2009 [16].
To evaluate temporal changes in gene expression profiles with the progression of dietary-induced alterations, minimally invasive blood sampling, which allows for the direct measurement of immune-responsive blood cells, excels over other invasive biopsy techniques for disease diagnostics and assessment of drug responses, as well as health monitoring. If biomarker candidate genes can be identified from blood analyses, these may be useful for diagnosis in humans. Use of whole blood is preferable to other specimens on two accounts. Firstly, RNA expression and degradation are susceptible to artificial manipulations such as cell separation and extraction. Whole blood manipulation can reduce these risks via the use of RNA blood collection tubes. Secondly, whole blood is an attractive prime tissue due to its critical role in immune responses, metabolism, and communication with cells and the extracellular matrix in almost all body tissues and organs. Whole blood will depart from the normal state when a considerable alteration occurs in some blood cell subpopulations, tissues, or organs. Moreover, blood samples can be obtained repeatedly from miniature pigs, and blood RNA contains an enormous amount of information on the expression of messenger RNA and non-coding functional RNA molecules that are not translated into proteins. Thus, analysis of blood RNA provides an opportunity to detect subtle changes in physiological state. We consider it particularly important to identify gene expression characteristics in whole blood. Microarray techniques allow the detection of genome-wide perturbations in response to different treatments and the measurement of various responses using a multitude of gene probes. Toxicogenomics, in which microarray techniques are specifically used in toxicology tests, has been widely recognized as one of the standard safety procedures for chemicals [17–19]. Gene expression microarrays have been used particularly for the screening of genes involved in specific biological processes of interest. Microarrays also allow the clustering of genes according to similar patterns of expression or functions. In this study, we conducted a series of whole blood microarray experiments to evaluate long-term alterations during 27-week feeding periods using specific pathogen-free (SPF) miniature pigs. There are two main types of dietary protocols for hyperlipide-mia pig models, one with cholesterol and animal lipids [5–9], and the other with cholesterol, animal lipids, and sucrose [10,11]. Some studies have focused primarily on a subset of genes, but this approach cannot elucidate whole blood RNA profiles during the process of change. We selected two typical dietary protocols. One was a high-fat and high-cholesterol diet (HFCD) containing 15% lard and 2% cholesterol; the other was a high-fat, high-cholesterol, and high-sucrose diet (HFCSD) containing 15% lard, 2% cholesterol, and 37% sucrose. The present microarray analyses of whole blood were conducted according to the following aspects. The first analysis dealt with similarity among individuals based on the correlation coefficient. Variation among individuals of the same dietary group and between the different dietary periods was examined. The second analysis addressed the function of genes. Up- or down-regulated genes for each dietary protocol were examined by functional categorization. While whole blood RNA derives from white blood cell RNA, whole blood gene expression profiles may not entirely correspond to those of white blood cells [20]. White blood cell microarray analyses conducted at the end of each dietary period are greatly influenced by diet, and the variations between the expression profiles of white blood cells and whole blood were assessed for each dietary group.
Results
Characteristics of study subjects
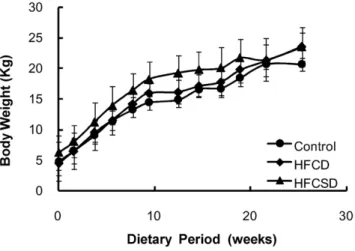
Temporal changes in mean body weights for the 3 dietary groups are shown in Figure 1. One-way ANOVA analysis for dietary-related variation revealed no significant difference at any feeding period except at week 12. In this study, the term ‘‘week’’ refers to the dietary period and not to the period since birth, unless otherwise stated. Table 1 lists the fasting plasma triglyceride concentrations for the group fed the high-fat, high-cholesterol diet (HFCD) and the group fed the high-fat, high-cholesterol, and high-sucrose diet (HFCSD). Almost no changes were observed in fasting plasma triglyceride levels. Fasting plasma total cholesterol concentrations had increased in the HFCD group and the HFCSD group by week 5 of the feeding period (P,0.001) and were maintained between 350 and 1150 mg/dL from weeks 10– 27 (Table 2). Fasting plasma high-density lipoprotein cholesterol (HDL-C) concentrations increased and showed significant differ-ences (P,0.001) from weeks 10–27 between two dietary treatment groups and control (Table 3). Fasting plasma low-density lipoprotein cholesterol (LDL-C) concentrations also increased and showed significant differences from weeks 5–27 between two dietary treatment groups and control (Table 4). Fasting plasma glucose concentrations remained unchanged (Table 5). The number of white blood cells and the ratios of granulocytes (basophiles, eosinophils, neutrophils, lymphocytes, and monocytes) to white blood cells were not statistically significant among the three test groups (Table 6–11). The liver (P,0.001) and spleen (P,0.01) weights were increased significantly compared to the controls in both the HFCD and HFCSD groups. In contrast, the heart, kidney, and stomach weights remained unchanged (Table 12).
Microarray gene expression profiles – Correlation of gene expression
RNA analyses were conducted on blood samples obtained at weeks 10, 19, and 27 of the feeding periods to characterize the dietary effects on gene expression profiles in whole blood and white blood cells of miniature pigs. Each RNA sample was analyzed by aporcine gene expression microarray consisting of 43603 oligonucleotide probes.
We evaluated variation in correlation coefficients among individuals on the same diet and between different diet groups.
Figure 1. Subject body weights.
Pearson correlation coefficients were used for the correlation analysis. Correlation coefficients for 45 microarrays in total were obtained for a normalized signals log-scale after excluding ‘‘absent’’ spots, definition of ‘‘absent’’ were described in Materials and Methods. A color-coded pairwise correlation matrix is displayed in Figure 2.
Figure 3 illustrates the mean correlation coefficients for gene expression profiles among individuals within the same dietary group, showed the individual difference of the gene expression profiles within the dietary groups during dietary period. Figure 4 presents the mean correlation coefficients for gene expression profiles among different diet groups. The correlation coefficients of whole blood expression profiles within the same diet groups were 0.97 (0.01) (mean (standard deviation; SD)), 0.94 (0.05), and 0.97 (0.01) for the control, HFCD, and HFCSD whole blood at 10 weeks, 0.94 (0.03), 0.93 (0.06), and 0.95 (0.01) at 19 weeks, and 0.95 (0.02), 0.95 (0.03), and 0.98 (0.01) at 27 weeks, respectively. The correlation coefficients of white blood cell expression profiles within the same dietary groups were 0.94 (0.05), 0.95 (0.03), and 0.96 (0.02) for the control, HFCD, and HFCSD groups at 27 weeks, respectively. Using Fisher’s Z-transformation to normalize the correlation distributions, no significant differences in correla-tion coefficients among dietary groups were observed at any period during the treatments. This indicates uniformity of dietary-induced hyperlipidemia for our protocols.
Next, we analyzed expression profile correlations among the different diet groups. In Figure 4, ‘‘control vs. HFCD’’ represents the mean correlation coefficient between control and HFCD group individuals. The whole blood correlation coefficients among
the different diet groups were 0.95 (0.04), 0.97 (0.01), and 0.96 (0.04) for control vs. HFCD, control vs. HFCSD, and HFCD vs. HFCSD at 10 weeks, 0.93 (0.03), 0.94 (0.02), and 0.95 (0.03) at 19 weeks, and 0.95 (0.03), 0.91 (0.03), and 0.95 (0.03) at 27 weeks, respectively. The white blood cell correlation coefficients among the different diet groups were 0.94 (0.04), 0.94 (0.03), and 0.96 (0.02) for control vs. HFCD, control vs. HFCSD, and HFCD vs. HFCSD at 27 weeks, respectively. Correlations of whole blood expression profiles were statistically significant according to an ANOVA test among all groups at 27 weeks, as a low correlation coefficient was obtained for the control vs. HFCSD groups. This indicates HFCSD differs much from control group and slightly from HFCD 27 weeks in whole blood gene expression profiles.
Figure 5 displays the average correlation coefficients between whole blood and white blood cell expression profiles within the same dietary group. The correlation coefficients were 0.83 (0.04), 0.79 (0.07), and 0.74 (0.05) for control, HFCD, and HFCSD at 27 weeks, respectively. Significant differences were observed between the control and HFCSD groups according to an ANOVA analysis using Fisher’s Z-transform (P,0.01).
Assigning known functions to gene expression - Gene ontology annotation
We identified up- and down-regulated genes and classified these according to function using information from the Gene Ontology (GO) Database to understand the observed differences in whole blood gene expression profiles for the different dietary groups. Top-ranked genes with fold changes in expression greater than 2.0 Table 1.Fasting plasma triglyceride levels (mg/dL).
Time point (weeks) Control HFCD HFCSD P{
0 44.5616.9 42.4614.4 37.8621.4 NS
5 25.367.2 22.0622.0 19.569.3 NS
10 21.062.3 30.4618.9 30.2614.7 NS
14 10.865.6 7.465.0 6.063.2 NS
19 10.263.6 14.2614.0 15.667.2 NS
23 16.867.6 8.263.6 8.663.2 ,.05
27 8.062.3 7.263.4 12.0613.5 NS
Values are mean6SD. NS; not significant.
{
Pvalues were calculated using a one-way factorial ANOVA.
doi:10.1371/journal.pone.0037581.t001
Table 2.Fasting plasma total cholesterol levels (mg/dL).
Time point
(weeks) Control HFCD HFCSD P{
0 99.0621.3 117.4622.2 100.4622.5 NS
5 103.864.8 620.06292.6 605.06131.2 ,.001
10 81.2611.1 780.06239.3 619.06205.3 ,.001
14 54.4612.4 646.76141.4 480.3643.3 ,.001
19 54.6611.9 745.46172.7 874.66208.4 ,.001
23 54.2616.9 562.66144.9 654.46219.2 ,.001
27 53.068.8 541.46148.5 689.46267.3 ,.001
Values are mean6SD. NS; not significant.
{
Pvalues were calculated using a one-way factorial ANOVA.
doi:10.1371/journal.pone.0037581.t002
Table 3.Fasting plasma HDL cholesterol levels (mg/dL).
Time point
(weeks) Control HFCD HFCSD P{
0 39.3611.8 50.3614.8 41.9611.5 NS
5 50.363.1 81.166.3 70.7619.8 NS
10 41.165.9 105.2630.2 96.2619.6 ,.001
14 36.265.4 99.3621.4 106.3614.9 ,.001
19 30.667.6 100.3622.7 117.9619.8 ,.001
23 31.468.7 122.368.2 110.7614.2 ,.001
27 29.164.5 119.2612.1 106.6614.6 ,.001
Values are mean6SD. NS; not significant.
{
Pvalues were calculated using a one-way factorial ANOVA.
doi:10.1371/journal.pone.0037581.t003
Table 4.Fasting plasma LDL cholesterol levels (mg/dL).
Time point
(weeks) Control HFCD HFCSD P{
0 56.8611.1 68.4620.6 56.4612.9 NS
5 54.065.0 318.86141.7 283.8649.5 ,.01
10 39.267.5 339.26146.5 259.26107.5 ,.01
14 21.865.6 212.06138.4 152.3643.3 ,.05
19 22.866.3 236.46102.7 248.2678.6 ,.001
23 20.869.4 220.66102.2 186.8646.7 ,.001
27 20.665.8 201.4685.2 193.4686.2 ,.01
Values are mean6SD. NS; not significant.
{
Pvalues were calculated using a one-way factorial ANOVA.
doi:10.1371/journal.pone.0037581.t004
Hyperlipidemia Gene Expression in Miniature Pigs
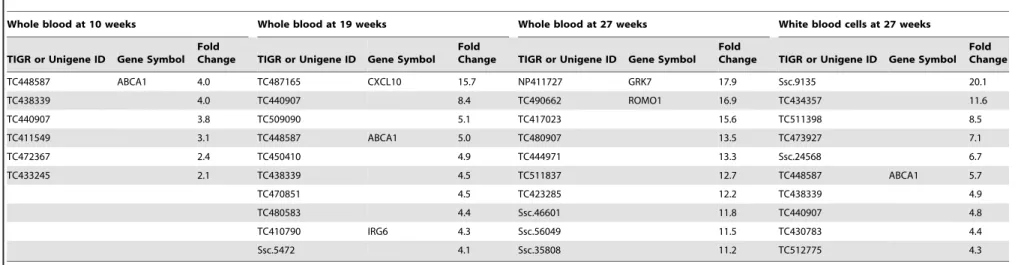
(p,0.05; HFCD, Table 13; HFSCD, Table 14) and less than 0.5 (p,0.05; HFCD, Table 15; HFSCD, Table 16) were selected at 10, 19, and 27 weeks. Genes TC440907, TC448587 (ABCA1), and TC438339 were ranked highest in HFCD and HFCSD during the dietary period. These genes were analyzed using the Database for Annotation, Visualization and Integrated Discovery (DAVID; Table 17, HFCD; Table 18, HFCSD). As a result, the GO categories of many genes up-regulated at the end of the 19-week dietary period in both HFCD and HFCSD groups were related to nucleotide binding (GO: 0000166, GO: GO: 0005524, 0005525, GO: 0017076, GO: 0019001, GO: 00032553, GO: 00032555, GO: 0032561). The GO categories of gene up-regulated after 19 weeks in the HFCD group only were related to catabolic processes (GO: 0009057, GO: 0019941, GO: 0030163, GO: 0043632, GO: 0044257, GO: 0044265,). Many genes down-regulated after 27 weeks in both HFCD and HFCSD groups were in the GO categories related to biological adhesion (GO: 0007155, GO: 0022610). In addition, many genes down-regulated at the end of the 27-week dietary period in the HFCSD group only were related to steroid metabolism and lipid biosynthesis (GO: 0006694, GO: 0008202, GO: 0008203, GO: 0008610, GO: 0016125, GO: 0016126).
To investigate potential reasons for the differences in gene expression among the diet groups during the dietary period, Chi-square tests were performed to identify whole blood GO categories for each treatment group vs. the control group. The expected values represented the number of up- and down-regulated genes bearing all GO annotations at each period of the diet, and the
observed values represented the number of up- and down-regulated genes bearing each specific GO term. A difference of p,0.05 between groups was considered significant. To identify up- and down-regulated genes, we compared levels of expression for each gene between the control vs. HFCD groups and between the control vs. HFCSD groups at each period using Student’st -tests. As the lowest number of genes for which the expectation frequency reached 1 or higher was 140 according to the conditions of observed value, the GO terms, which involve more than 140 genes, were used for the square tests. The results of the Chi-square tests for up- and down-regulated genes are listed in Tables 19–22. The correlation coefficients of constituent gene between whole blood and white blood cells at 27 weeks were calculated for each GO term.
Table 19 lists the GO terms for which significant differences were observed in the HFCD and HFCSD groups relative to the expected values. Inflammatory response elements (GO:0006954) were repressed in the HFCD group, and were both induced and repressed in the HFCSD group. The correlation coefficients between whole blood and white blood cells for expression levels of inflammatory response genes were 0.92 (0.03), 0.97 (0.02), and 0.95 (0.02) for the control, HFCD, and HFCSD groups, respectively. Genes involved in reproduction (GO:0000003) were induced in the HFCD group, and were both induced and repressed in the HFCSD group. The correlation coefficients for expression levels of genes involved in reproduction between whole blood and white blood cells were 0.91 (0.02), 0.93 (0.03), and 0.88 (0.03) for the control, HFCD, and HFCSD groups, respectively. Table 5.Fasting plasma glucose levels (mg/dL).
Time point
(weeks) Control HFCD HFCSD P{
0 111.8612.0 122.6648.5 119.2621.9 NS
5 98.6617.2 100.5612.0 100.0623.2 NS
10 93.8615.7 91.8627.0 83.0611.1 NS
14 116.4632.2 104.6615.6 108.6630.5 NS
19 92.4610.5 95.0613.1 88.8625.5 NS
23 87.6619.8 77.267.2 92.0619.2 NS
27 81.667.7 89.6614.6 101.0613.0 NS
Values are mean6SD. NS; not significant.
{
Pvalues were calculated using a one-way factorial ANOVA.
doi:10.1371/journal.pone.0037581.t005
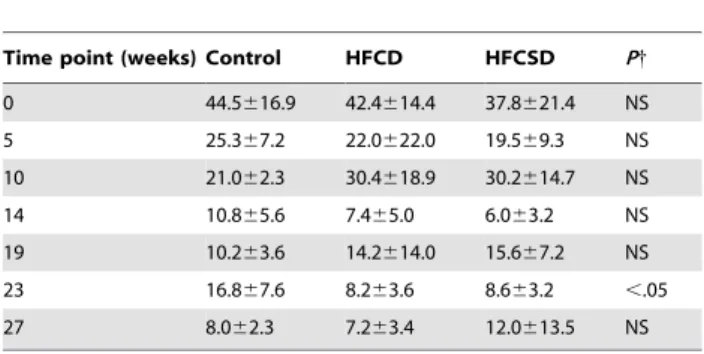
Table 6.White blood cell count (102/mL).
Time point
(weeks) Control HFCD HFCSD P{
0 45.8611.4 61.8617.1 65.0616.3 NS
5 68.6615.5 85.7614.6 90.0619.9 NS
10 67.6612.5 70.8623.0 78.4611.1 NS
14 69.465.2 87.2625.9 85.2613.3 NS
19 68.0614.8 69.6612.4 83.4613.7 NS
23 86.0621.6 90.2632.0 100.6626.1 NS
27 61.8615.2 75.8618.6 62.6634.4 NS
Values are the mean6SD. NS; not significant.
{
Pvalues were calculated using a one-way factorial ANOVA.
doi:10.1371/journal.pone.0037581.t006
Table 7.The ratio of basophils to white blood cells (%).
Time point (weeks) Control HFCD HFCSD P{
0 0.060.0 0.360.5 0.060.0 NS
5 0.260.4 0.060.0 0.260.4 NS
10 0.360.4 0.260.4 0.360.4 NS
14 0.260.4 0.060.0 0.460.5 NS
19 0.060.0 0.060.0 0.060.0 NS
23 0.260.4 0.060.0 0.060.0 NS
27 0.160.2 0.560.5 0.460.5 NS
Values are the mean6SD. NS; not significant.
{
Pvalues were calculated using a one-way factorial ANOVA.
doi:10.1371/journal.pone.0037581.t007
Table 8.The ratio of eosinophils to white blood cells (%).
Time point (weeks) Control HFCD HFCSD P{
0 2.862.6 2.861.5 2.062.2 NS
5 3.661.9 3.061.0 3.061.4 NS
10 3.161.4 3.261.3 4.161.7 NS
14 3.061.9 3.361.3 2.461.7 NS
19 5.062.7 4.160.7 5.661.8 NS
23 4.661.7 6.262.7 4.460.9 NS
27 2.860.8 3.161.9 3.461.1 NS
Values are the mean6SD. NS; not significant.
{
Pvalues were calculated using a one-way factorial ANOVA.
Table 20 lists the GO terms for which significant differences were observed in the HFCD group compared to the expected values. Muscle contraction (GO:0006936) and locomotor behavior (GO:0007626) elements were both induced and repressed. Muscle organ development (GO:0007517) and metabolic processes (GO:0008152) were repressed.
Table 21 lists the GO terms for which significant differences were observed in the HFCSD group compared to the expected values. Translation (GO:0006412), embryonic development end-ing in birth or egg hatchend-ing (GO:0009792), electron transport (GO:0006118), and transcription from the RNA polymerase II promoter (GO:0006366) elements were both induced and repressed. Positive regulation of growth rates (GO:0040010), nematode larval development (GO:0002119), intracellular protein transport (GO:0006886) and growth (GO:0040007) elements were induced. A cell surface receptor-linked signaling pathway (GO:0007166) and responses to hypoxia (GO:0001666) were repressed.
Table 22 lists the GO terms for which ratios to the expected values were unchanged in the HFCD and HFCSD groups. In addition, the ratios of up- and down-regulated genes to the each observed values were unchanged at 27 weeks.
Figure 6 depicts a scatter plot of correlation coefficients between whole blood and white blood cells for each GO term, selected for the Chi-square tests, at 27 weeks of each dietary treatment group relative to the control group. The slope of the HFCD to the controls regression line was 1.007 (p,0.001). The slope of the HFCSD to the controls regression line was 1.097 (p,0.001),
indicating that the correlation coefficients between whole blood and white blood cell expression levels for many GO terms were low. The predominant GO terms with low correlation coefficients in the HFCSD group were nervous system development (GO:0007399), biological processes (GO:0008150), signal trans-duction (GO:0007165), regulation of transcription, DNA-depen-dent (GO:0006355), and cell proliferation (GO:0008283). In contrast, the predominant GO terms with high correlation coefficients in the HFCSD group were skeletal system develop-ment (GO:0001501), small GTPase mediated signal transduction (GO:0007264), synaptic transmission (GO:0007268), cell surface receptor linked signaling pathway (GO:0007166), and transcrip-tion from the RNA polymerase II promoter (GO:0006366).
The intensity ratio of white blood cells to whole blood is a contribution indicator of the white blood cell RNA to whole blood gene expression. To focus on obesity-related organs, i.e., the liver, adipose tissue, and muscle, the relative numbers of ESTs for these organs to blood ESTs for each gene were calculated using EST profiles from the Unigene NCBI database of the transcriptome. The normalized EST values increase when the contribution indicator is small, as shown in Figure 7.
Discussion
This study aimed to evaluate the transition of gene expression profiles caused by dietary-induced hyperlipidemia through blood microarray analyses of miniature pigs during a 27-week dietary period.
Dietary-induced hyperlipidemia miniature pig models have previously been established. There are 2 main types of dietary protocol, one containing cholesterol and animal lipids [5–9], and Table 9.The ratio of neutrophils to white blood cells (%).
Time point
(weeks) Control HFCD HFCSD P{
0 52.8616.0 59.661.8 54.0615.5 NS
5 53.869.8 55.061.0 60.263.8 NS
10 43.1610.3 41.266.3 45.562.6 NS
14 44.867.4 53.0611.9 51.466.1 NS
19 52.267.0 48.165.4 44.864.1 NS
23 56.269.2 51.663.0 50.669.9 NS
27 58.8613.8 60.164.4 48.0618.5 NS
Values are the mean6SD. NS; not significant.
{
Pvalues were calculated using a one-way factorial ANOVA.
doi:10.1371/journal.pone.0037581.t009
Table 10.The ratio of lymphocytes to white blood cells (%).
Time point
(weeks) Control HFCD HFCSD P{
0 37.5611.0 31.164.0 36.8613.1 NS
5 34.8610.5 36.363.5 30.462.9 NS
10 45.267.4 45.866.0 44.763.0 NS
14 44.669.3 36.2610.7 39.266.4 NS
19 36.966.9 42.064.9 43.463.8 NS
23 33.667.6 34.062.9 39.6610.2 NS
27 32.3613.5 29.565.0 41.2619,5 NS
Values are the mean6SD. NS; not significant.
{
Pvalues were calculated using a one-way factorial ANOVA.
doi:10.1371/journal.pone.0037581.t010
Table 11.The ratio of monocytes to white blood cells (%).
Time point
(weeks) Control HFCD HFCSD P{
0 7.063.4 6.361.5 7.363.9 NS
5 7.663.1 5.762.5 6.261.8 NS
10 8.063.2 9.661.8 5.462.1 NS
14 7.461.5 7.560.9 6.662.3 NS
19 6.062.1 5.861.1 6.261.8 NS
23 5.461.3 8.261.9 5.262.1 N,.05
27 6.061.9 6.861.0 7.061.2 NS
Values are mean6SD. NS; not significant.
{
Pvalues were calculated using a one-way factorial ANOVA.
doi:10.1371/journal.pone.0037581.t011
Table 12.Effect of diet on organ weight of miniature pigs (g).
Organ Control HFCD HFCSD P{
Heart 149.765.5 163.364.2 153.7622.9 NS
Liver 328.0633.2 667.7680.9 682.3621.6 ,.001
Kidney 86.367.5 99.0612.5 97.764.9 NS
Stomach 169.3615.2 181.7613.8 180.0626.5 NS
Spleen 36.363.1 72.0612.2 74.7613.3 ,.01
Values are mean6SD. NS; not significant.
{
Pvalues were calculated using a one-way factorial ANOVA.
doi:10.1371/journal.pone.0037581.t012
Hyperlipidemia Gene Expression in Miniature Pigs
the other containing cholesterol, animal lipids, and sucrose [10,11]. Some studies have focused their attention on certain kinds of candidate genes with specific functions, but this has not clarified a complete projection of whole blood RNA profiles of the transitions caused by diet-induced hyperlipidemia. Excessive exposure to dietary fats and/or sugars is an essential factor in the initiation of obesity and metabolic syndrome-associated pathologies, two typical conditions associated with diet-induced hyperlipidemia. The fasting plasma total cholesterol level in-creased within a month, and then, either remained high or decreased in the high-fat and high-cholesterol diet (HFCD) models [5,6,9]. In contrast, fasting plasma total cholesterol levels increased throughout the dietary period in the high-fat, high-cholesterol, and high-sucrose diet (HFCSD) models [11]. Therefore, in the present study, hyperlipidemia was induced by the administration of a high-fat and high-cholesterol diet or a high-high-fat, high-cholesterol, and high sucrose diet to Clawn miniature swine.
Fasting plasma lipid values increased rapidly and were maintained at a high level during the 27-week feeding period under both feeding treatments. However, fasting plasma glucose concentrations remained unchanged. The liver and spleen weights increased significantly after the 27 weeks, and fatty livers were reported based on autopsies of individuals from both treatment groups. There was no significant difference in body weight, hematology, or other biochemical aspects of blood between individuals from the 2 dietary treatments.
Gene expression profiles of dietary-induced hyperlipidemia for whole blood RNA
We used whole blood to evaluate the transition of gene expression profiles. Whole blood RNA is easy to handle compared to isolated white blood cell RNA. In addition, whole blood contains a heterogeneous mixture of subpopulations of blood cells. Associated changes will be reflected on whole blood RNA once a
Figure 2. Correlation matrix of dietary-related gene expression profiles of whole blood and white blood cells.This color-coded
correlation matrix illustrates pairwise correlations between the levels of gene expression in individuals. Probe sets with normalized signals (log-transformed and scaled) were used to calculate correlations between 45 arrays using Pearson correlation coefficient; signals flagged as ‘‘absent’’ were excluded. The color scale at the bottom indicates the strengths of the correlations.
Figure 3. Summary of dietary-related correlation coefficients within the same diet groups.(A) Whole blood after 10 weeks. (B) Whole blood after 19 weeks. (C) Whole blood after 27 weeks. (D) White blood cells after 27 weeks. The bottom and top of the boxes represent the 25th and 75th percentiles respectively. The lower and upper whiskers denote the minimum and maximum values of the data. Using Fisher’s Z-transform for normalization the correlation distribution, continuous variables were analyzed by one-way factorial ANOVA followed by Tukey-Kramer multiple comparisons test for multiple groups. Correlations were considered to be statistically significant when ANOVA test among all groups and t-test between 2 groups should p,0.05. NS; not significant.
doi:10.1371/journal.pone.0037581.g003
Figure 4. Summary of dietary-related correlation coefficients among different diet groups.(A) Whole blood after 10 weeks. (B) Whole
blood after 19 weeks. (C) Whole blood after 27 weeks. (D) White blood cells after 27 weeks. The bottom and top of the boxes represent the 25th and 75th percentiles respectively. The lower and upper whiskers denote the minimum and maximum values of the data. Comparisons of the groups were made with the ANOVA test. NS; not significant.
doi:10.1371/journal.pone.0037581.g004
Hyperlipidemia Gene Expression in Miniature Pigs
great change has occurred in the composition and expressing condition of subpopulations, tissues, or organs. We previously evaluated the ‘‘healthy state’’ gene expression profile by whole blood microarray analyses of miniature pigs of different age groups, and identified characteristics of age-related gene expres-sion by taking into account the change in the number of expressed genes by age and the similarities of gene expression intensity between individuals [21]. The report on the healthy state of miniature pigs found that the correlation coefficients within the same age groups were 0.87 (0.04), 0.93 (0.03), 0.98 (0.01), and 0.96 (0.02), for the fetal stage, and for 12-, 20-, and 30-week-old male pigs, respectively. Variation in gene expression was greatest for younger subjects and diminished with age. These results indicate that uniformity of laboratory animals can be expected in miniature pigs after 20 weeks of age.
In this study, feeding treatments commenced when the pigs were 12 weeks old, RNA analysis was conducted on whole blood sampled after 10, 19, and 27 weeks of the feeding period, and on white blood cell RNA after 27 weeks. Variation in whole blood gene expression intensity among individuals within either the HFCD or the HFCSD group was in the same range as that of the controls at any period, indicating uniformity of dietary-induced hyperlipidemia expression profiles in miniature pigs.
Effects of white blood cells on whole blood gene expression profiles in dietary-induced hyperlipidemia
Most of the nucleated cells in blood are white blood cells such as neutrophils, T cells, B cells, and monocytes. Min et al. reported highly correlated results (r2= 0.85) for 8,273 genes expressed in both whole blood RNA and peripheral blood mononuclear cell (PBMCs) RNA samples from healthy volunteers [20]. Other researchers have conducted a large-scale genome-wide expression analysis of white blood cell subpopulations [22]. That study indicated that correlation coefficients for T cells and monocytes among different healthy subjects were 0.98 (0.01) and 0.97 (0.01), respectively. However, the correlation coefficient between T cells Figure 5. Correlation coefficients between whole blood and
white blood cells within the same diet groups. Correlation
coefficients were calculated between whole blood and white blood cells within the same diet group at 27 weeks feeding period. The bottom and top of the boxes represent the 25th and 75th percentiles respectively. The lower and upper whiskers denote the minimum and maximum values of the data. Comparisons of the groups were made with the ANOVA test. NS; not significant.
Table 14.Top 10 significantly up-regulated genes in HFCSD.
Whole blood at 10 weeks Whole blood at 19 weeks Whole blood at 27 weeks White blood cells at 27 weeks
TIGR or Unigene ID Gene Symbol Fold
Change TIGR or Unigene ID Gene Symbol Fold
Change TIGR or Unigene ID Gene Symbol Fold
Change TIGR or Unigene ID Gene Symbol Fold Change
TC448587 ABCA1 4.0 TC487165 CXCL10 15.7 NP411727 GRK7 17.9 Ssc.9135 20.1
TC438339 4.0 TC440907 8.4 TC490662 ROMO1 16.9 TC434357 11.6
TC440907 3.8 TC509090 5.1 TC417023 15.6 TC511398 8.5
TC411549 3.1 TC448587 ABCA1 5.0 TC480907 13.5 TC473927 7.1
TC472367 2.4 TC450410 4.9 TC444971 13.3 Ssc.24568 6.7
TC433245 2.1 TC438339 4.5 TC511837 12.7 TC448587 ABCA1 5.7
TC470851 4.5 TC423285 12.2 TC438339 4.9
TC480583 4.4 Ssc.46601 11.8 TC440907 4.8
TC410790 IRG6 4.3 Ssc.56049 11.5 TC430783 4.4
Ssc.5472 4.1 Ssc.35808 11.2 TC512775 4.3
doi:10.1371/journal.pone.0037581.t014
Table 15.Top 10 significantly down-regulated genes in HFCD.
Whole blood at 10 weeks Whole blood at 19 weeks Whole blood at 27 weeks White blood cells at 27 weeks
TIGR or Unigene ID
Gene Symbol
Fold Change
TIGR or Unigene ID
Gene Symbol
Fold Change
TIGR or Unigene ID
Gene Symbol
Fold Change
TIGR or Unigene ID
Gene Symbol
Fold Change
TC431538 0.2 TC418697 0.1 TC427825 0.2 TC415077 0.2
TC409256 0.2 TC502826 0.1 TC416132 0.2 TC417273 0.2
TC437880 0.2 TC407798 WNT10B 0.2 TC463385 0.2 Ssc.25428 0.3
Ssc.31818 0.2 TC433727 0.2 Ssc.50105 0.3 Ssc.56656 SQLE 0.3
TC434967 0.3 TC495620 IL18 0.2 Ssc.67286 0.3 TC436654 0.4
TC423396 0.3 TC503806 0.2 TC462549 0.3 TC491413 0.4
TC440884 0.3 TC468870 0.2 TC409660 0.3 TC407223 MYO7A 0.4
TC443308 0.3 TC410474 0.2 TC414897 CNN1 0.3 TC478649 PFKFB1 0.4
Ssc.46725 0.3 TC466297 MGP 0.2 TC423618 0.3 TC473047 0.4
Ssc.38146 0.3 TC449799 0.2 TC494014 0.3 TC446195 0.4
doi:10.1371/journal.pone.0037581.t015
Hyperlipidem
ia
Gene
Expressi
on
in
Miniature
Pigs
PLoS
ONE
|
www.plos
one.org
9
May
2012
|
Volume
7
|
Issue
5
|
and monocytes for the same subjects (n = 5) was 0.88 (0.01), indicating varied correlations between white blood cell subpopu-lations [22]. We believe that no effects of composition ratio of white blood cell subpopulations were observed in our study, because the ratios of granulocytes (neutrophils, eosinophils, and basophils), lymphocytes, and monocytes to white blood cells were statistically insignificant among the three test groups.
In previous studies, tumor-derived RNA was detected in the circulation of cancer patients [23,24]. It has also been demon-strated that fetal RNA can be detected in maternal plasma [25]. These results indicate that whole blood RNA may contain RNA originating from the tissues and/or organs. Hyperlipidemia is one of the risk factors associated with atherosclerosis. Atherosclerosis was induced by the administration of a high-fat and high-diet to Go¨ttingen miniature swine for a 6-month period [5]. The liver and spleen weights were increased significantly compared to the controls in both the HFCD and HFCSC groups in our experiment at the end of each dietary period. Thus white blood cell microarray analyses were conducted at the end of each dietary period, as the tissues and/or organs, such as the liver, spleen, and blood vessels, were presumed to be influenced by dietary treatment.
The average white blood cell correlation coefficients within the HFCD and HFCSD groups were in the same range as that of the controls after the 27-week feeding period. However, variation in whole blood gene expression intensity between the HFCSD group and the control group was statistically significant, whilst variation in white blood cell gene expression intensity between the HFCSD group and the control group was not significant after the 27-week feeding treatments. In addition, the HFCSD correlation coefficient between whole blood and white blood cells after 27 weeks was significantly lower than that of the control and HFCD groups.
The intensity ratio of white blood cell gene expression to that of whole blood shows the contribution of white blood cell RNA to whole blood RNA samples. The intensity ratio of white blood cells to whole blood is, therefore, considered as the contribution indicator. We assume that the low intensity ratio of white blood cell to whole blood gene expression indicates a greater contribu-tion of tissues and/or organs RNA to whole blood RNA. We then compared the EST numbers of the tissue or organ with the contribution indicator, focusing on obesity-related organs such as the liver, adipose tissue, and muscle. The number of gene ESTs for each tissue or organ normalized to blood ESTs becomes greater when the contribution indicator is small. As a result, we suggest that RNAs originating from tissues and/or organs are present in whole blood.
Characteristics of gene expression profiles in dietary-induced hyperlipidemia
It is generally acknowledged that excessive exposure to dietary lipids disrupts the homeostasis of cellular metabolism and triggers an inflammatory response in adipose tissue [26]. An enhanced inflammatory response has been observed in the livers of mice fed on high-fat diets and in skeletal muscles of Otsuka Long-Evans Tokushima Fatty (OLETF) rats using microarrays [27]. We examined dietary-induced transitions of gene expression profiles for genes bearing GO terms. Major changes included an induction of proteins involved in catabolic processes and protein metabolism after a 19-week dietary period, especially in the HFCD group, and a reduced expression of proteins involved in steroid metabolism and lipid biosynthesis after a 27-week dietary period, especially in the HFCSD group.
In whole blood samples, some genes involved in inflammatory responses (GO: 0006954) were down-regulated in the HFCD
Table 17.Functional classes of up- or down-regulated genes between HFCD and control.
Weeks Induction/Repression Category Accession Term % P-value
10 Induction GO MF GO:0003924 GTPase activity 28.6 1.9e202
10 Induction KEGG complement and coagulation cascades 28.6 2.2e202
19 Induction GO MF GO:0032555 purine ribonucleotide binding 13.6 3.9e203
19 Induction GO MF GO:0032553 ribonucleotide binding 13.6 3.9e203
19 Induction GO MF GO:0000166 nucleotide binding 15.3 4.0e203
19 Induction GO MF GO:0003924 GTPase activity 5.1 4.7e203
19 Induction GO MF GO:0017076 purine nucleotide binding 13.6 6.2e203
19 Induction GO BP GO:0019941 modification-dependent protein catabolic process 5.1 1.9e202
19 Induction GO BP GO:0043632 modification-dependent macromolecule catabolic process 5.1 1.9e202
19 Induction GO BP GO:0044257 cellular protein catabolic process 5.1 2.5e202
19 Induction GO BP GO:0051603 proteolysis involved in cellular protein catabolic process 5.1 2.5e202
19 Induction GO MF GO:0032561 guanyl ribonucleotide binding 6.8 2.6e202
19 Induction GO MF GO:0019001 guanyl nucleotide binding 6.8 2.6e202
19 Induction GO MF GO:0005525 GTP binding 6.8 2.6e202
19 Induction GO BP GO:0030163 protein catabolic process 5.1 2.7e202
19 Induction GO BP GO:0044265 cellular macromolecule catabolic process 5.1 3.5e202
19 Induction GO BP GO:0009057 macromolecule catabolic process 5.1 4.9e202
27 Induction KEGG Toll-like receptor signaling pathway 14.3 1.4e202
10 Repression GO MF GO:0004857 enzyme inhibitor activity 11.1 1.6e202
10 Repression GO MF GO:0004866 endopeptidase inhibitor activity 8.3 4.8e202
19 Repression GO BP GO:0002684 positive regulation of immune system process 7.9 1.3e202
27 Repression GO BP GO:0007155 cell adhesion 11.1 9.6e203
27 Repression GO BP GO:0022610 biological adhesion 11.1 9.6e203
27 Repression KEGG steroid biosynthesis 5.6 4.0e202
GO MF; GO molecular function, GO BP; GO biological process, Kegg; Kegg pathway. doi:10.1371/journal.pone.0037581.t017
Table 18.Functional classes of up- or down-regulated genes between HFCSD and control.
Weeks Induction/Repression Category Accession Term % P-Value
19 Induction GO MF GO:0000166 nucleotide binding 13 3.7e204
19 Induction GO MF GO:0032555 purine ribonucleotide binding 9.8 5.1e203
19 Induction GO MF GO:0032553 ribonucleotide binding 9.8 5.1e203
19 Induction GO MF GO:0017076 purine nucleotide binding 9.8 8.2e203
19 Induction GO MF GO:0005524 ATP binding 6.5 4.8e202
27 Repression GO BP GO:0016125 sterol metabolic process 8.5 4.9e204
27 Repression KEGG steroid biosynthesis 6.4 1.7e203
27 Repression GO BP GO:0008202 steroid metabolic process 8.5 2.3e203
27 Repression GO BP GO:0016126 sterol biosynthetic process 6.4 2.4e203
27 Repression KEGG ECM-receptor interaction 8.5 4.0e203
27 Repression GO BP GO:0008203 cholesterol metabolic process 6.4 9.9e203
27 Repression GO BP GO:0006694 steroid biosynthetic process 6.4 1,1e202
27 Repression GO BP GO:0055114 oxidation reduction 12.8 1.5e202
27 Repression GO BP GO:0007155 cell adhesion 8.5 1.7e202
27 Repression GO BP GO:0022610 biological adhesion 8.5 1.7e202
27 Repression GO BP GO:0008610 lipid biosynthetic process 6.4 4.8e202
GO MF; GO molecular function, GO BP; GO biological process, Kegg; Kegg pathway. doi:10.1371/journal.pone.0037581.t018
Hyperlipidemia Gene Expression in Miniature Pigs
group, whilst some genes involved in inflammatory responses were up-regulated and others were down-regulated in the HFCSD group.
It has been established that skeletal muscle is an obesity-related organ, such as the liver and adipose tissue, in association with insulin resistance [26,28,29]. Indeed, 2 out of 4 GO terms (muscle contraction, GO: 0006936, muscle organ development, GO: 0007517) that were statistically significant in the HFCD group were related to muscle function. Genes involved in reproduction (GO: 000003) were induced in the HFCD group, and were either induced or repressed in the HFCSD group. Asexual reproduction is the process by which an organism creates a genetically similar or identical copy of itself without the contribution of genetic material from another individual, and some genes involved in asexual reproduction are linked to the repair of damaged organs. Genes involved in translation (GO: 0006412), positive regulation of growth rate (GO: 0040010), and growth (GO: 004007) were induced in the HFCSD group, and these processes are also linked to organ repair. Meanwhile, GO terms that were statistically significant in the HFCSD group were mainly associated with cellular volatility, such as cellular activity, cell growth, or cellular responses.
We examined correlations between whole blood and white blood cells for genes bearing GO terms. The correlation coefficients for each GO term were calculated for the control, HFCD, and HFCSD groups after the 27-week feeding treatments. As a result, GO terms related to white blood cell function, including inflammatory responses (GO: 0006954), and cell surface receptor-linked signaling pathways (GO: 0007166) show high correlation coefficients in the control and dietary groups. In contrast, GO terms related to the repair of damaged organs, including translation (GO: 0006412), positive regulation of growth rate (GO: 0040010), and growth (GO: 004007), show low correlation coefficients in the HFCSC group.
The differences in the scatter plot regression slopes between the HFCD and control treatments and between the HFCSD and control treatments did not indicate a decrease in the extraction efficiency of RNA due to inhibitory substances in blood. In a previous study of microarray cDNA expression profiles using 23 healthy porcine tissue specimens, a large portion of the genes exhibited tissue-specific expression in agreement with mappings to gene descriptions [30]. In our study, the minimum correlation coefficient for each GO term was 0.737 (0.038), while the maximum was 0.989 (0.004), indicating different values related to functions. The reason for the lower correlation may be due to the differences in gene expression between blood cells and organs, and because a stronger tendency for a decrease in correlation strength was observed in the HFCSD group as compared to the HFCD group. Our EST profile analysis also supported this assumption.
Statistically significant differences in fasting plasma lipids and glucose levels between the HFCD and HFCSD groups were not observed. However, blood RNA analyses demonstrated differences in the characteristics of dietary components between these groups. By considering variation in the dietary-induced hyperlipidemia gene expression profiles of miniature pigs, we have established that whole blood RNA analyses can be used in practical applications. The blood RNA diagnostics under development may eventually be useful for monitoring human health.
Materials and Methods
Animals
Fifteen 12-week-old, male Clawn miniature pigs were housed individually in cages of 1.5 m2at the breeder’s specific
pathogen-Table
19.
Predominant
GO
terms
for
which
the
ratio
changed
in
HFCD
and
HFCSD.
Induction/Repr
essions
Correlation
coefficients
between
whole
blood
and
white
blood
cells
at
27
weeks
Accession
GO
term
Number
of
genes
HFCD
HFCSD
Control
HFCD
HFCSD
GO:0006954
inflammatory
response
155
Repression
Induction/Repression
0
.92
6
0.03
0.97
6
0.02
0.95
6
0.02
GO:0000003
reproduction
3
10
Induction
Induction/Repression
0.91
6
0.02
0.93
6
0.03
0.88
6
0.03
Values
are
mean
6
SD.
doi:10.1371/journal.pone.
free (SPF) facility (Japan Farm Co., Ltd, Kagoshima, Japan) for 27 weeks. Body weights at the beginning of the experiment were 5.1 (2.6) kg (mean (standard deviation; SD)). During this period, 5 pigs were fed with 450 g/day standard dry feed (Kodakara73, Marubeni Nisshin Feed Co., Ltd., Tokyo Japan), and had unlimited access to water (control group). Five pigs were fed a high-fat, high-cholesterol diet containing 15% lard and 2% cholesterol (HFCD group). The 5 remaining pigs were fed a high-fat, high-cholesterol and high-sucrose diet containing 15% lard, 2% cholesterol, and 37% sucrose (HFCSD group). During dissections, the heart, liver, kidney, stomach, and spleen were excised and weighed immediately.
Hematology and clinical chemistries
Blood samples were collected from the superior vena cava after 5, 10, 14, 19, 23, and 27 weeks of the feeding period. Blood (EDTA), plasma (EDTA), and serum samples for hematology and biochemical tests were collected 24 hours after fasting. Hematol-ogy and biochemical tests were conducted by Clinical PatholHematol-ogy Laboratory, Inc. (http://www.patho.co.jp/index.html) (Ka-goshima, Japan) using standard clinical methods.
MIAME compliance and data availability
The microarray experiments described in this manuscript were MIAME compliant and the raw data have been deposited in the Gene Expression Omnibus (GEO) database (Accession number GSE 32616, http://www.ncbi.nlm.nih.gov/geo/query/acc. cgi?acc = GSE32616.
Preparation of samples and microarray assays
Whole blood samples for microarray analyses were collected from each subject in PAXgeneTM tubes (Qiagen/BD GmbH, UK), incubated at room temperature for 4 hours for RNA stabilization, and then stored at280uC. RNA was extracted from whole blood using the PAXgeneTM Blood RNA System Kit (Qiagen GmbH, Germany) according to the manufacturer’s guidelines. RNA from white blood cells was extracted from whole blood samples using a LeukoLOCK Total RNA Isolation kit (Ambion, Austin, TX). Isolations were performed according to the manufacturer’s protocol. The quality of the purified RNA was verified using an AgilentH 2100 Bioanalyzer (Agilent Technolo-gies, Santa Clara, CA). RNA concentrations were determined using a NanoDropH ND-1000 spectrophotometer (NanoDrop Table 20.Predominant GO terms for which the ratio changed in HFCD.
Correlation coefficients between whole blood and white blood cells at 27 weeks
Accession GO term
Number of
genes Induction/Repression Control HFCD HFCSD
GO:0006936 muscle contraction 212 Induction/Repression 0.9160.03 0.9160.02 0.9160.02
GO:0007626 locomotory behavior 207 Induction/Repression 0.8860.04 0.9260.05 0.8660.04
GO:0007517 muscle organ
development
199 Repression 0.9460.05 0.9560.02 0.9460.02
GO:0008152 metabolic process 145 Repression 0.9360.02 0.9260.05 0.9660.03
Values are mean6SD.
doi:10.1371/journal.pone.0037581.t020
Table 21.Predominant GO terms for which the ratio changed in HFCSD.
Correlation coefficients between whole blood and white blood cells at 27 weeks
Accession GO term
Number of
genes Control HFCD HFCSD
GO:0006412 Translation 253 Induction/Repression 0.9060.02 0.9260.03 0.8760.03
GO:0009792 embryonic development ending
in birth or egg hatching
432 Induction/Repression 0.9260.02 0.9360.03 0.9060.02
GO:0006118 electron transport 200 Induction/Repression 0.8260.07 0.7760.09 0.8360.11
GO:0006366 transcription from RNA polymerase II
promoter
209 Induction/Repression 0.9660.02 0.9860.01 0.9760.01
GO:0040010 positive regulation of growth rate 207 Induction 0.9260.02 0.9260.04 0.8660.04
GO:0007166 cell surface receptor linked signaling
pathway
185 Repression 0.9760.01 0.9360.06 0.9760.01
GO:0002119 nematode larval development 374 Induction 0.9160.02 0.9360.03 0.8860.03
GO:0006886 intracellular protein transport 191 Induction 0.9160.06 0.8660.08 0.8660.07
GO:0001666 response to hypoxia 189 Repression 0.9560.02 0.9560.03 0.9260.02
GO:0040007 Growth 332 Induction 0.9160.02 0.9360.03 0.8860.03
Values are mean6SD.
doi:10.1371/journal.pone.0037581.t021
Hyperlipidemia Gene Expression in Miniature Pigs
Technologies, Wilmington, DE). Fluorescent cyanine 3-CTP– labeled cRNA was used for hybridization onto porcine oligo microarray slides (#G2519F#20109, Agilent Technologies) con-taining 43,603 oligonucleotide probes at 65uC for 17 h. The hybridized microarray slides were washed according to the
manufacturer’s instructions and were scanned with an Agilent DNA Microarray Scanner (#G2565BA, Agilent Technologies) at 5-mm resolution. The scanned images were analyzed numerically using Agilent Feature Extraction Software version 9.5.3.1. (Agilent Technologies).
Table 22.Predominant GO terms for which the ratio unchanged in HFCD or HFCSD.
Correlation coefficients between whole blood and white blood cells at 27 weeks
Accession GO term
Number of
genes Control HFCD HFCSD
GO:0007165 signal transduction 527 0.8960.04 0.8960.07 0.8060.05
GO:0008283 cell proliferation 353 0.9160.03 0.8760.07 0.8360.05
GO:0007267 cell-cell signaling 321 0.9460.02 0.9560.03 0.9260.02
GO:0008285 negative regulation of cell proliferation 288 0.9560.03 0.8760.08 0.8360.06
GO:0006468 protein amino acid phosphorylation 266 0.9560.01 0.9460.02 0.9060.03
GO:0008284 positive regulation of cell proliferation 262 0.9260.04 0.9660.02 0.9060.03
GO:0006916 anti-apoptosis 224 0.9160.03 0.9360.03 0.8960.02
GO:0042493 response to drug 218 0.9360.03 0.9360.05 0.8560.04
GO:0007399 nervous system development 210 0.8260.06 0.8260.08 0.7460.04
GO:0006508 Proteolysis 210 0.9060.04 0.9360.03 0.9460.04
GO:0006470 protein amino acid dephosphorylation 198 0.9160.07 0.9060.09 0.8460.06
GO:0000122 negative regulation of transcription from RNA polymerase II
promoter
193 0.9360.03 0.9160.04 0.8960.03
GO:0015031 protein transport 190 0.9560.03 0.9660.02 0.9460.03
GO:0009887 organ morphogenesis 186 0.9360.03 0.9360.05 0.9260.01
GO:0006357 regulation of transcription from RNA polymerase II promoter 179 0.9360.04 0.9460.04 0.8960.03
GO:0001764 neuron migration 174 0.9660.01 0.9560.02 0.9360.01
GO:0007264 small GTPase mediated signal transduction 157 0.9760.01 0.9460.05 0.9960.00
GO:0007275 multicellular organismal development 151 0.9560.03 0.9360.04 0.9160.02
GO:0007420 brain development 150 0.8960.10 0.8960.09 0.8860.09
GO:0043066 negative regulation of apoptosis 145 0.9460.04 0.9560.02 0.9360.01
Values are mean6SD.
doi:10.1371/journal.pone.0037581.t022
Figure 6. Scatter plot of dietary-related correlation coefficients.(A) Control vs. HFCD. (B) Control vs. HFCSD. The correlation coefficient
between whole blood and white blood cells after 27 weeks of each GO tem was plotted for each spot. The solid line represents the regression line. The dashed line represents the slope equal to 1.
Microarray data analysis
Normalized data using quantile normalization were analyzed using GeneSpring GX software version 10.0.1 (Agilent Technol-ogies). The Gene Ontology (GO) Database (http://www. geneontology.org/) was used to categorize gene expression profiles functionally. GO terms were obtained from the TIGR pig gene indices, Porcine version 14.0 3-11-10 (http://compbio.dfci. harvard.edu/cgi-bin/tgi/gimain.pl?gudb = pig). The TC Annota-tor List includes the gene number and the GO terms. Out of the 43,603 probes used in the Agilent porcine microarray (#G2519F#20109), GO annotations were available for 6,019 genes. Microarray cDNA probes were classified according to GO terms for different biological processes.
For the microarray data analyses, we focused particularly on the variation of dietary-related gene expression profiles. Initially, microarray spots of interest were divided into 2 groups: ‘‘absent’’ and ‘‘present,’’ using the flag values provided by the scanner. Background levels were determined from the spots outside of the gene probing area. ‘‘Absent’’ was assigned to spots with a signal intensity that was less than that of the background level, while the rest were marked ‘‘present.’’ Only data for ‘‘present’’ spots were used for the analyses.
The intensity ratio of white blood cell gene expression to that of whole blood is a contribution indicator for white blood cell RNA
to whole blood RNA. The relation of tissues or organs ESTs to the white blood cell contribution indicator was examined. To focus on obesity-related organs, i.e., the liver, adipose tissue, and muscle, the relative EST numbers of these organs to blood ESTs for each gene were calculated using EST profiles from the Unigene NCBI database of the transcriptome. An EST profile breakdown of 22,000 porcine genes by body site is available, comprising 40 organ types, such as the lung, ovary, liver, adipose tissue, muscle, and blood. The profiles show gene expression patterns inferred from EST counts and cDNA library sources (http://www.ncbi. nlm.nih.gov/UniGene/).
Statistical analysis
Continuous variables were analyzed using a 1-way factorial ANOVA followed by a Tukey-Kramer multiple comparisons test for multiple groups. After excluding the unexpressed genes from each set of array data, Pearson correlation coefficients were calculated to identify similarities in gene expression among individuals. Pearson correlation coefficients were analyzed by a 1-way factorial ANOVA using Fisher’s Z-transform to normalize the correlation distribution.
Correlations were considered statistically significant for AN-OVA tests among all groups andt-tests between 2 groups when
p,0.05. All values were expressed as non-transformed mean (standard deviation (SD)). Genes with a fold change greater than 2.0 (p,0.05) and less than 0.5 (p,0.05) after 10, 19, and 27 weeks were identified. These genes were mapped to the Gene Ontology and KEGG pathway in the Database for Annotation, Visualiza-tion and Integrated Discovery (DAVID Bioinformatics Resources 6.7, National Institute of Allergy and Infectious Diseases, http:// david.abcc.ncifcrf.gov/) [31,32]. Chi-square tests were performed for feature extractions of GO terms. The expected values were the number of up- and down-regulated genes bearing all GO annotations, and the observed values were specific to each GO term. Simple linear regressions were performed for the scatter plots to obtain the slopes and intercepts, and the significance of each regression slope was verified.
Ethical considerations
All experimental protocols were approved by the Committee for the Care and Use of Experimental Animals at AIST (Permit Number: 2009-055A).
Author Contributions
Conceived and designed the experiments: J. Takahashi HI. Performed the experiments: J. Takahashi SW RM JO TM TI. Analyzed the data: J. Takahashi HI. Contributed reagents/materials/analysis tools: J. Takahashi J. Tottori HI. Wrote the paper: J. Takahashi.
References
1. Lissner L, Heitmann BL (1995) Dietary fat and obesity: evidence from epidemiology. Eur J Clin Nutr 49(2): 79–90.
2. Radonjic M, de Haan JR, van Erk MJ, van Dijk KW, van den Berg SAA, et al. (2009) Genome-wide mRNA expression analysis of hepatic adaptation to high-fat diets reveals switch from an inflammatory to steatotic transcriptional program. PLoS ONE 4(8): e6646.
3. Russell JC, Proctor SD (2006) Small animal models of cardiovascular disease: tools for the study of the roles of metabolic syndrome, dyslipidemia, and atherosclerosis. Cardiovasc Pathol 15(6): 318–330.
4. Oron-Herman M, Kamari Y, Grossman E, Yeger G, Peleg E, et al. (2008) Metabolic syndrome: comparison of the two commonly used animal models. Am J Hypertens 21(9): 1018–1022.
5. Kobari Y, Koto M, Tanigawa M (1991) Regression of diet-induced atherosclerosis in Gu¨ttingen Miniature Swine. Lab Anim 25(2): 110–116. 6. De Keyzer D, Karabina SA, Wei W, Geeraert B, Stengel D, et al. (2009)
Increased PAFAH and oxidized lipids are associated with inflammation and
atherosclerosis in hypercholesterolemic pigs. Arterioscler Thromb Vasc Biol 29(12): 2041–2046.
7. Orbe J, Rodriguez JA, Calvo A, Grau A, Belzunce MS, et al. (2001) Vitamins C and E attenuate plasminogen activator inhibitor-1 (PAI-1) expression in a hypercholesterolemic porcine model of angioplasty. Cardiovasc Res 49(2): 484–492.
8. de Smet BJ, Kuntz RE, van der Helm YJ, Pasterkamp G, Borst C, et al. (1997) Relationship between plaque mass and neointimal hyperplasia after stent placement in Yucatan micropigs. Radiology 203(2): 484–488.
9. Bowles DK, Heaps CL, Turk JR, Maddali KK, Price EM (2004) Hypercho-lesterolemia inhibits L-type calcium current in coronary macro-, not microcirculation. J Appl Physiol 96(6): 2240–2248.
10. Yin W, Liao D, Kusunoki M, Xi S, Tsutsumi K, et al. (2004) NO-1886 decreases ectopic lipid deposition and protects cells in diet-induced diabetic swine pancreatic. J Endocrinol 180(3): 399–408.
Figure 7. The relation of tissue or organ ESTs to the white
blood cell contribution indicator. The X-axis indicates the
expression intensity ratio of white blood cells to whole blood for each gene as the white blood cell contribution indicator in our experiments. The Y-axis indicates the liver, adipose tissue, or muscle EST numbers normalized to the blood EST number of each gene in Unigene, an NCBI database of the transcriptome.
doi:10.1371/journal.pone.0037581.g007
Hyperlipidemia Gene Expression in Miniature Pigs
11. Zhang C, Yin W, Liao D, Huang L, Tang C, et al. (2006) NO-1886 upregulates ATP binding cassette transporter A1 and inhibits diet-induced atherosclerosis in Chinese Bama minipigs. J Lipid Res 47(9): 2055–2063.
12. Lunney JK (2000) Advances in swine biomedical model genomics. Int J Biol Sci 3(3): 179–184.
13. Simon GA, Maibach HI (2000) The pig as an experimental animal model of percutaneous permeation in man: qualitative and quantitative observations – an overview. Skin Pharmacol Appl Skin Physiol 13(5): 229–234.
14. Vodicka P, Smetana K, Jr., Dvora´nkova´ B, Emerick T, Xu YZ, et al. (2005) The miniature pig as an animal model in biomedical research. Ann N Y Acad Sci 1049: 161–171.
15. Schook LB, Beever JE, Rogers J, Humphray S, Archibald A, et al. (2005) Swine Genome Sequencing Consortium (SGSC): a strategic roadmap for sequencing the pig genome. Comp Funct Genomics 6(4): 251–255.
16. Archibald AL, Bolund L, Churcher C, Fredholm M, Groenen MA, et al. (2010) Pig genome sequence–analysis and publication strategy. BMC Genomics 11: 438.
17. Williams-Devane CR, Wolf MA, Richard AM (2009) Toward a public toxicogenomics capability for supporting predictive toxicology: survey of current resources and chemical indexing of experiments in GEO and ArrayExpress. Toxicol Sci 109(2): 358–371.
18. Pennie W, Pettit SD, Lord PG (2004) Toxicogenomics in risk assessment: an overview of an HESI collaborative research program. Environ Health Perspect 112(4): 417–419.
19. Tong W, Cao X, Harris S, Sun H, Fang H, et al. (2003) ArrayTrack–supporting toxicogenomic research at the U.S. Food and Drug Administration National Center for Toxicological Research. Environ Health Perspect 111(15): 1819–1826.
20. Min JL, Barrett A, Watts T, Pettersson FH, Lockstone HE, et al. (2010) Variability of gene expression profiles in human blood and lymphoblastoid cell lines. BMC Genomics 11: 96.
21. Takahashi J, Misawa M, Iwahashi I (2011) Oligonucleotide microarray analysis of age-related gene expression profiles in miniature pigs. PLoS ONE 6(5): e19761.
22. Cobb JP, Mindrinos MN, Miller-Graziano C, Calvano SE, Baker HV, et al. (2005) Application of genome-wide expression analysis to human health and disease. Proc Natl Acad Sci USA 102(13): 4801–4806.
23. Kopreski MS, Benko FA, Kwak LW, Gocke CD (1999) Detection of tumor messenger RNA in the serum of patients with malignant melanoma. Clin Cancer Res 5: 1961–1965.
24. Lo KW, Lo YMD, Leung SF, Tsang YS, Chan LY, et al. (1999) Analysis of cell-free Epstein-Barr virus associated RNA in the plasma of patients with nasopharyngeal carcinoma. Clin Chem 45: 1292–1294.
25. Poon LL, Leung TN, Lau TK, Lo YM (2000) Presence of fetal RNA in maternal plasma. Clin Chem 46(11): 1832–1834.
26. Hotamisligil GS (2006) Inflammation and metabolic disorders. Nature 444(7121): 860–867.
27. Hayashi Y, Kajimoto K, Iida S, Sato Y, Mizufune S, et al. (2010) DNA microarray analysis of whole blood cells and insulin-sensitive tissues reveals the usefulness of blood RNA profiling as a source of markers for predicting type 2 diabetes. Biol Pharm Bull 33(6): 1033–1042.
28. Roberts CK, Barnard RJ, Liang KH, Vaziri ND (2002) Effect of diet on adipose tissue and skeletal muscle VLDL receptor and LPL: implications for obesity and hyperlipidemia. Atherosclerosis 161(1): 133–41.
29. Krotkiewski M (1994) Role of muscle morphology in the development of insulin resistance and metabolic syndrome. Presse Med 23(30): 1393–1399. 30. Hornshøj H, Conley LN, Hedegaard J, Sørensen P, Panitz F, et al. (2007)
Microarray expression profiles of 20.000 genes across 23 healthy porcine tissues. PLoS One 2(11): e1203.
31. Huang da W, Sherman BT, Lempicki RA (2009) Bioinformatics enrichment tools: paths toward the comprehensive functional analysis of large gene lists. Nucleic Acids Res 2009;37(1): 1–13. Epub 2008 Nov 25.