Vol-7, Special Issue-Number4-June, 2016, pp437-445 http://www.bipublication.com
Research Article
Construction and standardization of administrative corruption perception
questionnaire and its relationship with social trust
+
Majid Saffarinia and *Zahra Kheiraldin
+Associate Professor, Tehran,
Payam-e-Noor University, Tehran, Iran [email protected]
*Student of psychology, Faculty o psychology, Payam-e- Noor University, Tehran, Iran
ABSTRACT
This study aimed to design and normalize corruption perception questionnaire and its relation with social trust among the people in Tehran city in 2015. In this study 600 people were selected clusteringly and to collect questionnaire data, 28 questions have been set by the researcher based on Theory and definitions of corruption. To determine the factors and validity of the questionnaire, exploratory factor analysis and to determine the reliability of the questionnaire, the Test – Retest method were used. The results show that questionnaire Cronbach's alpha coefficient which indicates its reliability and internal consistency, is desirable (0/86). Questionnaire validity which is obtained through factor analysis in the area of construct validity, is also acceptable. KMO measure of sampling adequacy is (0/86). Chi-square coefficient of Bartlett's test is equal to 0. 0001, which indicates the external validity of the questionnaire. In addition, through exploratory factor analysis using varimax, eventually a questionnaire including 27 questions with 4 components (rente & nepotism, cash for access, embezzlement & fraud and corruption in procurement and contract) was obtained. Finally, the relation between corruption perception and social trust was confirmed through 120 questionnaires that were obtained from sample society and Pearson correlation and stepwise regression analysis methods.
INTRODUCTION
Issue of social health has been regarded as one of the most important dimensions of health and one of the most important factors of growth and development to which a special attention has been paid by the psychologists, sociologists and researchers. Issue of administrative health has been regarded as one of the major discussions in social health. Inattention to administrative health or corruption has been regarded as one of the most important threats to social health (Svensson, 2005). Lack of administrative health or corruption has been regarded as one of the most important threats to economic stability, development and economic progress at society. The crimes including embezzlement, bribery and forgery are called to the crimes which can play a major role in
and not belonged to specific time or society has enabled to affect social health of society (Lee, 2013). A group of researchers believe that it should define administrative corruption regarding people’s public views, thus a provision which is immoral and hazardous from point of view of people in the society will appear as corruption (Mark Robinson, 2012). As known, measurement of concepts on psychology faces numerous difficulties, this difficulty goes beyond in measuring corruption, because corruption refers to a phenomenon which takes place in secret and the actors involved in corruptive transactions put all their efforts so as not to leave behind no evidence, thus direct measurement of corruption seems difficult and impossible, whereby the researchers use indirect measurement methods to measure corruption. As said by Kaufman, this stereotype assumption which says that corruption cannot be measured is just a myth(Kaufman et al. 2005). Therefore, community with corruption enjoys high rates of poverty, low social mobility and inefficient institutions and citizens in such community enjoy low freedom and right and enjoy lower quality of life than the citizens who live in countries with low level of corruption
(Rothstein, 2011). Further, individuals’
understanding from instability of political, social, economic structure, increase of corruption, lack of security and so forth constantly influences people’s body, mind and personality, deduced that socioeconomic developments of society in terms of status of social health are not at favorable conditions currently. The problems such as poverty, unemployment, addiction, loss of happiness, lower literacy rate and increase of the dropouts, nepotism, administrative corruption, court cases, external threats and such problems go beyond. The person with corruption has been witnessed with more behaviors in contrary to citizenship behaviors, so that if these stressful conditions have become stronger, we will witness
reduced individuals’ satisfaction, increased
helplessness and frustration and increased reconstructive surgery, deduced that detection of
these stressful factors seems essential(Saffari nia, 2014). Indeed, measurement of extent of corruption is made through three ways: 1-survey of viewpoints of officials, citizens, experts and private sector, 2-micro methods which examine corruption throughout the organization regarding their institutional features, 3-precise auditing of projects(Fazeli, 2009). Survey of understanding from corruption which is based on pooling people and various groups and measuring their views on extent of common corruption in institutions or the entire society has been regarded as one of the most common forms of corruption measurement at wide range. Understanding from corruption is measured through measuring understanding from corruption by people, which this has been recognized a common method in measuring corruption (Yazdan Panah, 2013). The present research intends to formulate and standardize Corruption Perception questionnaire by detecting, extracting and organizing the content and components. To achieve goals, the present research intends to give response to this question whether the made administrative corruption
perception questionnaire enjoys acceptable
validity and reliability or not. Whether
administrative corruption perception associates to social trust or not.
Literature review
citizen trust and unethical behavior. The findings emphasize addressing the ethical modeling and re shaping of the behavior of public sector specifically in Pakistan, hence, it opens the way for future studies on the reflection of ethics and culture on good governance and citizen trust. Kumar et al.(2014) conducted a study entitled “Perception about Corruption in Public Services: A Case of Brics Countries" and examined the perception of general public about the corruption in BRICS countries.
It was found that state authorities initiate corruption. The main causes behind corruption are Public tolerance towards corruption, Absence of political will, Dominance of personal interest over
state interest, Ineffective administration,
Inefficient control and punishment mechanisms and Lack of independence of the judiciary system. It was observed that Police is the most corrupt service in BRICS countries. Majority of people from Russia, China and South Africa believe that their Government is effective in fighting with corruption while people of Brazil and India don’t have faith in their Government regarding fighting with corruption. Media was found to be most trusted institution in fighting with corruption. The Judiciary should formulate strict law regarding corruption.
Lee, W.S. (2013) conducted a study entitled “Engaging in corruption: The influence of cultural values and contagion effects at the micro level” and concluded that Previous empirical work on corruption has generally been cross-country in nature and focused on utilizing country-level corruption ratings. By using micro-level data for over 20 European countries that directly measure individual characteristics, corruption experiences, gender roles, trust and values to examine the determinants of corruption, this paper went beyond the search for associations between various macro factors and perceptions of corruption that is prevalent in the economic literature. One focus of the paper is on how cultural norms such as gender roles and risk preferences influence corruption and whether
there are gender differences in the determinants of corruption. In addition, this paper also sought to determine if there are contagion effects in corruption at the microlevel. Using a seemingly unrelated probit approach, this paper provides empirical estimates of how past experiences with corruption affects both how bribery is viewed and the actual act of offering a bribe.
Rothstein, Bo. 2011 in a study entitled “The Quality of Government: Corruption, Social Trust, and Inequality in International Perspective” said that The relationship between government, virtue, and wealth has held a special fascination since Aristotle, and the importance of each frames policy debates today in both developed and developing countries. While it’s clear that low-quality government institutions have tremendous negative effects on the health and wealth of societies, the criteria for good governance remain far from clear. Focusing on the effects of government policies, he argued that unpredictable actions constitute a severe impediment to economic growth and development—and that a basic characteristic of quality government is impartiality in the exercise of power.
Kaufmann et al.(2005) conducted a study entitled "Measuring governance using cross-country CCC perceptions data” and described an ongoing project to measure governance using cross country perceptions data. The governance indicators measure six dimensions of governance and cover 209 countries and territories for 1996-2004. They are based on several hundred individual variables measuring perceptions of governance, drawn from 37 separate data sources constructed by 31 different organizations.
They found that in a number of countries the quality of governance improved significantly in the short term. Yet deteriorations also took place in some other countries, while in many there was little change. There has been no worldwide improvement in governance on average. They argued that perceptions-based data provide valuable insights relative to objective data on
measures of governance provide an incomplete picture of even the quite particular dimensions of governance that they are intended to measure. They also showed that margins of error are not unique to perceptions based measures of governance, but are an important feature of all efforts to measure governance, including objective indicators.
They also empirically investigated the importance of ideological biases in expert assessments of corruption and find little evidence that they are present. Governance indicators and per capita incomes are highly correlated across countries. Recent research showed that this correlation captures an important causal effect running from measures of governance such as these to per capita incomes.
Research plan
Since the present research seeks to examine concept and components of administrative corruption perception and make an instrument to measure it regarding Iranian culture, it is considered as a descriptive survey. Descriptive research includes a series of methods which aim to define the conditions and phenomena under study (Delavar, 2009).
Statistical population and sampling method Statistical population consists of a group of individuals or units which have a common point (Hafeznia, 2010).
Statistical population consists of all the men and women across Tehran. Multistage clustering has been considered as the research sampling method, so that 5 districts (1, 5, 8, 11, 16) have been selected among 22 districts of Tehran and the sample has been selected among the clients who referred to municipal and justice departments and hospitals in these areas.
Sample size
The sample group consists of 600 men and women across Tehran. The sample size has been selected based on related works because it has been mentioned that suitable sample size for validation and normalization of scales equals to 500-1000 persons (Dehkordi & Najarian, 2004).
Confirmatory factor analysis
Confirmatory factor analysis was made on dimensions of this questionnaire(administrative corruption perception)
In following, the figures associated to these analyses and results from factor analysis are proposed. It should be noted that the relationship between errors in figures has increased the model fitting. These relationships have been represented in software AMOS 22 based on the modifications. The first dimension
Figure 1-the first dimension of confirmatory factor
analysis
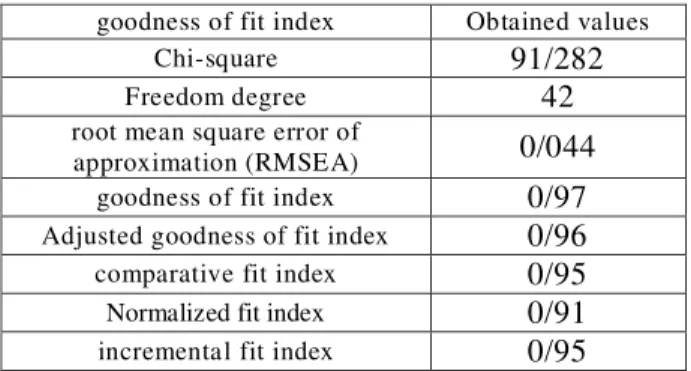
Table 1. The first dimension of goodness of fit index
goodness of fit index Obtained values
Chi-square 91/282
Freedom degree 42
root mean square error of
approximation (RMSEA) 0/044
goodness of fit index 0/97
Adjusted goodness of fit index 0/96
comparative fit index 0/95
Normalized fit index 0/91
incremental fit index 0/95
questions 18 and 19, deduced that chi-square value reduced from 126.739 to 91.282. Among fit indices, if ratio of chi-square to freedom degree falls under 5, the model enjoys a suitable fit, which this index for the first dimension equals to
2.173. Root mean square error of
approximation (RMSEA) is under 0.07 which is equals to 0.044. The more other indices approach to 1, it is more desirable that the values in tables 1 indicate suitable model fit.
The second dimension
Figure 2-the second dimension of confirmatory factor
analysis
Table 2. The second dimension of goodness of fit
index
goodness of fit index Obtained values
Chi-square 26/287
Freedom degree 11
root mean square error of
approximation (RMSEA) 0/048
goodness of fit index 0/98
Adjusted goodness of fit
index 0/96
comparative fit index 0/98
Normalized fit index 0/97
incremental fit index 0/98
As shown in figure 2, there is a relationship between errors at questions 17 and 18, questions 16 and 17 and questions 14 and 15, deduced that chi-square value reduced from 106.963 to 26.287 and model enjoys a suitable fit. Further ratio of chi-square to freedom degree equals to 2.390 for the second dimension.
The third dimension
Figure 3-the third dimension of confirmatory factor
analysis
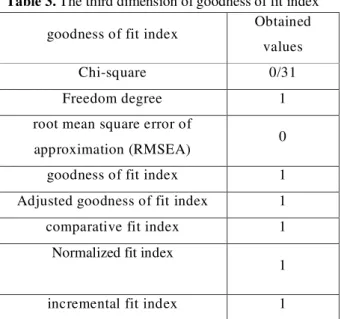
Table 3. The third dimension of goodness of fit index
goodness of fit index Obtained values
Chi-square 0/31
Freedom degree 1
root mean square error of
approximation (RMSEA) 0
goodness of fit index 1
Adjusted goodness of fit index 1
comparative fit index 1
Normalized fit index
1
incremental fit index 1
The fourth dimension
Figure 4-the fourth dimension of confirmatory factor
analysis
Table 4. The fourth dimension of goodness of fit index
goodness of fit index Obtained values
Chi-square 10/611
Freedom degree 4
root mean square error of
approximation (RMSEA) 0/05
goodness of fit index 0/99
Adjusted goodness of fit index 0/97
comparative fit index 0/97
Normalized fit index 0/95
incremental fit index 97
As shown in figure 4, there is a relationship between errors at questions 25 and 26, deduced that chi-square value reduced from 33.845 to 100.611. Further ratio of chi-square to freedom degree equals to 2.653 for the fourth dimension indicating suitable model fit.
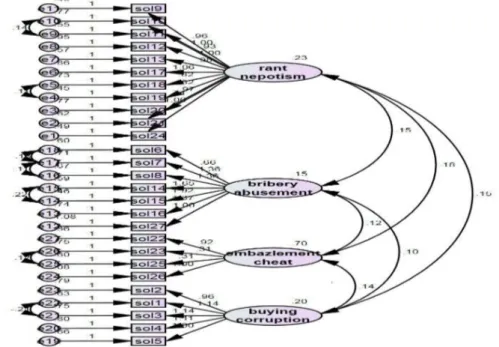
Model
Figure 5- confirmatory factor analysis of the entire administrative corruption perception questionnaire
Table 5. Goodness of fit index of the entire administrative corruption perception questionnaire
goodness of fit index Obtained values
Chi-square 767/649
Freedom degree 311
root mean square error of approximation
(RMSEA) 0/05
goodness of fit index 0/91
Adjusted goodness of fit index 0/90
comparative fit index 0/92
Normalized fit index 0/90
The indices in table indicate that the four-dimensional model of administrative corruption perception questionnaire enjoys suitable fit in Iran community.
Findings related to normalization
To calculation Iranian norms, mean, median and standard deviation were used that the summary of results has been proposed in table 6. Further the tables associated to norms have been used and the standardized scores and t scores have been proposed for each factor.
Table 6. Descriptive indices of the scores of administrative corruption perception factors among participants
(N=600)
Factors Mean Standard
deviation Median
Rent and Nepotism 43/79 5/71 44/00
Bribery 26/73 4/32 27/00
Embezzlement and
fraud 16/61 2/53 17/00
Corruption in procurement and
contracts
44 /
18 2/97 19/00
As shown in table 6, scores of mean, standard deviation and median equal to 43.79, 5.71 and 44 in rent and Nepotism, equal to 26.73, 4.32 and 27 in bribery and equal to 16.61, 2.53 and 17 in embezzlement and fraud and equal to 18.44, 2.97 and 19 in Corruption in procurement and contracts. In following, the table related to (P10-P90) of raw scores and a variety of standard scores can be witnessed.
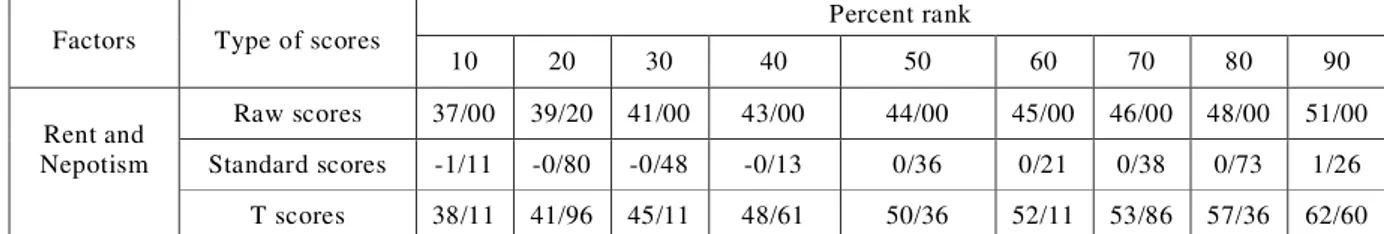
Table 7. percept rank(P10-P90) of raw, standardized and t scores of administrative corruption perception factors
Further, the grading range of each of factors can be examined using normal curve and scores of mean and standard deviation of each of administrative corruption perception factors, reported in table 8.
Normal curve figure
Table 8. Values of standard scores in administrative corruption perception
Factors Very strong Strong Average Poor Very poor
Rent and Nepotism 55 -61 50 -55 38 -49 32 -37 26 -31
Bribery 36 -40 32 -35 22 -31 18 -21 14 -17
Embezzlement and fraud 23 -25 20 -22 14 -19 11 -13 8 -10
Corruption in procurement
and contracts 26 -28 23 -25 16 -22 13 -15 10 -12
Factors Type of scores
Percent rank
10 20 30 40 50 60 70 80 90
Rent and Nepotism
Raw scores 37/00 39/20 41/00 43/00 44/00 45/00 46/00 48/00 51/00
Standard scores -1/11 -0/80 -0/48 -0/13 0/36 0/21 0/38 0/73 1/26
As mentioned in table 8, each of components of administrative corruption perception at five-point Likret scale ranked from very strong to very poor have turned to standard scores. In rent and Nepotism factor, the least and highest scores have been reported equal to 26 and 61, respectively. The least and highest score in bribery equaled to 14 and 40, respectively. In embezzlement and fraud, the least and highest scores equaled to 8 and 25; in corruption in procurement and contracts, the least and highest scores equaled to 10 and 28.
Findings related to the relationship between administrative corruption perception and social trust
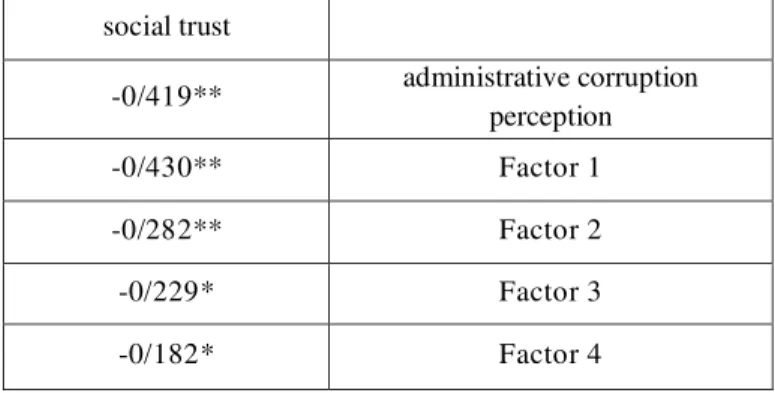
Table 9. The correlation between administrative corruption perception and its components with social trust
social trust
** 419 / 0
- administrative corruption perception
** 430 / 0
- Factor 1
** 282 / 0
- Factor 2
* 229 / 0
- Factor 3
* 182 / 0
- Factor 4
05 / 0 *P
In the present research, the correlation between administrative corruption perception and social trust at sample group was calculated with sample size (120). The results indicated that this coefficient equals to -0.419, indicating a significant correlation between administrative corruption perception and social trust at 0.0001 represented with a negative and significant correlation between these two questionnaires. The results of correlation between administrative corruption perception and its components with social trust have been proposed in table 10. Values of table indicate a negative and significant correlation between social trust and administrative corruption perception.
Table 10. Forecast of social trust from administrative corruption perception
SS Df MS F P
administrative corruption perception
Regression 1765/111 1 1765/111
106 /
25 (0/0001)
Residue 8296/189 118 70/307
The results from stepwise regression analysis to forecast social trust from administrative corruption perception have been represented in table 10. Sig of (f) indicates the relationship between administrative corruption perception and social trust.
Table 11. The results related to determination coefficient and regression coefficients
t
(P) Beta B SE R2 R
011 / 5
-) 0001 / 0
( -0/419 -0/303 6/241 0/175 0/419
administrative corruption perception
As shown in table 11, administrative corruption perception has 0.175% of variance of changes in social trust. Determination coefficient and ratios of regression analysis of social trust on administrative corruption perception have been displayed in table.
Conclusion
The present research has been conducted aiming
at standardizing administrative corruption
perception questionnaire and its relationship with social trust and making a suitable instrument to measure administrative corruption perception, for which the validity and reliability of research-made questionnaire were determined. In this research, an attempt has been made to examine the research questions under standardization of this scale using
the results from analysis of data from
administrative corruption perception
performed on 600 people across Tehran via clustering sampling at districts 1, 8, 11, 5, 16 and data were analyzed via software SPSS22. To give response to the research questions, chronbach alpha, factor analysis and z normative score were used.
REFERENCES
1. Yazdanpanah, L. (2013). Investigate the
relationship between administrative corruption outlook and religiosity. Youth Social Studies Quarterly, Issue I
2. Saffarinia, M. (2012). Social Audit of Health Psychology in Iran , a research vice president for Science and Technology
3. Saffarinia, M. (2014) Introduction to the
psychology of the city (printing). Tehran: TISA.
4. Bracking, Sarah. (2011). “Corruption and
Development: how ‘donors’ get it Wrong.”
5. Kumar Sahul, Surendra , Dr. Gahlot, Ruchika.
2014." Perception about Corruption in Public Servicies: A Case of Brics Countries" Social Science for Policy Implications Journal.
6. Kaufmann, D, Arat, K, Massiomo M. (2005).
"Measuring governance using cross-country CCC perceptions data", The World Bank
7. Lee, W.S. (2013). “Engaging in corruption:
The influence of cultural values and contagion effects at the micro level”. Journal of Economic Psychology, 39, 287-300.
8. Rothstein, Bo. 2011. The Quality of
Government: Corruption, Social Trust, and
Inequality in International Perspective.
Chicago, IL: University of Chicago Press.
9. Robinson, Mark, ed. Corruption and
Development. New York, NY: Routledge.
10.Svensson, Jakob. 2005. ‘Eight Questions about
Corruption.’ The Journal of Economic
Perspectives 19(3): 19–42.
11.Yousaf, Momna ,& Ihsan , Freeha .2015.
"Exploring the impact of good governance on citizens' trust in Pakistan"