Submitted7 February 2014 Accepted 22 April 2014 Published6 May 2014
Corresponding author
Nathan P. Lemoine, [email protected]
Academic editor
Michael Singer
Additional Information and Declarations can be found on page 15
DOI10.7717/peerj.376
Copyright
2014 Lemoine et al.
Distributed under
Creative Commons Public Domain Dedication
OPEN ACCESS
Variable e
ff
ects of temperature on
insect herbivory
Nathan P. Lemoine1, Deron E. Burkepile1and John D. Parker2
1Department of Biological Sciences, Florida International University, Miami, FL, United States 2Smithsonian Environmental Research Center, Smithsonian Institution, Edgewater, MD,
United States
ABSTRACT
Rising temperatures can influence the top-down control of plant biomass by increas-ing herbivore metabolic demands. Unfortunately, we know relatively little about the effects of temperature on herbivory rates for most insect herbivores in a given community. Evolutionary history, adaptation to local environments, and dietary factors may lead to variable thermal response curves across different species. Here we characterized the effect of temperature on herbivory rates for 21 herbivore-plant pairs, encompassing 14 herbivore and 12 plant species. We show that overall con-sumption rates increase with temperature between 20 and 30◦C but do not increase further with increasing temperature. However, there is substantial variation in ther-mal responses among individual herbivore-plant pairs at the highest temperatures. Over one third of the herbivore-plant pairs showed declining consumption rates at high temperatures, while an approximately equal number showed increasing con-sumption rates. Such variation existed even within herbivore species, as some species exhibited idiosyncratic thermal response curves on different host plants. Thus, rising temperatures, particularly with respect to climate change, may have highly variable effects on plant-herbivore interactions and, ultimately, top-down control of plant biomass.
Subjects Ecology, Entomology
Keywords Climate change, Hierarchical model, Thermal response curve, Lepidoptera, Coleoptera, Hymenoptera
INTRODUCTION
2009). To date, however, few (if any) studies have examined variation in thermal response curves for a community of co-occurring herbivores (Buckley, Nufio & Kingsolver, 2014).
Insect herbivores can be an important top-down force in terrestrial ecosystems, controlling plant biomass (Carson & Root, 2000), maintaining species diversity (Bagchi et al., 2014), reorganizing competitive hierarchies (Kim, Underwood & Inouye, 2013), and enhancing nutrient cycling (Metcalf et al., 2014). Because insects are ectothermic, their physiological rates, including consumption and growth rates, are directly tied to environmental temperature. By extension, top-down control of plant biomass is also likely to be temperature dependent. Theoretical and experimental studies suggest that herbivory rates should increase exponentially with rising temperatures (O’Connor, Gilbert & Brown, 2011). One potential shortcoming of theoretical examinations of temperature-driven herbivore-plant interactions is that they do not often incorporate variation in thermal response curves within an assemblage of herbivore species. In part, this is because thermal response curves for multiple herbivore species on a single host plant remain mostly uncharacterized. Species are often examined singly, and ecologists have focused on a few readily available model species likeSpodopteraspp. (Stamp & Yang, 1996) andManduca sexta(Kingsolver & Woods, 1998). In contrast, the herbivore guild within a community, or even on a single host plant, can vary from 1–100s of species, each with different life histories, climatic niches, evolutionary histories, and dietary needs that may drive vastly different thermal response curves (Buckley, Nufio & Kingsolver, 2014).
Multiple factors aside from evolutionary history and local adaptation can determine the shape of a species’ thermal response curve. For example, plant chemical defenses can become more or less effective at high temperatures depending on the identity of the herbivore, plant, and chemical compounds in question (Stamp & Osier, 1998;Stamp, Yang & Osier, 1997). Similarly, different insect species can become more or less nutrient-limited at higher temperatures, which is also contingent on host plant quality (Kingsolver et al., 2006;Kingsolver & Woods, 1998;Lemoine et al., 2013). Thermal response curves therefore likely differ among herbivore species and within a single herbivore species utilizing different hosts. Given the interest in predicting the effects of climate change on trophic interactions and community structure (Singer, Travis & Johst, 2013;Urban, Tewksbury &
Sheldon, 2012), we sought to determine whether temperature influences herbivory in a
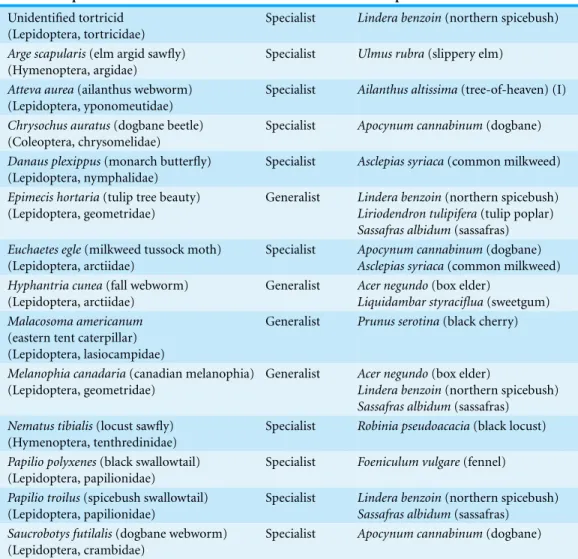
Table 1 Herbivores and plants used in this study.Herbivore—plant pairings used in feeding assays. Species marked with (I) are introduced species; common names are given in parentheses. Below each species name, we have listed the order and family of each species.
Herbivore species Herbivore diet Plant species
Unidentified tortricid (Lepidoptera, tortricidae)
Specialist Lindera benzoin(northern spicebush)
Arge scapularis(elm argid sawfly)
(Hymenoptera, argidae)
Specialist Ulmus rubra(slippery elm)
Atteva aurea(ailanthus webworm)
(Lepidoptera, yponomeutidae)
Specialist Ailanthus altissima(tree-of-heaven) (I)
Chrysochus auratus(dogbane beetle)
(Coleoptera, chrysomelidae)
Specialist Apocynum cannabinum(dogbane)
Danaus plexippus(monarch butterfly)
(Lepidoptera, nymphalidae)
Specialist Asclepias syriaca(common milkweed)
Epimecis hortaria(tulip tree beauty)
(Lepidoptera, geometridae)
Generalist Lindera benzoin(northern spicebush)
Liriodendron tulipifera(tulip poplar)
Sassafras albidum(sassafras)
Euchaetes egle(milkweed tussock moth)
(Lepidoptera, arctiidae)
Specialist Apocynum cannabinum(dogbane)
Asclepias syriaca(common milkweed)
Hyphantria cunea(fall webworm)
(Lepidoptera, arctiidae)
Generalist Acer negundo(box elder)
Liquidambar styraciflua(sweetgum)
Malacosoma americanum (eastern tent caterpillar) (Lepidoptera, lasiocampidae)
Generalist Prunus serotina(black cherry)
Melanophia canadaria(canadian melanophia)
(Lepidoptera, geometridae)
Generalist Acer negundo(box elder)
Lindera benzoin(northern spicebush)
Sassafras albidum(sassafras)
Nematus tibialis(locust sawfly)
(Hymenoptera, tenthredinidae)
Specialist Robinia pseudoacacia(black locust)
Papilio polyxenes(black swallowtail)
(Lepidoptera, papilionidae)
Specialist Foeniculum vulgare(fennel)
Papilio troilus(spicebush swallowtail)
(Lepidoptera, papilionidae)
Specialist Lindera benzoin(northern spicebush)
Sassafras albidum(sassafras)
Saucrobotys futilalis(dogbane webworm)
(Lepidoptera, crambidae)
Specialist Apocynum cannabinum(dogbane)
METHODS
Figure 1 Chrysochus auratus.Chrysochus auratus, the dogbane beetle, feeding onApocynum cannabinum.
(e.g., Hyphantria cuneata) have higher replicate numbers than do rare, non-gregarious species (e.g.,Danaus plexippus). A single lepidopteran species could not be identified beyond the Tortricidae family. We focused on folivorous individuals, using larvae from lepidopteran and hymenopteran species and adults only from a single coleopteran species (Chrysochus auratus).
Feeding assays
In no-choice assays, a single individual was weighed and placed in a single rearing cup with a single, pre-weighed leaf from a potential host plant (seeTable 1). Each rearing cup was randomly assigned to one of four temperatures (20, 25, 30, and 35◦C, see
have been used to assess herbivore performance and dietary preferences in lepidopterans (Kingsolver & Woods, 1998;Kingsolver & Woods, 1997) and coleopterans (Gange et al., 2012;Lemoine et al., 2013). We divided all consumption rates by the initial mass of the individual used in the feeding assay to account for variation in body size among replicates. Consumption rates are reported as grams consumed per gram body mass.
Control assays with no herbivores accounted for autogenic change in leaf weight over the 24 h period (n=5 per plant species per temperature). Leaves of all plant species exceptL. styracifluagained mass over 24 h in the absence of herbivores. Larger leaves gained more mass than did smaller leaves. We therefore used species-specific equations to correct for autogenic change in leaf mass (Table S3) rather than using mean change in leaf mass across all autogenic controls. Mass-specific autogenic changes, whether positive or negative, were added to leaf final weights. Negative autogenic changes (i.e., plants lost mass in control assays) would therefore lower estimates of consumption and vice versa. In total, we conducted 552 no-choice feeding assays, resulting in 496 observations after removing individuals that died or molted overnight (final replicate numbers for each herbivore/plant/temperature combination given inTable S1).
Plant traits
To assess the mechanisms by which temperature affected herbivore performance among plant species, we quantified nutritional characteristics of undamaged leaves (n=3–5) of each plant species, all collected from unique individuals. Prior to all nutrient content analyses, leaves were weighed, dried to a constant mass at 60◦
C, and re-weighed to estimate water content. Dried leaf material was ground to a fine powder for carbon (C), nitrogen (N), and phosphorus (P) analyses. Percent C and N were estimated using an EAI CE-440 elemental analyzer (Exeter Analytics, Coventry, UK). Phosphorus content was determined using dry oxidation-acid hydrolysis extraction followed by colorimetric analysis on a microplate spectrophotometer (PowerWave XS; Biotek, Winooski, VT).
Statistical analyses
Thermal reaction norms of consumption describe the influence of temperature on consumption rates. Regardless of the specific equation used to model a reaction norm, all thermal reaction norms are characterized by a thermal minimum below which consump-tion is zero, a thermal optimum where consumpconsump-tion rate is maximized and beyond which consumption declines, and a thermal maximum, above which consumption is zero. We modeled the thermal reaction norm of consumption rates for each herbivore-plant pairing using a quadratic exponential (i.e., Gaussian) curve because such curves often describe thermal reaction norms (Angilletta, 2006):
yij=exp
aj+bjTempij+cjTemp2ij
+εij
whereyijis consumption of theith observation in thejth herbivore-plant pair andεijis residual error. We assumed that errors were normally distributed with a constant variance, but the variance was allowed to differ for each curve due to differing numbers of replicates among herbivore-plant pairings. Hereafter, parameters will be referred to as the intercept (a), exponential (b), and Gaussian (c) terms. The interceptadenotes mean consumption rate (since all predictor variables were standardized, see below), the exponential term
bdenotes the rate at which consumption initially increases with temperature, and the Gaussian termcdenotes the extent to which consumption rates level offor decline at high temperatures.
Plant nutritional quality can affect the shape of the thermal response curve by influencing any one of the three parameters that determine the shape of the Gaussian curve. Therefore, each parameter (intercept, exponential, and Gaussian) was modeled as function of nitrogen, phosphorus, and water content of the given plant for each herbivore-plant thermal response curve. For example, the exponential term of thejth curve was a linear function of plant quality:
bj=µb+γ1Nj+γ2Pj+γ2H2Oj+δj
whereµbis the overall, community-level linear parameter, andγ1,γ2, andγ3represent the
influence of nitrogen (%N), phosphorus (%P), and water content (%H2O) respectively on
the exponential parameter of thejth thermal response curve.δjis a multivariate normal error term. Thus, mean consumption rate (a), the rate of increase with temperature (b), and the extent of curvature in the thermal response curve (c) were all modeled as linear functions of plant nutritional content. The random effects for each curve (i.e., parameters
aj,bj,cj) were assumed to come from a multivariate normal distribution, allowing for covariance among parameter estimates.
Each parameter was given a mildly uninformative prior normal distribution (N(0, 1)); variance parameters were given uninformative prior uniform distributions (U(0, 100)). Because predictors were standardized, the magnitude of parameter estimates will be small, such that a standard normal distribution is relatively uninformative. For each parameter, we calculated the 80% and 95% Bayesian credible interval (CI) from the posterior simulations. Parameters whose 95% CI excluded zero were considered highly significant, whereas parameters whose 80% CI excluded zero were considered marginally significant. If the 80% CI included zero, we assumed that the parameter had a low probability of being important. All assumptions of normality and homogenous variances were examined using residual plots. All analyses were conducted using Python v2.7. Bayesian models were evaluated using STAN v2.1 (Stan Development Team, 2013), accessed via PySTAN. Python code for the hierarchical model is available asAppendix S1. All code and raw data are available on the corresponding author’s website1and will be uploaded to the Dryad
1
http://www.natelemoine.com database.2
2
http://datadryad.org/
Climate change simulations
We sought to understand how potential variability in thermal response curves among herbivores interacts with climate change to alter potential top-down control of plant biomass. Thus, we next built a simple model utilizing observed feeding rates and temperatures to estimate cumulative consumption first over one growing season, and then cumulative consumption given two climate change scenarios,+3 and a+5◦C increases in temperature, a moderate and severe climate warming scenario, respectively (IPCC, 2007). We obtained hourly temperature records for June–August 2013 from the NOAA weather station in Annapolis, MD (Fig. S2). We then used the 1000 posterior draws of observed feeding rates to estimate hourly consumption rates (including parameter uncertainty) for each herbivore-plant combination across the observed temperature range. Most hourly temperature readings were within the 20–35◦
C range used in our experiments (Fig. S2). This yielded 1000 estimates of cumulative consumption for every herbivore-plant pair. We then simulated climate change by adding 3◦
and 5◦
to hourly temperature records and repeating the above calculations.
This method makes several important assumptions: (1) thermal effects of climate change can be approximated by adding a constant increase in temperature to all hourly temperature records, (2) that an individual feeds at a constant rate for the entire season with no variation as the instar grows over time, and (3) that a single individual is responsible for feeding, or multiple non-overlapping individuals immediately replace one another upon dying to maintain a constant consumption rate across the growing season. These assumptions will often not hold true so our method of assessing climate change is a relatively coarse picture of how climate change may affect herbivory rates over the course of an entire season.
RESULTS
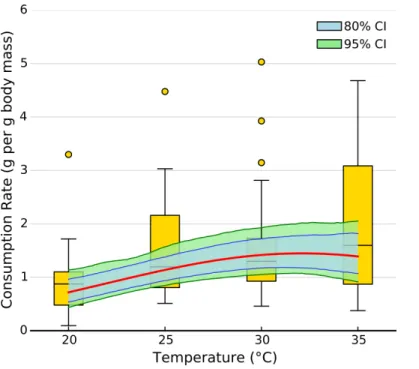
Figure 2 Effect of temperature on overall consumption rates.Shaded area represents the 80% (blue) and 95% (green) credible interval of the prediction. Line shows the median posterior prediction.
temperature (Figs. 2and3). However, the increase was restricted to temperatures between 20 and 30◦C (Fig. 1). The 95% CI of the Gaussian parameter (c) narrowly included zero, but the bulk of the posterior distribution for this parameter lay below zero, indicating that overall consumption rates began to level offat temperatures above 30◦
C (Pr(<0)=0.96,
Fig. 3). Accordingly, our model predicts relatively little change in overall consumption rates between 30 and 35◦
C (Fig. 2). Variance in consumption rates among herbivore-plant pairs also increased substantially with rising temperature. At 20◦, variance among mean herbivore-plant consumption rates was 0.45, while at 35◦
this variance increased to 1.43. Thus, variability in consumption rates among herbivore-plant pairs increased by over 300%. As a result, at 20◦C the predicted mean community-level consumption rates lie between 0.44 and 1.13 g per day (95% CI). Estimates of mean community-level consumption were more uncertain at higher temperatures, lying between 0.93 and 2.13 g per day (95% CI).
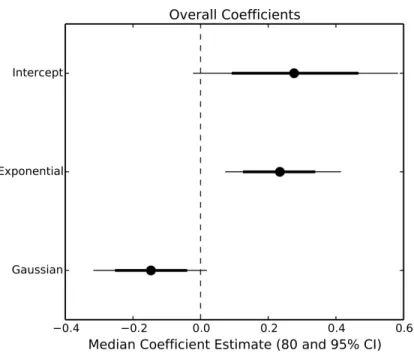
Mala-Figure 3 Parameter estimates of overall consumption rates.Points represent the median posterior estimate, while lines show the 80% (thick line) and 95% (thin line) CI.
cosoma americanum–Prunus serotina, Melanophia canadaria–Acer negundo, Nematus tibialis–Robinia pseudoacacia, P. troilus–L. benzoin, Saucrobotys futilalis–A. cannibinum,
Unidentified Tortricid– L. benzoin) increased consumption with warming throughout the entire temperature range, where the exponential parameter (b) was significantly or moderately different from zero. In some cases the parameter value was small enough that the fit was approximately linear (e.g., Epimecis hortaria–Sassafras albidum,Figs. 4
and5). An additional four herbivore-plant combinations (Danaus plexippus–A. syriaca,
E. hortaria–Liriodenron tulipifera, Euchaetes egle–Apocynum cannibinum, M. canadria–S. albidum, Papilio polyxense–Foeniculum vulgare) showed no detectable change in consump-tion rate with increasing temperature.
Even within herbivore species, thermal response curves varied considerably. For example,E. hortariaconsumption ofL. benzoin, and to a lesser extentS. albidum, increased exponentially with temperature (Fig. 4). However,E. hortariaconsumption ofL. tulipifera
did not vary significantly over the observed temperatures (Figs. 4and5). Likewise,
P. troilusincreased consumption ofL. benzoinacross temperatures, but consumption of
S. albidumbegan to decline at 35◦
(Fig. 4). We were not able to detect any effect of plant nutritional content on the shape of thermal response curves among herbivore-plant pairs (Fig. 6).
Figure 4 Effect of temperature on consumption rates for each herbivore-plant pair.The thick line shows the median posterior estimate, shaded area shows the 95% confidence interval. Solid lines are significant at the 95% level, while dotted lines are significant at the 80% level. In some cases, a dotted line has a highly significant linear term but a moderately significant quadratic term (e.g., Hyphantrea cunea–Liquidambar styraciflua, see Fig. 4). Points depict mean consumption rates (±1 S.E.). Points are weighted by sample size, such that larger points contain more observations, to
Figure 5 Parameter estimates for each herbivore-plant pair.Points represent the median posterior estimate, while lines show the 80% (thick line) and 95% (thin line) CI.
Figure 6 Parameter estimates for nutritional content effects on thermal response curves.Points represent the median posterior estimate, while lines show the 80% (thick line) and 95% CI.
increase for four herbivore-plant pairs (Fig. 7). A 5◦C increase in temperature exacerbated this variability, as five herbivore-plant pairs exhibited<20% increase in cumulative consumption and four herbivore-plant pairs exhibited a>50% increase (Fig. 7). Further, increased warming from 3 to 5◦C had highly variable impacts on cumulative consumption rates among herbivore-plant pairs. For example,Atteva aureanearly doubled its estimated consumption of Ailanthus altissimaas warming increased from 3 to 5◦
C, whereas estimated consumption byMelanophia canadariawas unaffected by temperature increases beyond 3◦C (Fig. 7). Thus, high intra- and interspecific variability in the herbivore-plant thermal response curves led to high variability in potential climate change effects on top-down control of plant biomass over an entire growing season.
DISCUSSION
Figure 7 Change in cumulative consumption due to warming for each herbivore-plant pair.Percent change (±1 S.E.) in cumulative consumption resulting from a 3 and 5◦C increase in warming for all
herbivore-plant pairs.
biomass at the community or species level. Our data suggest that the influence of rising temperature on potential top-down control of plant biomass via herbivory depends upon the identity of the herbivore-plant pair under consideration. Such variability in the relationship between consumption rate and temperature will make it difficult to predict the effects of temperature changes, i.e., climate change, on top-down control of plant biomass.
Theory predicts that herbivory rates should increase exponentially with rising temper-ature more quickly than primary production, reducing standing plant biomass at higher temperatures (Gillooly et al., 2001;O’Connor et al., 2009;O’Connor, Gilbert & Brown, 2011) However, meta-analyses of thermal response curves report substantial variability among species. Indeed, approximately 40% of the thermal response curves examined byDell,
Pawar & Savage (2011)exhibited curvature, wherein the thermal response curve began to
decrease at high temperatures. In our study, 33% of the herbivore-plant pairs exhibited substantial curvature, reducing consumption of plant biomass at high temperatures, thereby contradicting theoretical predictions of exponential increases in top-down control of plant biomass at high temperatures. Often, reduced consumption rates at high temperatures result from metabolic demand exceeding energetic supply, such that energy available for tasks beyond cellular maintenance, such as movement, feeding, or digestion, decreases sharply at high temperature (Somero, 2011). This results in rapid decreases in consumer fitness at temperatures beyond an organism’s thermal optimum (Lemoine &
Burkepile, 2012). We show that community-level herbivory rates display the same, albeit
temperatures, rather than a rapid drop-offbeyond some threshold value, is a result of species-specific variation in thermal response curves. Almost half (43%) of plant-herbivore pairings did not show signs of decreased consumption at higher temperature, while one showed evidence of declining consumption beyond 30◦C, leading to no net change in overall consumption rates at higher temperatures.
Such variation in thermal response curves makes predicting the effects of temperature changes (i.e., microhabitat variation, seasonal effects, climate change) on herbivore-plant interactions challenging in the absence of species-specific information. Indeed, a generalist herbivore may have as many thermal response curves as host plants (Lemoine et al., 2013) We report similar patterns here. For example,Epimecis hortaria, the tulip tree beauty moth, rapidly increased consumption of bothLindera benzoin and Sassafras albidumwith warming, but the increased consumption ofS. albidumwas much slower. In contrast,
E. hortariashowed no relationship between consumption ofLiriodendron tulipiferaand temperature. Similarly,Papilio troilusincreased consumption of bothL. benzoinand
S. albidumwith increasing temperature, but consumption ofS. albidumbegan to decrease at 35◦C, and consumption ofL. benzoinshowed no curvature.
Given the high variation in thermal response curves among herbivore-plant combina-tions, predicting the effects of climate change on the top-down control of plant biomass remains challenging. Some studies have ascribed a single thermal response curve to herbivore species, demonstrating that plant biomass will decrease in a warming world as herbivory rates outpace primary production (O’Connor, Gilbert & Brown, 2011) Our results suggest that using a single consumption-temperature relationship for all herbivores can substantially overestimate the impact of climate change on plant biomass. For example, between 20 and 30◦
C, bothChrysochus auratusandSaucrobotys futilalis
increased consumption ofApocynum cannibinum. However, at 35◦C. auratusdecreased consumption whileS. futilaliscontinued to increase consumption, resulting in little change in overall consumption rates onA. cannibinumbeyond 30◦
C.
When we integrated these changes in consumption over a full growing season, we showed that top-down control on plant biomass is likely to increase with increasing temperature but the magnitude of the increase depends on the herbivore-plant com-bination. Over the course of a summer, simulated warming resulted in>20% increase in cumulative consumption for 10 herbivore-plant pairs, just under half of the pairings examined. Conversely, simulated climate change resulted in>40% increase in cumulative consumption for five herbivore-plant pairs. Overall, the change in consumption ranged from no change to an increase of over 60%. This variability in consumption may explain why studies documenting significant effects of warming on top-down control of plant biomass typically examine one herbivore species (Chase, 1996;Barton, Beckerman &
Schmitz, 2009) while studies focusing on entire herbivore communities report weak or
negligible effects of warming (Richardson et al., 2002).
Conversely, compensatory feeding predicts that consumption rates should increase more rapidly with temperature for plants of low nutritional quality as herbivores attempt to fuel rising metabolic demands (e.g.,Williams, Lincoln & Thomas, 1994). Our data suggest that plant nutritional content had little effect on thermal response curves among herbivore species. However, prior work has found that the relationship between temperature and consumption rates within a given species can vary with dietary quality. For example, the Japanese beetlePopillia japonicaincreased growth and consumption rates at high temperatures only on host plants with high nitrogen and carbon concentrations (Lemoine et al., 2013). This may also be the case in our data. Within an herbivore species, we can distinguish some patterns related to plant quality. For example, the generalist herbivore
Epimecis hortariaincreased consumption rapidly with warming only on higher nitrogen plant species. Within a plant species, however, patterns were less clear, as particular herbivore species were equally likely to have unimodal or exponential curves when feeding on the same plant. Thus, across all 21 plant-herbivore pairings, we were unable to detect an overall pattern relating plant quality to multiple thermal reaction norms. Thus, dietary quality may be more important for determining thermal response curves within herbivore species but cannot predict the shape of consumption thermal response curves among herbivore and plant species.
We focused on examining herbivore response to increasing temperature while holding plant phytochemistry constant, but rising temperatures might also affect plant phyto-chemistry. Plant growth rates increase with rising temperatures (Veteli et al., 2002), which could alter nutritional content or concentrations of defensive compounds as plants shuttle more resources into growth (Coley, Bryant & Chapin, 1985). However, studies have shown that the effects of temperature on plant secondary chemistry are highly idiosyncratic among species (Veteli et al., 2002;Zvereva & Kozlov, 2006). Furthermore, although variable temperature can alter nutritional quality within a species, variation caused by temperature is substantially lower than inherent variation among plant species (Aerts et al., 2009). However, the effects of rising temperature on plant chemistry must be considered more completely before applying results such as ours in a climate change context.
One potential caveat of our study is small sample size at many herbivore-plant-temperature combinations. Given that we used field-collected organisms, sample size varied considerably depending on the rarity of the species. Common and/or gregarious species, likeE. hortaria,M. canadaria, andH. cunea, have much higher sample sizes than rare or cryptic species, likeD. plexippusandA. scapularis. Thus, some herbivore-plant pairs show considerable variability in the estimated thermal response curve and, in some cases, the prediction was heavily influenced by the overall response. However, most work regarding the influence of temperature on herbivory and its interaction with diet quality focus on a few readily available lepidopteran herbivores (Kingsolver & Woods, 1998;
In summary, we show that herbivory, and therefore potential top-down control of plant biomass, is highly contingent upon environmental temperature. While theoretical predictions suggest that climate change might increase top-down control of plant biomass, our results indicate that the effects of temperature on herbivory rates are highly variable. A single plant species might experience more or less herbivory at higher temperatures, depending on the identity of the herbivores present. Insects often control plant community structure (Carson & Root, 2000) and dominance hierarchies among plant species (Kim, Underwood & Inouye, 2013) Thus, studies documenting the species-specific effects of temperature on insect herbivory levels will be crucial to understanding how climate change might affect community composition in the plant-herbivore assemblages of the future.
ACKNOWLEDGEMENTS
We would like to thank W Drews, J Shue, S Cook-Patton, and A Shantz for help collecting insects, running feeding assays, and insights on the manuscript.
ADDITIONAL INFORMATION AND DECLARATIONS
Funding
Work was supported by a Presidential Fellowship from FIU (NL). The funders had no role in study design, data collection and analysis, decision to publish, or preparation of the manuscript.
Grant Disclosures
The following grant information was disclosed by the authors: FIU.
Competing Interests
John D. Parker is an employee of the Smithsonian Environmental Research Center.
Author Contributions
• Nathan P. Lemoine conceived and designed the experiments, performed the experi-ments, analyzed the data, contributed reagents/materials/analysis tools, wrote the paper, prepared figures and/or tables, reviewed drafts of the paper.
• Deron E. Burkepile conceived and designed the experiments, wrote the paper, reviewed drafts of the paper.
• John D. Parker conceived and designed the experiments, contributed reagents/materials/analysis tools, wrote the paper, reviewed drafts of the paper.
Data Deposition
Supplemental Information
Supplemental information for this article can be found online athttp://dx.doi.org/ 10.7717/peerj.376.
REFERENCES
Aerts R, Callaghan TV, Dorrepaal E, van Logtestijn RSP, Cornelissen JHC. 2009.Seasonal climate manipulations result in species-specific changes in leaf nutrient levels and isotopic composition in a sub-arctic bog.Functional Ecology23:680–688
DOI 10.1111/j.1365-2435.2009.01566.x.
Angilletta MJ. 2006.Estimating and comparing thermal performance curves.Journal of Thermal Biology31:541–545DOI 10.1016/j.jtherbio.2006.06.002.
Angilletta MJ. 2009.Thermal adaptation: a theoretical and empirical synthesis. New York: Oxford University Press.
Angilletta MJ, Steury TD, Sears MW. 2004.Temperature, growth rate, and body size in ectotherms: fitting pieces of a life-history puzzle.Integrative and Comparative Biology
44:498–509DOI 10.1093/icb/44.6.498.
Bagchi R, Gallery RE, Gripenberg S, Gurr SJ, Narayan L, Addis CE, Freckleton RP, Lewis OT. 2014.Pathogens and insect herbivores drive rainforest plant diversity and composition.Nature
DOI 10.1038/nature12911.
Barton BT, Beckerman AP, Schmitz OJ. 2009.Climate warming strengthens indirect interactions in an old-field food web.Ecology90:2346–2351DOI 10.1890/08-2254.1.
Buckley LB, Nufio CR, Kingsolver JG. 2014.Phenotypic clines, energy balances and ecological responses to climate change.Journal of Animal Ecology83:41–50DOI 10.1111/1365-2656.12083. Carson WP, Root RB. 2000.Herbivory and plant species coexistence: community regulation by an
outbreaking phytophagous insect.Ecological Monographs70:73–99
DOI 10.1890/0012-9615(2000)070[0073:HAPSCC]2.0.CO;2.
Chase JM. 1996.Abiotic controls of trophic cascades in a simple grassland food chain.Oikos
77:495–506DOI 10.2307/3545939.
Coley PD, Bryant JP, Chapin FS. 1985.Resource availability and plant antiherbivore defense.
Science230:895–899DOI 10.1126/science.230.4728.895.
Dell AI, Pawar S, Savage VM. 2011.Systematic variation in the temperature dependence of physiological and ecological traits.Proceedings of the National Academy of Science of the United States of America108:10591–10596DOI 10.1073/pnas.1015178108.
Gange AC, Eschen R, Wearn JA, Thawer A, Sutton BC. 2012. Differential effects of foliar endophytic fungi on insect herbivores attacking a herbaceous plant.Oecologia168:1023–1031
DOI 10.1007/s00442-011-2151-5.
Gelman A, Hill J. 2007.Data analysis using regression and multilevel/hierarchical models. New York: Cambridge University Press.
Gillooly JF, Brown JH, West GB, Savage VM, Charnov EL. 2001.Effects of size and temperature on metabolic rate.Science293:2248–2251DOI 10.1126/science.1061967.
IPCC. 2007.Climate change 2007: synthesis report. United Nations Environmental Programme. Kim TM, Underwood N, Inouye BD. 2013.Insect herbivores change the outcome of plant
competition through both inter- and intraspecific processes.Ecology 94:1753–1763
DOI 10.1890/12-1261.1.
Kingsolver JG, Schlichta G, Ragland GJ, Massie KR. 2006.Thermal reaction norms for caterpillar growth depend on diet.Evolutionary Ecology Research8:705–715.
Kingsolver JG, Woods HA. 1997.Thermal sensitivity of growth and feeding inManduca sexta
caterpillars.Physiological Zoology70:631–638.
Kingsolver JG, Woods HA. 1998.Interactions of temperature and dietary protein concentration in growth and feeding ofManduca sextacaterpillars.Physiological Entomology23:354–359
DOI 10.1046/j.1365-3032.1998.00105.x.
Lemoine NP, Burkepile DE. 2012.Temperature-induced mismatches between consumption and metabolism reduce consumer fitness.Ecology93:2483–2489DOI 10.1890/12-0375.1.
Lemoine NP, Drews WA, Burkepile DE, Parker JD. 2013.Increased temperature alters feeding be-havior of a generalist herbivore.Oikos122:1669–1678DOI 10.1111/j.1600-0706.2013.00457.x. Metcalf DB, Asner GP, Martin RE, Espejo JES, Huasco WH, Am´ezquita FFF,
Carranza-Jimenez L, Cabrera DFG, Baca LD, Sinca F, Quispe LPH, Taype IA, Mora LE, D´avila AR, Sol ´orzano MM, Vilca BLP, Rom´an JML, Bustios PCG, Revilla NS, Tupayachi R,
Girardin CAJ, Doughty CE, Malhi Y. 2014. Herbivory makes major contributions to ecosystem carbon and nutrient cycling in tropical forests.Ecology Letters17:324–332
DOI 10.1111/ele.12233.
O’Connor MI. 2009.Warming strengthens an herbivore-plant interaction.Ecology90:388–398
DOI 10.1890/08-0034.1.
O’Connor MI, Gilbert B, Brown CJ. 2011.Theoretical predictions for how temperature affects the dynamics of interacting herbivores and plants.The American Naturalist 178:626–638
DOI 10.1086/662171.
O’Connor MI, Piehler MF, Leech DM, Anton A, Bruno JF. 2009.Warming and resource availability shift food web structure and metabolism.PLOS Biology7:e1000178
DOI 10.1371/journal.pbio.1000178.
Richardson SJ, Press MC, Parsons AN, Hartley SE. 2002.How do nutrients and warming impact plant communities and their insect herbivores? A 9-year study from a sub-Arctic heath.Journal of Ecology90:544–556DOI 10.1046/j.1365-2745.2002.00681.x.
Singer A, Travis JMJ, Johst K. 2013.Interspecific interactions affect species and community responses to climate shifts.Oikos122:358–366DOI 10.1111/j.1600-0706.2012.20465.x. Somero GN. 2011.Comparative physiology: a “crystal ball” for predicting consequences of global
change.American Journal of Physiology: Regulatory, Integrative and Comparative Physiology
301:R1–R14DOI 10.1152/ajpcell.00345.2010.
Stamp NE, Osier TL. 1998.Response of five insect herbivores to multiple allelochemicals under fluctuating temperatures.Entomologia Experimentalis et Applicata 88:81–96
DOI 10.1046/j.1570-7458.1998.00349.x.
Stamp NE, Yang Y. 1996.Response of insect herbivores to multiple allelochemicals under different thermal regimes.Ecology77:1088–1102DOI 10.2307/2265578.
Stamp NE, Yang Y, Osier TL. 1997.Response of an insect predator to prey fed multiple allelochemicals under representative thermal regimes.Ecology78:203–214
Stan Development Team. 2013.Stan: a C++library for probability and sampling.
Available athttp://mc-stan.org/.
Urban MC, Tewksbury JJ, Sheldon KS. 2012. On a collision course: competition and dispersal differences create no-analogue communities and cause extinctions during climate change. Proceedings of the Royal Society B: Biological Sciences279:2072–2080
DOI 10.1098/rspb.2011.2367.
Vassuer DA, McCann KS. 2005.A mechanistic approach for modeling temperature-dependent consumer-resource dynamics.The American Naturalist166:184–198DOI 10.1086/431285. Veteli TO, Kuokkanen K, Julkunen-Tiitto R, Roininen H, Tahvanainen J. 2002.Effects of elevated
CO2 and temperature on plant growth and herbivore defensive chemistry.Global Change
Biology8:1240–1252DOI 10.1046/j.1365-2486.2002.00553.x.
Vucic-Pestic O, Ehnes RB, Rall BC, Brose U. 2011.Warming up the system: higher predator feeding rates but lower energetic efficiencies. Global Change Biology 17:1301–1310
DOI 10.1111/j.1365-2486.2010.02329.x.
Williams RS, Lincoln DE, Thomas RB. 1994.Loblolly pine grown under elevated CO2affects early instar pine sawfly performance.Oecologia98:64–71DOI 10.1007/BF00326091.
Zvereva EL, Kozlov MV. 2006.Consequences of simultaneous elevation of carbon dioxide and temperature for plant-herbivore interactions: a metaanalysis.Global Change Biology12:27–41