2019
UNIVERSIDADE DE LISBOA
FACULDADE DE CIÊNCIAS
DEPARTAMENTO DE BIOLOGIA ANIMAL
The role of avian seed dispersal in forest regeneration on
degraded areas of a sub-humid forest in Guinea-Bissau
(West Africa)
Sara Isabel da Costa Gomes
Mestrado em Biologia da Conservação
Dissertação orientada por:
Doutora Ana Margarida Torres Rainho
Doutor Luís Miguel Fazendeiro Catarino
ii
AGRADECIMENTOS
Em primeiro lugar gostaria de agradecer aos meus orientadores. À minha orientadora, Ana Rainho, obrigada pela oportunidade de realizar este trabalho, a teu lado, e pela confiança que depositaste em mim. Foi a primeira vez que tive oportunidade de visitar e trabalhar noutro continente, o que tornou a experiência ainda mais marcante. Obrigada por toda a ajuda, paciência, e por me motivares, quer seja com um abraço ou com uma “chamada à terra”. Admiro muito o teu trabalho e não poderia ter pedido melhor orientação!
Ao meu orientador, Luís Catarino, obrigada por todo o apoio e interesse que demonstrou na tese logo desde o início. Obrigada pela sua dedicação e horas que passámos no herbário, a preparar a saída e a identificar as plantas e as sementes, quando voltámos. O facto de nos ter acompanhado na nossa estadia no Cantanhez numa fase inicial foi fundamental para conhecer melhor a vegetação destas florestas. Obrigada por todas as histórias que partilhou e por me introduzir à cultura do local a que chegámos! Gostaria também de agradecer ao IBAP (Instituto da Biodiversidade e das Áreas Protegidas) e ao Director do Parque Nacional de Cantanhez, Queba Quecuta, pelo apoio prestado durante a realização do projecto. À Aissa Regala e a Alfredo Simão da Silva, pela disponibilidade e pelo apoio durante a nossa estadia no país. À AD (Acção para o Desenvolvimento) e à AIN (Associazione Interptreti Naturalistici), pela disponibilização do alojamento. Um agradecimento especial aos meus guias, Saidou, Mamadu, Braima Vieira e Braima Cassamá. O vosso apoio foi essencial e sem vocês o trabalho não era possível. Desde montar e desmontar armadilhas, encontrar árvores “perdidas” para ver cachus, fazer a ponte com os locais e pelas histórias que foram partilhando: djarama!
Patrícia, minha colega e amiga desta aventura! Obrigada por me inspirares com a tua coragem e resiliência e por todos os dias me lembrares do privilégio que foi podermos viver isto as duas. Todos os risos, choros e coisas novas que víamos e partilhávamos todos os dias, tornaram esta experiência inesquecível. Obrigada por me apoiares do início ao fim, nesta jornada.
Pais, obrigada pelo vosso amor e apoio ao longo de todos estes anos, mas em especial por apoiarem os sonhos mais aventureiros e me permitirem explorar o mundo, como nunca tiveram oportunidade. Obrigada por me ensinarem todos os dias, independentemente da distância, e por estimularem a minha evolução. Sofia, obrigada por toda a força e inspiração para continuar esta jornada. Especialmente por me vires raptar das quatro paredes de vez em quando (ou te juntares a mim dentro delas) e me levares a passear ou a fazer “sitting de amor patudo”!
João, obrigada por estares sempre ao meu lado, quer nos momentos felizes, quer nos momentos mais difíceis. Obrigada por me apoiares e acreditares sempre mim e por reforçares ainda mais o meu amor pelas aves (em especial pelos pardalitos)!
Mélanie, Psiu, Davide, meus eternos compinchas de Aveiro! Obrigada pelo vosso apoio constante, companhia, conversas ao telefone e por acreditarem sempre em mim. Carolina, Patty, Patxó e Tânia, obrigada pela amizade e força que me deram, praticamente todos os dias, quer no laboratório, quer desde uma ilha no meio do oceano! Fragoso, obrigada por me mostrares que devo levar tudo de uma forma mais leve na vida e por de vez em quando abandonares o “teu” castelo e vires fazer uma visita aos irmãos da capital! Filipa e Eduardo, obrigada pela vossa paciência e apoio nesta reta final, a vossa ajuda foi fundamental!
Por fim, um agradecimento especial ao apoio que todos nos deram, através da nossa iniciativa “The Future of Guinea-Bissau’s Tropical Forests” e que tornaram esta aventura possível! Especialmente ao André e ao Raimundo, que mesmo sem me conhecer demonstraram um enorme carinho e apoio.
iii
RESUMO ALARGADO
As florestas tropicais albergam grande parte da biodiversidade terrestre, no entanto, a sua área de ocupação está a diminuir a um ritmo acelerado e preocupante. Resultado de uma crescente pressão antropogénica, o abate de manchas de floresta nativa e da sua conversão em terrenos agrícolas é recorrente. Simultaneamente, as terras anteriormente cultivadas começaram a ter períodos de pousio mais curtos, inviabilizando a regeneração natural da fertilidade dos solos. Desta forma, a sucessão natural da floresta nas áreas degradadas dá-se de uma forma lenta e depende em grande escala dos movimentos de animais frugívoros, tais como as aves, para a dispersão de sementes provenientes do interior da floresta.
Diferentes espécies de frugívoros podem diferir drasticamente na sua capacidade de dispersão, dependendo do seu grupo taxonómico, de traços ligados à sua história de vida, da sua morfologia ou do seu comportamento de alimentação. Para além disso, a estrutura da paisagem tem um papel fundamental na atracção dos dispersores. A disponibilidade de poisos, a complexidade estrutural da vegetação e a presença de recursos alimentares, especialmente de frutos, são exemplos de características relevantes que podem aumentar o número de visitas por frugívoros, facilitando a recolonização e a regeneração das áreas degradadas. Por outro lado, a eficácia da dispersão de sementes por animais pode ser limitada pelo grau de isolamento à fonte de sementes, pela ausência de dispersores na região, pelo tamanho das sementes ou mesmo pela predação das próprias sementes pelo dispersor. A disrupção da relação mutualista entre plantas e animais dispersores de sementes, em consequência da degradação da floresta e das alterações no uso do solo pelo Homem, pode condicionar o futuro das florestas tropicais.
Uma longa história de ocupação humana do continente Africano levou a um ritmo alarmante de perda de floresta e, particularmente na Guiné-Bissau, a agricultura familiar e a conversão de floresta em plantações de caju têm vindo a transformar a vegetação do país. Actualmente, é possível encontrar pequenas manchas residuais de floresta sub-húmida e seca semi-decídua em razoável estado de conservação na região sudoeste da Guiné-Bissau, no Parque Nacional de Cantanhez (PNC). Identificar e compreender os mecanismos pelos quais a floresta poderá regenerar naturalmente nas áreas degradadas, nomeadamente através da dispersão de sementes por aves, são tópicos chave de conservação não só para as florestas do PNC, como também para a generalidade das florestas de África Ocidental. Este estudo tem como principal objectivo contribuir para o conhecimento do papel da dispersão de sementes por aves nas áreas degradadas do PNC e propor medidas de gestão que promovam a presença de aves dispersoras, nestes locais, de forma a que a regeneração natural e a conservação das florestas seja potenciada.
Para concretizar estes objectivos, identificaram-se as espécies de plantas que estão a ser dispersadas desde o interior da floresta, até às áreas degradadas. Para isso, foram montadas 120 armadilhas de sementes, em 24 talhões, nas áreas degradadas circundantes de duas manchas de floresta madura (Lauchande e Madina), de forma a recolher excrementos e a identificar as espécies de plantas das sementes neles contidas. Registaram-se, adicionalmente, as características da vegetação presente em cada talhão e para cada armadilha de sementes, de forma a perceber os factores que poderão influenciar a deposição de sementes nestes locais. Para averiguar a viabilidade das sementes que chegam a estas áreas e perceber se podem potenciar a regeneração da floresta, realizaram-se testes de germinação em laboratório. Para além disso, identificaram-se e quantificaram-se as aves potenciais dispersoras de sementes presentes nas mesmas áreas, através da realização de 64 pontos de observação. Foram realizadas observações ao amanhecer e ao entardecer, num total de 149.5 horas, em árvores de diferentes famílias e em áreas abertas. Em cada ponto de observação foram registadas as características da árvore
iv e da paisagem, de forma a identificar as caracteríticas destas áreas que poderão influenciar a presença das diferentes espécies de potenciais dispersores nestes locais.
No total, foram recolhidos 166 excrementos, sendo que cerca de 28% continham sementes. A altura das árvores, por baixo das quais se montaram as armadilhas, revelou ter uma importante influência na deposição de excrementos e de sementes, sendo que árvores mais altas apresentaram maiores abundâncias de ambos. Árvores mais altas deverão ser pousos importantes para as aves, uma vez que oferecerem uma maior proteção contra predadores e também melhores oportunidades de alimentação. Para além disso, foi encontrada uma relação positiva entre a abundância de excrementos e talhões com uma maior complexidade da vegetação, implicando também um maior número de árvores médias e altas no local. Reforçando este resultado, as árvores da família Bombacaceae, que são tipicamente árvores altas e com grandes copas, parecem favorecer a deposição de excrementos em áreas degradadas. Por outro lado, a relação positiva entre a abundância de excrementos e árvores da família Moraceae pode ser explicada pelo facto destas árvores possuírem frutos que atraem uma grande diversidade de dispersores, o que sugere que as árvores de fruto são importantes focos de recrutamento de sementes. Foram contabilizadas um total de 4747 sementes e confirmada a dispersão de, pelo menos, 225 das mesmas. Foram encontrados 12 morfotipos diferentes, em que se identificaram três espécies ou géneros de árvores pertencentes ao interior da floresta, nomeadamente Ficus sp., Strombosia pustulata e Zanthozylum sp. A maior parte das sementes que está a ser depositada nas áreas degradadas são pequenas sementes e cerca de 73% das mesmas pertencem ao género Ficus. Isto pode ser justificado pelo facto de espécies de plantas pioneiras, possuírem geralmente sementes mais pequenas. Para além disso, as sementes maiores têm restrições acrescidas na sua dispersão, dependendo de aves com um maior tamanho corporal e maior abertura do bico, ou seja, da presença de uma maior diversidade de dispersores nas áreas degradadas. No final dos testes de germinação, apenas as sementes do género Ficus germinaram. Este resultado era esperado, uma vez que muitas aves conseguem dispersar as suas sementes de forma viável e não implica que, dadas as condições favoráveis no seu habitat natural, as restantes sementes não tivessem capacidade de germinar e revelar potencial de regeneração.
Quanto aos potenciais dispersores de sementes, foram identificadas 21 espécies ou géneros de aves nas áreas degradadas do PNC. As espécies mais abundantes foram os tecelões (Ploceus sp.), os pombos-verdes-africanos (Treron calvus) e as rolas (Streptopelia sp.). No entanto, estes não deverão ser os dispersores mais eficientes, uma vez que são considerados predadores de sementes e, provavelmente, apenas uma pequena percentagem de sementes por eles ingeridas poderão ser excretadas de forma viável. Assim sendo, os bulbuls (Pycnonotidae), os estorninhos-de-dorso-violeta (Cinnyricinclus leucogaster) e os calaus (Bucerotidae), surgem como os potenciais dispersores de qualidade mais abundantes nas áreas degradadas do PNC. Tendo em conta que os calaus são mais dependentes de floresta não perturbada, poderão ter um papel mais importante enquanto dispersores junto à orla da floresta. Por outro lado, os bulbuls e os estorninhos-de-dorso-violeta visitam regularmente o interior da floresta, no entanto, não dependem dela totalmente, o que poderá fazer com que tenham um papel importante na dispersão de sementes do seu interior para as áreas degradadas.
Mais uma vez, árvores altas parecem favorecer a presença de potenciais dispersores importantes nas áreas degradadas do PNC, tais como os bulbuls, os estorninhos-de-dorso-violeta e espécies especialistas de floresta, tais como os calaus e os turacos (Musophagidae). Para além disso, as árvores da família Moraceae, tais como as figueiras (Ficus sp.) e o pó-de-bicho (Antiaris toxicaria), favorecem uma maior riqueza de espécies e uma maior abundância de aves de maior porte nas áreas degradadas, talvez por possuírem frutos considerados valiosos para uma grande diversidade de frugívoros. Assim sendo, é importante que as comunidades locais sejam encorajadas a deixar estas e outras árvores de fruto nativas nas áreas degradadas, na eventualidade de existirem novos cortes de vegetação. Em áreas severamente
v degradadas, poderá ser necessária uma plantação direta de algumas árvores de fruto nativas que sejam interessantes para as aves, tais como as acima mencionadas. No entanto, isto deve ser feito de forma cautelosa, uma vez que as árvores de fruto que são normalmente plantadas nestes locais pertencem à família Anacardiaceae, que não parecem ter uma influência positiva na generalidade dos dispersores. Por fim, este estudo fornece uma importante visão geral de uma função-chave do ecossistema nas florestas do PNC: a dispersão de sementes pelas aves. Este primeiro passo para a compreensão de mecanismos que podem promover a regeneração natural das florestas, é importante não só para as florestas da Guiné-Bissau, mas também para as florestas da África Ocidental em geral, onde os fatores antropogénicos que afetam as florestas são semelhantes.
vi
ABSTRACT
Human action has been shaping the landscape of tropical regions with increasing deforestation rates and conversion of forest patches into agricultural land. Natural forest succession in degraded areas is slow and depends largely on the movements of fruit eating animals, such as birds, which disperse seeds from the forest interior. However, forest fragmentation and isolation limit the process of seed dispersal and the reduced number of dispersers present in degraded areas can abridge the future of tropical forests. In Guinea-Bissau, slash-and-burn agriculture and the conversion of forest into cashew tree orchards are the main threats to this country’s forests. In the present days, mature sub-humid forest can only be found in the south-western region of the country, in Cantanhez National Park (CNP).
The main goal of this study is to understand the role of seed dispersal by birds in degraded areas of CNP and to contribute with management measures that promote their presence in these areas, so that natural regeneration and conservation of forests is improved.
To achieve this, I aimed to determine which plant species are being dispersed from mature forest to degraded areas and understand whether dispersed seeds are viable and can potentiate forest regeneration. Seed traps were assembled in degraded areas to collect bird droppings and seeds. After identification, seeds were subjected to germination trials in the lab. In order to identify potential avian seed dispersers and the landscape elements that attract different dispersers to these areas, focal points were conducted at dawn and dusk, in trees of different species and in open fields. Landscape and tree elements that may influence the presence of birds in these areas were measured and registered.
Twenty-one bird species were identified as potential seed dispersers. Weavers (Ploceus sp.), the African Green-pigeon (Treron calvus) and doves (Streptopelia sp.) were the most abundant, even if probably not the most efficient. Recognized as good dispersers and also abundant in the area, were Bulbuls, Violet-backed starlings and Hornbills. The first two are considered forest visitors, seeming to benefit from taller trees. Tree height, is also an important driver of faeces and seed deposition and tall trees offer better predator lookouts, foraging opportunities. Hornbills are known to disperse a wide variety of seeds, including large ones, but seem to have a greater impact on forest regeneration near forest edges. Active management actions to promote forest regeneration in degraded areas should encourage that scattered native trees or small patches of trees are left in the degraded areas. Tall and large trees such as trees belonging to the Bombacaceae family should be favoured, but the presence of any perch has been proven to be beneficial to attract seed dispersers and increase seed deposition. The presence of native fruit trees, such as Fig trees (Ficus sp.) and Bark Cloth trees (Antiaris toxicaria), and a higher vegetation complexity also seem to attract a wider diversity of dispersers and increase faeces and seed deposition and should thus be promoted. These management actions should enhance seed dispersal functions and contribute for the regeneration and conservation of forests of the CNP and elsewhere in West Africa.
vii
TABLE OF CONTENTS
1. INTRODUCTION ... 1
1.1. General background information ... 1
1.2. The sub-humid forests of Guinea-Bissau ... 2
1.3. Aims ... 3
2. METHODS ... 4
2.1. Study area ... 4
2.2. Data collection ... 5
2.2.1. Reference seed collection ... 5
2.2.2. Seed dispersal ... 5 2.2.3. Dispersal agents ... 7 2.3. Data analysis ... 8 2.3.1. Seed dispersal ... 8 2.3.2. Dispersal agents ... 9 3. RESULTS ... 11 3.1. Seed dispersal ... 11 3.2. Dispersal agents ... 12 4. DISCUSSION ... 19 4.1. Seed dispersal ... 19
4.1.1. Major drivers of seed deposition ... 19
4.1.2. Dispersed plant species... 21
4.1.3. Seed viability ... 22
4.2. Dispersal agents ... 22
4.2.1. Identification of potential avian seed dispersers... 22
4.2.2. Major drivers of avian abundance and richness ... 23
4.2.3. Non-forest bird species ... 24
4.2.4. Forest visitors ... 24
4.2.5. Forest generalists ... 25
4.2.6. Forest specialists ... 26
4.3. Implications for conservation and forest regeneration ... 27
5. ACKNOWLEDGMENTS ... 28
6. REFERENCES ... 28
SUPPLEMENTARY MATERIALS ... 36
SECTION 1: Vegetation Complexity Index ... 36
viii
LIST OF TABLES
Table 2.1 - List of variables used for seed trap and plot characterization. ... 6 Table 2.2 - List of variables used for the characterization of focal points for the observation of potential
seed dispersers. ... 7
Table 2.3 – Tree species and families sampled during focal points and number of times each family was
sampled during field work. Vernacular names are presented in Creole. The table also summarizes species’ origin in Guinea-Bissau. ... 8
Table 3.1 – Abundance of plant taxa identified in faecal samples and their origin in Guinea-Bissau.
Vernacular names are presented in Creole. ... 11
Table 3.2 – Best model for the number of faecal samples collected in the seed traps. Variables’
acronyms can be found in Table 2.1. Results include Akaike’s Information Criterion for small samples (AICc) and variance inflated factors (VIF). Significance codes: ‘***’ p < 0.001, ‘**’ p < 0.01, ‘*’ p < 0.05. ... 11
Table 3.3 - List of bird species identified as potential seed dispersers in the degraded areas and
guild-level assignment for each species. Guild guild-levels were attributed based on Bennun et al. (1996) classification, described in section 2.3.2. and new classifications are marked with symbol ‘*’. ... 13
Table 3.4 - Summary of the best models for potential dispersers’ abundance, species richness, species,
families and guild levels. Variables’ acronyms can be found in Table 2.2 and species included in each guild level can be found in Table 3.3. In species with smaller sample sizes a Tree model and a Vegetation model are presented, instead of a General model. Results include Akaike’s Information Criterion for small samples (AICc) and variance inflated factors (VIF). Significance codes: ‘***’ p < 0.001, ‘**’ p < 0.01, ‘*’ p < 0.05. ... 17
Table S2.1 - Spearman correlations and respective p-values for the different variables considered in the
analysis of seed dispersal and their relation with the number of faecal sampes (Nfaecal) and number of seeds (Nseeds). Significant correlations for the number of seeds are presented in bold……….37
Table S2.2 - Spearman correlations and respective p-values for the relation between Forest specialists
(FF) and the different variables considered in the analysis of dispersal agents. Significant correlations for forest specialists’ abundance are presented in bold……….………38
LIST OF FIGURES
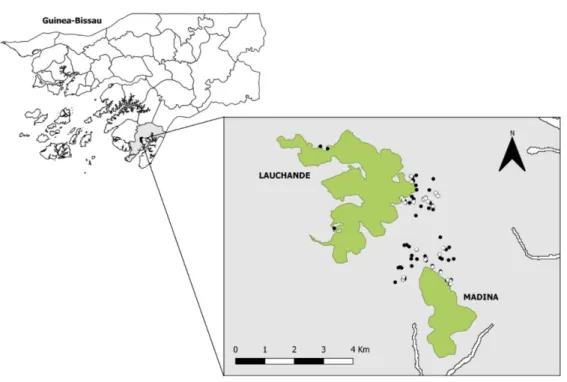
Figure 2.1 - Map of the study area. Cantanhez National Park is highlighted with a grey colour,
Lauchande and Madina forest patches are highlighted in green and observation focal points and seed trap locations are identified by black and white dots, respectively. ... 4
ix
Figure 3.1 - Boxplot representing the abundance of faecal samples found in seed traps under trees from
seven families and empty fields (AA). Significant differences between tree families are represented with letters from ‘a’ to ‘c’. Tree family acronyms are described in Table 2.1 ... 12
Figure 3.2 - Boxplot representing species richness of potential seed dispersers in seven tree families
and empty fields (AA). Tree family acronyms are described in Table 2.3. Significance codes: ‘***’ p < 0.001, ‘**’ p < 0.01, ‘*’ p < 0.05 ... 14
Figure 3.3 - Plots of the effect of distance to the closest forest edge (A), height of the tallest tree nearby
(B) and tree height (C) on Weaver’s abundance, with 95% confidence intervals. Bird abundance is represented with a logarithmic scale. Boxplot D shows the effect of different tree families on Weaver’s abundance. Tree family acronyms are described in Table 2.3. Significance codes: ‘***’ p < 0.001, ‘**’ p < 0.01, ‘*’ p < 0.05. ... 14
Figure 3.4 - Plots of the effect of tree height on Forest visitors’ (A) and Blue-spotted Wood-doves’ (B)
abundance, with 95% confidence intervals. Bird abundance is represented with a logarithmic scale. Plot C shows the effect of distance to the closest forest edge and Boxplot D the effect of tree families on Forest visitors’ abundance. Tree family acronyms are described in Table 2.3. Significance codes: ‘***’ p < 0.001, ‘**’ p < 0.01, ‘*’ p < 0.05. ... 15
Figure 3.5 - Plots of the effect of distance to the closest forest edge (A) and tree height (B) on Forest
generalists’ abundance, with 95% confidence intervals. Bird abundance is represented with a logarithmic scale. Boxplot C shows the effect of tree families on Forest generalists’ abundance. Tree family acronyms are described in Table 2.3.Significance codes: ‘***’ p < 0.001, ‘**’ p < 0.01, ‘*’ p < 0.05……….………...…16
Figure 3.6 - Plot A represents the effect of distance to the closest forest edge on Hornbills’ abundance,
with 95% confidence intervals. Bird abundance is represented with a logarithmic scale. Boxplot B shows the effect of different tree families on Forest specialists’ abundance. Tree family acronyms are described in Table 2.3. ………..……...…….16
Figure S1.1 - Detrended Correspondence Analysis result. Axis 2 was chosen to ordinate vegetation
complexity. Seed traps’ plots are represented with “TL” and “TM” initials. The variables considered for this ordination analysis were: percentage of bare soil (%Baresoil), percentage and average height of herbaceous vegetation (%Herb, Herb_height) and shrubs (%Shrub, Shrub_height), number and average height of small and medium trees (NrMST, AvgHeight_MST) and the number and average height of
tall trees (NrTT, AvgHeight_TT)...…………..……….…..…36
Figure S2.1 - Plot of the significative result of the spearman correlation between the number of seeds
and tree height above the seed trap………..…37
Figure S2.2 - Plots of the significative results of the spearman correlation between forest specialists and
1
1. INTRODUCTION
1.1. General background information
Tropical forests sustain the largest biodiversity reservoir on Earth and provide crucial ecosystem services, playing a major role in the carbon and hydrological cycles, as well as providing essential resources for human communities (Fearnside 2000; Foley et al. 2005). Unfortunately, these forests are facing unprecedented pressures and degraded tropical landscapes are expanding as deforestation and changes in land-use increase due to anthropogenic pressure (Parrotta et al. 1997; Geist & Lambin 2002; Mayaux et al. 2005). With the expansion and growth of human populations in these areas, there is an increasing demand for agricultural land, a greater intensification of farmland production and overexploitation of natural resources (Foley et al. 2005; Laurance et al. 2014; Malhi et al. 2014). As a result, we have increasingly fragmented natural ecosystems consisting of smaller, isolated forest fragments separated by a mosaic of human-altered land (Haddad et al. 2015).
Traditional agricultural practices contributed for the maintenance and sustainability of agricultural fields, which were often left fallow to recover nutrients and potential production quality, allowing the natural succession of native vegetation after agricultural fields were abandoned (Brown & Lugo 1994). However, with increasing intensification of agriculture, the resources needed for forest regeneration and succession, such as seed banks, are often depleted (Brown & Lugo 1994; Duncan & Chapman 1999). Thus, after agricultural surrender the process of natural forest regeneration occurs more slowly and depends largely on the arrival of seeds from the forest interior, which are disseminated to these degraded areas either by frugivorous animals or by the wind (Brown & Lugo 1994; Nepstad et al. 1996; Duncan & Chapman 1999).
Seed dispersal is a fundamental process for the natural regeneration and restoration of forests (Wunderle Jr 1997), such that plants have adapted seed structures in several ways to both abiotic and biotic dispersal (van der Pijl 1982). In tropical regions, about 80% of tree species depend on mutualistic interactions with frugivorous animals to disperse their seeds (Howe & Smallwood 1982). These seeds are generally adapted to internal (endozoochory) or external (epizoochory) animal dispersal (van der Pijl 1982). In these regions, birds are recognized as one of the predominant animal vectors for seed dispersal of pioneer tree species, playing an important role in seed recruitment and establishment (Peña-Domene et al. 2014). Birds can disperse seeds to favourable recruitment sites (Howe & Smallwood 1982; Wenny & Levey 1998), allowing the colonization of new areas. This increases the success of seedling establishment and growth by avoiding intraspecific competition near the parent plant and high mortality rates due to predation and acquisition of pathogens (Janzen 1971; Howe & Smallwood 1982). Furthermore, seed dispersers may also improve the germination and survival of seeds they defecate, regurgitate or bury (Howe & Smallwood 1982; Heleno et al. 2011; Lenz et al. 2011), through scarification, depending on the way they handle fruits and their gut passage time (Traveset 1998). Recolonization of degraded areas is thus facilitated by the action of these vector species, and plant diversity can potentially be slowly restored (Wunderle Jr 1997; Bleher & Böhning-Gaese 2001). However, it is important to highlight that not all dispersed seeds result in recruitment (Schupp 1993). Some bird species are considered seed predators since they may destroy most of the seeds they ingest (Janzen 1971; Traveset 1998). Moreover, even if seeds arrive to a favourable site, these can be predated by insects, rodents or other species (Nepstad et al. 1996; Holl & Lulow 1997).
2 Efficient seed dispersers must be able to cover large distances after visiting forested habitats and cross degraded areas that separate forest fragments (Lenz et al. 2011). However, different frugivores may drastically differ in their dispersal ability, depending on their morphology, life history traits, flight capacity or even foraging behaviour (Spiegel & Nathan 2007). For instance, larger birds are expected to move and forage over larger areas, having greater home-ranges (Jetz et al. 2004) and holding potential for long distance dispersal (Levey 1987). In addition, different species hold different levels of dependency upon relatively undisturbed forest (Bennun et al. 1996). Forest specialists rarely visit the outside of undisturbed forests and hence offer limited dispersion services to these areas, whereas forest generalists frequently move between different habitat patches, becoming more interesting dispersers in degraded areas (Wunderle Jr 1997).
Some landscape structures play a crucial role in attracting dispersers. Seed dispersers are generally not attracted to degraded areas since these usually provide few perches for resting, and offer no protection from predators and poor foraging opportunities, having low fruit diversity and availability (Da Silva et al. 1996; Wunderle Jr 1997). This way, the effectivity of the mutualistic relation between plants and animal seed dispersers can be disrupted, as a consequence of human land-use changes that cause deforestation, forest degradation and fragmentation (Cordeiro & Howe 2003). This can further constrain the future of tropical forests, altering their community structure and dynamics (Bleher & Böhning-Gaese 2001), decreasing habitat heterogeneity and slowing ecological succession processes (Terborgh et al. 2008; Markl et al. 2012; Peña-Domene et al. 2014).
During the formation of an agricultural field, native vegetation is generally cut down and burned. However, some trees of large size are frequently left in the fields as they are more difficult to remove, provide shade to crops and sometimes hold an economical or cultural value for local human communities (Lawson 1966). These trees in degraded areas can act as important seed recruitment foci, enhancing forest succession (McDonnell & Stiles 1983; Guevara et al. 1986; Holl et al. 2000, 2013). Likewise, other landscape elements may have an equally attractive effect for dispersers and it is important to identify them to create efficient management strategies, that may use natural mechanisms to provide a faster regeneration of forests. Despite the fast rate of deforestation in the tropics, there are still large areas of degraded land that hold recovery potential, making it urgent to take management measures to restore biodiversity of these areas and, in this way, preventing the loss of important ecological functions (Lamb et al. 2005).
1.2. The sub-humid forests of Guinea-Bissau
A long history of human occupation in the African continent, has led to an alarming rate of forest loss (Poorter et al. 2004). In Guinea-Bissau, the slash-and-burn agriculture and the conversion of forest into cashew tree (Anacardium occidentale L.) orchards in the last decades have been modelling vegetation cover, leaving primary or old secondary forest restricted to residual patches (Catarino et al. 2001, 2008; Oom et al. 2009). It is in the south-western region of Guinea-Bissau, in Cantanhez National Park (CNP), that remnants of sub-humid and dry semi-deciduous forests in reasonable state of preservation can be found (Catarino et al. 2001). However, prior to the declaration of Cantanhez as a National Park in 2008, there was also a marked trend of deforestation and forest degradation with the transition of closed to open forest (Oom et al. 2009).
Historically, the forest patches in this region have been protected and conserved largely due to the presence of ethnicities that limited the access to the densest forests as well as low population densities (Temudo 2009). As the human population grows and the demand for food increases, larger areas of native forest are being converted to farmland, while previously farmed lands have shorter fallow periods
3 and natural regeneration of soil fertility is not allowed (Catarino et al. 2001). Moreover, economic instability and the “land laws” that emerged in the 1980s generated insecurity regarding land ownership, which has led to an increased pressure on the forest. Deforestation for the plantation of fruiting trees, emerged as a strategy to claim individual property rights to land (Temudo 2009; Sousa et al. 2015) and cashew trees were widely used due to their favourable characteristics, such as easy propagation, rapid growth and production of fruits with market demand (Temudo 2009). Monocultures of this species have been dramatically increasing over the years, replacing what were former patches of forest and fallow land (Oom et al. 2009; Catarino et al. 2015; Sousa et al. 2015). Although it is recognised that these orchards can potentially conserve viable seed banks for forest recovery (Sousa et al 2015), the management actions of these cultures imply the annual cutting of lower vegetation layers, which can eventually lead to exhaustion of seed banks (Catarino et al. 2015). Consequently, there is a gradual reduction in exploitation sustainability of forested ecosystems.
Identifying and understanding the natural mechanisms through which forests can naturally regenerate, namely seed dispersal by animals, are key issues to their conservation, not only for Cantanhez National Park forests, but also for West African forests in general. Up to date, in Guinea-Bissau, studies focused on frugivory have been biased towards the diet of primates (Bessa et al. 2015), however no data on seed dispersal have been collected so far. This highlights the urgency of studying the role of bird seed dispersal in native forest regeneration in these degraded areas.
1.3. Aims
Restoring forested habitats in degraded areas by natural processes, like seed dispersal, may depend on the appropriate management of areas that were once forested and were later converted into farmlands, orchards and occasionally left fallow or abandoned. To achieve this, we need to understand (1) the potential importance of seed dispersal by birds in the natural regeneration of forests in degraded areas and (2) how some manageable landscape features may promote seed dispersal by birds into these areas. In order to meet this general objective, this study encompasses three specific objectives:
(1) Determine which plant species are being dispersed from mature forest patches to degraded areas and understand if the dispersed seeds are viable and can efficiently contribute to forest regeneration; (2) Identify bird species that venture out of the forest to degraded areas and that can be potential seed dispersers;
(3) Identify the landscape elements that can attract different dispersers to degraded areas.
My ultimate aim was to integrate the results and provide recommendations for the best management practices in degraded areas of Cantanhez National Park. These recommendations should promote the presence of avian dispersers in degraded areas and potentiate natural regeneration and conservation of forests.
4
2. METHODS
2.1. Study area
The study area, Cantanhez National Park (CNP), is located in the administrative region of Tombali (Latitude 10°55’–12°45’ N and Longitude 13°37’–16°43’ W), sector of Bedanda, in south-western Guinea-Bissau, West Africa, and comprises an area of 1067.67 Km2. The climate in this region is
characterized by two distinct seasons, the dry season, which begins in November and lasts until May, and the rainy season, from the end of May or early June to October. Annual rainfall varies between 2200 and 2600 mm (Tassin 1988) and the mean annual temperature is 26.5ºC. The mean annual relative humidity varies, accordingly to the rain regime, from 69 to 79% (Catarino et al. 2008).
Although soils are poor in Guinea-Bissau, the most complex vegetation formations can be found in the ferralsols of CNP, where patches of Guinean sub-humid mature forest remains (Catarino et al. 2001). These forests are threatened and their area has been decreasing (Oom et al. 2009) mainly due to slash-and-burn agriculture and the conversion of forested areas into cashew plantations (Catarino et al. 2001). The fieldwork was conducted during the dry season, between January and March of 2018. Degraded areas or, in other words, areas that were forested in the past and were converted into farmland and orchards and sometimes abandoned, were sampled in the surrounding areas of two forest patches, namely Lauchande and Madina (Fig. 2.1 and Fig. 2.2).
Figure 2.1 - Map of the study area. Cantanhez National Park is highlighted with a grey colour, Lauchande and Madina forest
patches are highlighted in green and observation focal points and seed trap locations are identified by black and white dots, respectively.
5
2.2. Data collection
2.2.1. Reference seed collection
Numerous herbarium samples have been collected and preserved for CNP forests, yet a reference seed collection is still missing to this day. In the interest of comparing seeds of tree species fruiting at the time of the study in the forest interior, with those arriving at degraded areas, a seed reference collection was built. To this aim, paths were walked in the interior of the two forest patches to collect specimens. Along the paths, fruiting trees were located and identified five meters to each side of the path. Samples which included stems, leaves and fruits (or flowers) were carefully collected. Additionally, every individual was photographed to facilitate its future identification and to record the colour of specimens, which fades over time in the herbarium after the drying process.
Collected specimens were dried inside newspaper sheets, alternated with corrugated cardboard sheets that worked as ventilators. Then these were kept inside a metal press and tightened with straps. In order to accelerate the drying process, the press was regularly placed under sunlight or, when available, inside a cloth funnel connected to a fan heater. Bulky items, such as fleshy fruits, were also dried according to this process, after which the dried fruits were placed inside paper envelopes within plastic containers filled with silica gel (Heithaus et al. 1975).
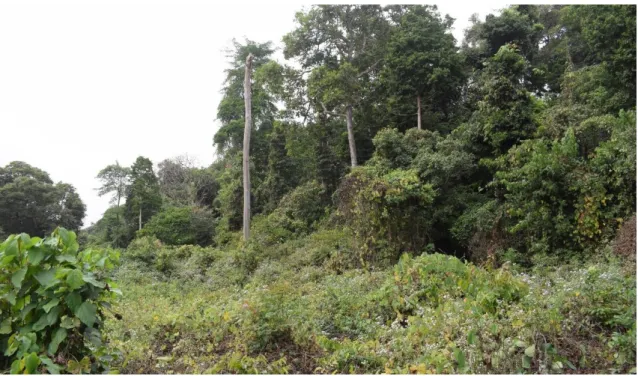
Figure 2.2 – Image representing the forest edge of Lauchande and adjacent degraded areas.
2.2.2. Seed dispersal
To determine which plant species are being dispersed from mature forest to degraded areas, seed traps were used to sample the seed rain within several degraded areas. These were located up to a maximum distance of 1km from the edge of the forested areas of Lauchande and Madina (Fig. 2.1).
Twenty-four plots were defined, equally divided between the degraded area surrounding each forested area. Each plot had approximately 50x50m and were located at different distances to the closest forest edge. Five seed traps were placed haphazardly inside each plot (Duncan & Chapman 1999; Stone et al. 2017), making a total of 120 seed traps deployed. Seed traps consisted of a polyester cloth, with a
6 collection area of 0.75m2 (1m x 0.75m)(Stone et al. 2017) and were elevated in wooden poles 0.8m tall
to reduce seed predation (Chapman & Chapman 1999).
The outlines of the forest patches of Lauchande and Madina were defined using a satellite image in QGIS software version 2.14.0, and the minimum distance from each seed trap to the nearest forest patch was measured using the Nearest Neighbour Join (NNJoin) plugin in the same software. In addition to distance, the habitat in each plot was thoroughly characterized according to vegetation structure and composition (percentages and mean height of herbaceous and shrub stratum, and percentage of bare soil), tree height and tree phenology (Gautier-Hion & Michaloud 1989; Bleher et al. 2003; Watson et al. 2004). These notes were used to develop a vegetation complexity index (check section 2.3.1).
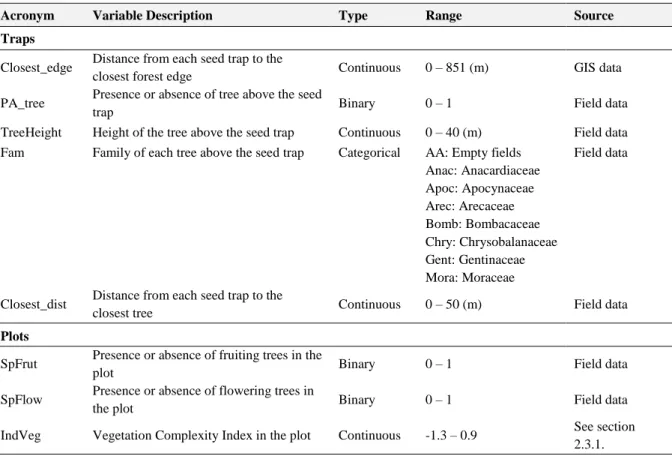
Moreover, to distinguish fruits and seeds handled by birds from those that fell from the parent plant (Gorchov et al. 1993), each seed trap was individually characterized by the presence or absence of tree canopy directly above the trap, tree species, tree height, tree phenology and distance to other trees. The description of variables used for the characterization of plots and seed traps is summarized in Table 2.1.
Table 2.1 - List of variables used for seed trap and plot characterization.
Acronym Variable Description Type Range Source
Traps
Closest_edge Distance from each seed trap to the
closest forest edge Continuous 0 – 851 (m) GIS data
PA_tree Presence or absence of tree above the seed
trap Binary 0 – 1 Field data
TreeHeight Height of the tree above the seed trap Continuous 0 – 40 (m) Field data
Fam Family of each tree above the seed trap Categorical AA: Empty fields
Anac: Anacardiaceae Apoc: Apocynaceae Arec: Arecaceae Bomb: Bombacaceae Chry: Chrysobalanaceae Gent: Gentinaceae Mora: Moraceae Field data
Closest_dist Distance from each seed trap to the
closest tree Continuous 0 – 50 (m) Field data
Plots
SpFrut Presence or absence of fruiting trees in the
plot Binary 0 – 1 Field data
SpFlow Presence or absence of flowering trees in
the plot Binary 0 – 1 Field data
IndVeg Vegetation Complexity Index in the plot Continuous -1.3 – 0.9 See section
2.3.1.
The seed traps were set up in two different periods, each one lasting between 24 and 26 days, making a total of 50 sampling days. Traps were monitored every two days, alternating between sampling areas (Duncan & Chapman 1999), to collect faecal samples and prevent seed removal by ants and rodents. All faecal samples were kept separate and stored in individually labelled porous paper envelopes, which were placed under sunlight or, when available, inside a cloth funnel connected to a fan heater, to start the drying process. Afterwards, the paper envelopes were placed inside waterproof plastic containers filled with silica gel (Heithaus et al. 1975). Seed identification in the lab, was made using the seed
7 reference collection, specific bibliography (e.g. Catarino et al. 2008) and the herbaria collections of the former Tropical Research Institute (LISC, Lisbon University).
After seed identification, germination trials were carried out on seeds collected from the faeces, to confirm their viability and regeneration potential (Compton et al. 1996). Seed surface was sterilized using a treatment of ethanol 70% for two minutes and then Sodium hypochlorite (NaOCl) 2.5% for five minutes. Seeds were rinsed with distilled water between and at the end of these treatments (A. Silva pers. comm.). The trials were carried out in a greenhouse (25ºC during the day and 18ºC during the night period) and the seeds were placed in Petri dishes with filter paper and kept moist with distilled water (Compton et al. 1996; Galindo-González et al. 2000). The fungi development was closely monitored to ensure that seeds were transferred to a new Petri dish as soon as contamination was detected, avoiding seed mortality. Seed germination dates were determined by the emergence of a rootlet (Spiegel & Nathan 2007).
2.2.3. Dispersal agents
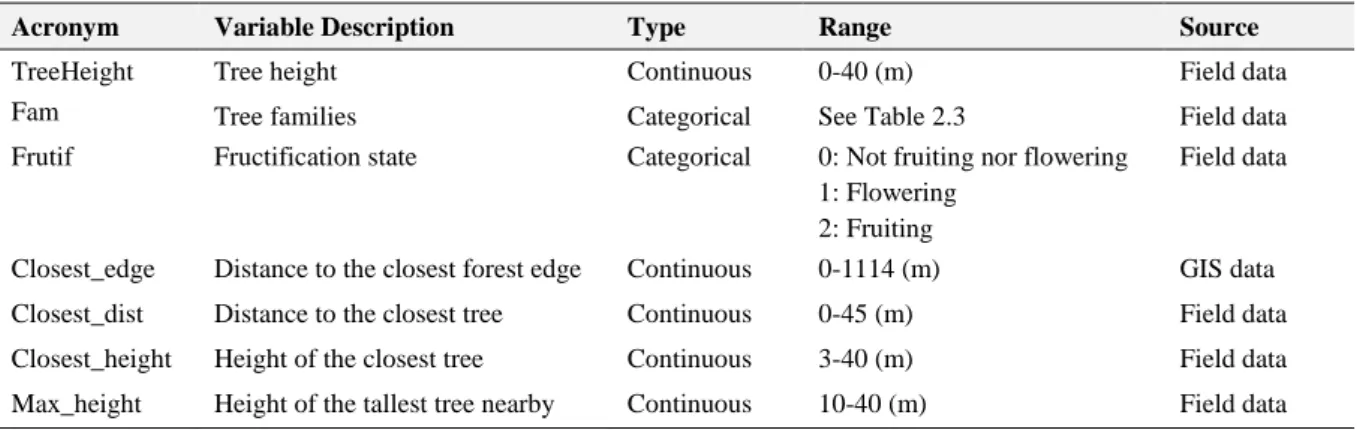
To identify bird species and quantify the frugivore activity on degraded areas, observations were made at point locations haphazardly distributed within 1km of the forest edges of Lauchande and Madina. Focal point observations were performed, rather than transects, to minimize disturbance and avoid affecting animal behaviour. To evaluate which landscape elements could potentially attract dispersers to degraded areas, a tree was chosen for observation in each focal point. For each tree, its coordinates were registered, along with the variables summarized in Table 2.2. Fifty-six isolated trees from twelve species and eight different empty fields were selected for the focal point observations, totalling 64 different locations. To simplify data analysis and reduce the total number of classes, tree species were grouped in their seven families: Anacardiaceae, Apocynaceae, Arecaceae, Bombacaceae, Chrysobalanaceae, Leguminosae (Fabaceae) – subfamily Mimosoideae and Moraceae (Tab. 2.3).
Table 2.2 - List of variables used for the characterization of focal points for the observation of potential seed dispersers.
Acronym Variable Description Type Range Source
TreeHeight Tree height Continuous 0-40 (m) Field data
Fam Tree families Categorical See Table 2.3 Field data
Frutif Fructification state Categorical 0: Not fruiting nor flowering
1: Flowering 2: Fruiting
Field data
Closest_edge Distance to the closest forest edge Continuous 0-1114 (m) GIS data
Closest_dist Distance to the closest tree Continuous 0-45 (m) Field data
Closest_height Height of the closest tree Continuous 3-40 (m) Field data
Max_height Height of the tallest tree nearby Continuous 10-40 (m) Field data
Each tree was watched at approximately the same distance by the observer, guaranteeing an unobstructed view of the tree and all birds that flew over or perched on it. Bird species (or genus), as well as group size and behaviour were recorded (Compton et al. 1996; Borrow & Demey 2014). Focal points were carried out during two distinct periods, corresponding to birds’ peaks of activity. The first period started shortly after dawn (7-11 am.) and the second period of observation comprised the three hours preceding sunset (4-7 pm.) (Chapman & Chapman 1999). Thirty minutes were spent at each
8 focal point. Birds were observed using binoculars and the point counts only started a few minutes after arrival, to minimize possible disturbance after the observer’s arrival to the site on bird behaviour. Four focal points were carried out each day and the points made during the morning period were repeated in the afternoon, totalling 149.5 hours of observations. In addition, a total of 64 different focal points was sampled and repeated throughout all sampling period (Table 2.3), between the 27th of January and
the 17th of March, aiming to follow the evolution of the flowering and fruiting state of each tree.
Table 2.3 – Tree species and families sampled during focal points and number of times each family was sampled during field
work. Vernacular names are presented in Creole. The table also summarizes species’ origin in Guinea-Bissau.
2.3. Data analysis
2.3.1. Seed dispersal
In order to evaluate which variables better explain the arrival of faecal samples to each seed trap, an analysis using Generalized Linear Mixed Models (GLMMs) with a Poisson error distribution and a log link function, was carried out. The number of seeds per seed trap was too small to carry out an analysis at this level, thus, careful considerations were made based on the spearman correlations between the number of seeds and all predictor variables, also considering the consistency of these results with the results for the faecal samples models. In addition, the relation between faecal samples or seed abundance and each tree family was evaluated using an analysis of variance (ANOVA) with a Tukey post-hoc test. The vegetation complexity index, one of the variables considered in these models, was obtained using a data ordination technique named Detrended Component Analysis (DCA), which allowed to extract patterns of variation and thus find a gradient of complexity in the data (Hill & Gauch 1980; Skowno & Bond 2003). Variables considered for this ordination analysis were the percentage of bare soil, the
Acronym Tree Family Tree Species Common
Name Vernacular Name Origin Nr of Samples AA - - Empty fields - - 19.5
Anac Anacardiaceae Anacardium occidentale
L.
Cashew tree Cadjú Introduced 29
Mangifera indica L. Mango tree Mango Introduced
Apoc Apocynaceae Alstonia boonei De Wild. Alstonia Tagara Native 14.5
Arec Arecaceae Elaeis guineensis Jacq. African Oil
Palm
Palmera Native 17
Bomb Bombacaceae Ceiba pentandra (L.)
Gaertn.
Kapok tree Poilão Native 21
Chry Chrysobalanaceae Parinari excelsa Sabine Guinea Plum Mampatás Native 12
Mimo Leguminosae (Fabaceae) – Mimosoideae Albizia adianthifolia (Schumach) W. F. Wight Flat-crown Albizia Farroba-de-lala Native 15
Mora Moraceae Antiaris toxicaria Lesch. Bark Cloth tree Pó-de-bicho Native 21.5
Ficus dicranostyla
Mildbr.
Fig tree Pó-de-leite Native
Ficus elasticoides De
Wild.
Fig tree Native
Ficus glumosa Delile Fig tree Native
9 percentage and average height of herbaceous vegetation and shrubs, the number and average height of small and medium trees and the number and average height of tall trees, which were then used to ordinate seed traps’ plots from lowest to highest vegetation complexity. The index was created choosing the eigenvalues and the axis of the resulting plot which better explained the data. In this case, a lower value of complexity index is associated with the percentage of bare soil, while a higher complexity index is linked to the average height of medium and tall trees, and to height of the tallest tree (Fig. S1.1). The DCA analysis was conducted with the “vegan” package in R software (Oksanen et al. 2018).
After verifying the data distribution of the predictor variables with a graphical analysis, variables which did not follow a normal distribution were transformed, namely distance from each seed trap to the closest forest edge (Closest_edge) and distance from each seed trap to the closest tree (Closest_dist). The transformation which performed best among these variables was the square root. A spearman correlation matrix was generated to verify the existence of collinearity (i.e. correlation >0.7) (Tabachnick & Fidell 2014) and all descriptors revealed correlation values below the established level, with the exception of presence/absence of tree above each seed trap (PA_tree) and tree height (TreeHeight) (Tab. S2.1). Tree height was chosen to be included in the models, since it contained more information.
To exclude variables with a p-value > 0.3 and reduce the number of variables in the multivariate models, a univariate model analysis was performed. For the multivariate analysis, the closest forest patch (Lauchande and Madina) and the average sampling date were used as crossed random factors. The offset parameter, used to correct the number of events of a population size estimate, was included as the number of days each seed trap was left in the field, accounting for sampling effort. An intercept of zero was forced in all models to guarantee positive fits, since the type of data considered in this study (number of faecal samples present in each seed trap) can not take negative values. Models were obtained using “lme4” package in R software (Bates et al. 2015).
The most parsimonious models were selected using Akaike’s Information Criterion corrected for small sample sizes (AICc) (Burnham & Anderson 2002). To verify if the assumptions of normality and homoscedasticity were violated, model residuals were explored using a graphical analysis with Q-Q plots. Multicollinearity of predictor variables was further investigated by computing variance inflated factors (VIF) with the “car” package in R software (Fox & Weisberg 2011). All analyses were conducted in R v3.5.1 software (R Core Team 2018).
2.3.2. Dispersal agents
To identify the landscape characteristics that can act as an element of attraction for the dispersers to visit the degraded areas, a Generalised Linear Mixed Model (GLMM) analysis was performed considering total species abundance and individual species abundance, species richness and an analysis at the guild level, grouping species with similar eco-morphological traits which are known to affect seed dispersal. Explanatory variables included in the models are summarised in Table 2.2.
Species richness was estimated by calculating the non-parametric and abundance-based Chao1 richness estimator, using EstimateS 9.1.0 (Gotelli & Colwell 2011). Given that there is not an adequate richness estimator for every situation or for specific taxa, the Chao1 richness estimator was chosen due to its performance, especially in presence of reduced sample sizes, being considered as a precise and robust estimator of minimum richness (Walther & Martin 2001; Waltert et al. 2005).
For each bird species, a general model was generated. For species with lower number of contacts two separate models were adjusted: one based on tree characteristics – tree model, and another one on the
10 landscape characteristics – landscape model. Moreover, species which still presented an insufficient number of observations to be modelled individually, were grouped in families.
The different guild levels modelled followed the classification made by Bennun et al. (1996), who gathered information concerning habitat requirements of forest birds from Eastern Africa (Kenya and Uganda). The authors classified bird species’ habitat requirements in three different levels according to the different levels of human disturbance and impact on the forest structure:
1) “Forest specialists (FF)”: species typical of the interior of undisturbed forest, which may also prevail in secondary forest, provided their ecological requirements are met. Uncommon far from forest interior and rare in non-forested areas.
2) “Forest generalists (F)”: species which are probably more common in secondary forest than in undisturbed forest, although they might also occur there. Often found in forest strips, edges and gaps.
3) “Forest visitors (f)”: species which are not entirely reliant on forests. More common in non-forested areas, but often recorded inside forests.
In this study a fourth guild was added: Non-forest bird species (Nf), which include species that are more dependent on savannah and farmland habitats but may regularly visit forest edges. This guild was not modelled, taken that 99% of the individuals present on the guild are Weavers, for which a model was obtained. Forest specialists revealed an insufficient number of individuals to analyse using GLMMs, thus, careful considerations were made based on the spearman correlations between forest specialists and different predictor variables.
Model assumptions were verified according to section 2.3.1. (Tab. S2.2). After verifying the data distribution of the predictor variables with a graphical analysis, every continuous variable was transformed with the square root, except for tree height.
GLMMs were fit with a Poisson error distribution and a log link function. The closest forest patch (Lauchande and Madina) and average sampling date were used as crossed random factors. The offset parameter was included as the number of times each focal point was sampled. An intercept of zero was also forced in all models, since the type of data considered (bird counts in each focal point) can not take negative values. Models were obtained using “lme4” package in R software (Bates et al. 2015).
Model selection and validation of the assumptions of normality and homoscedasticity were also completed following the procedure described in section 2.3.1. A thorough analysis for the detection of outliers was performed for models in which these assumptions were not respected. In the presence of outliers, new models were developed without them.
Multicollinearity of predictor variables was further investigated by computing variance inflated factors (VIF) with the “car” package in R software (Fox & Weisberg 2011). Variables with a VIF value < 10 were considered for the analysis, following the recommendations of several authors (Graham 2003; Kutner et al. 2004; Chatterjee & Hadi 2006), due to the fact that VIF values are less sensitive in the presence of categorical variables and a higher tolerance was needed. All analyses were conducted in R v3.5.1 software (R Core Team 2018).
11
3. RESULTS
3.1. Seed dispersal
In the 120 assembled seed traps, 58 had faecal samples. A total of 166 faecal samples were collected in these seed traps, 47 of which contained seeds (approximately 28%). The faecal samples that presented seeds were distributed by only 18 of the 58 seed traps, with a total of 4747 seeds. Seeds were found to belong to 12 different morphotypes, of which three taxa were identified: Ficus sp., Strombosia pustulata and Zanthoxylum sp. (Tab. 3.1). The remaining nine morphotypes were assumed to correspond to nine different plant species. Seed size ranged between 1-2mm – for Ficus sp. – and 10-12mm – for S. pustulata. When possible, seeds belonging to the same taxa of the tree above each seed trap were removed from the analysis. Thus, a total of 225 seeds, of which 73% belonged to Ficus genus, were considered for the analysis.
Table 3.1 – Abundance of plant taxa identified in faecal samples and their origin in Guinea-Bissau. Vernacular names are
presented in Creole.
Identified morphotypes Unidentified morphotypes
Ficus sp. Strombosia
pustulata Oliv. Zanthoxylum sp. 1 2 3 4 5 6 7 8 9
Number of seeds 165 2 2 5 33 10 1 2 2 1 1 1
Tree family Moraceae Olacaceae Rutaceae - - - -
Common name Fig tree - - - - - -
Vernacular name Pó-de-leite Osso-de-dari - - - -
Origin Native Native Native - - - -
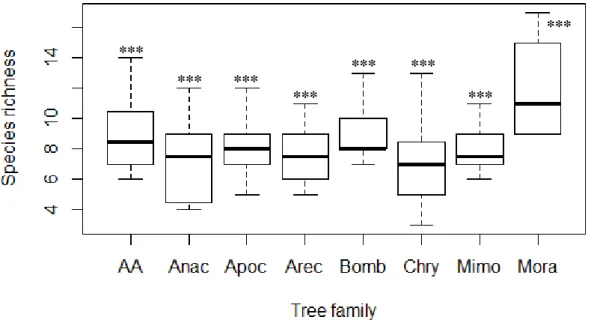
The model adjusted for the number of faecal samples revealed that distance from each seed trap to the closest forest edge, tree height above the seed trap and the index of vegetation complexity positively affected the number of faecal samples present in the traps (p < 0.01, Tab. 3.2). Concerning the main drivers of seed capture, a significant positive correlation was found between the number of captured seeds and tree height (Spearman r = 0.29) (Tab. S2.1, Fig. S2.1). Moreover,abundance of faecal samples is significantly affected by different tree families (ANOVA, Df = 7, F= 3.8, p < 0.001), with higher abundances under trees from Moraceae (Tukey’s HSD test, p = 0.002) and Bombacaceae (Tukey’s HSD test, p = 0.009) families and lower abundances in empty fields (Fig. 3.1). Seed abundance revealed no significant differences between tree families (ANOVA, Df = 7, F = 0.4, p = 0.885).
Table 3.2 – Best model for the number of faecal samples collected in the seed traps. Variables’ acronyms can be found in
Table 2.1. Results include Akaike’s Information Criterion for small samples (AICc) and variance inflated factors (VIF). Significance codes: ‘***’ p < 0.001, ‘**’ p < 0.01, ‘*’ p < 0.05.
Estimate Std. Error z value Pr (>|z|) AICc VIF
Number of faecal samples
General model 354.6
Closest_edge 0.096 0.023 4.314 1.60e-05 *** 1.011
TreeHeight 0.489 0.065 7.530 5.09e-14 *** 1.245
12
Figure 3.1 - Boxplot representing the abundance of faecal samples found in seed traps under trees from seven families and
empty fields (AA). Significant differences between tree families are represented with letters from ‘a’ to ‘c’. Tree family acronyms are described in Table 2.1.
At the end of seed germination trials, the only taxon that revealed germination signs was Ficus sp., in which small rootlets emerged within less than 15 days. After two months Strombosia pustulata and Zanthoxylum sp. revealed no signs of germination.
3.2. Dispersal agents
A total of 9341 bird visitors were observed in the 64 focal points located in degraded areas, during the sampling period. Twenty-one species or genus of potential seed dispersers were identified (Tab. 3.3), leaving a small percentage of individuals not identified (7.4%). The most common bird species were Weavers (Ploceus sp.), followed by the African Green-pigeon (Treron calvus) and Doves (Streptopelia sp). One of the identified species, the Yellow-casqued Hornbill (Ceratogymna elata), holds a global Vulnerable conservation status, according to the IUCN Red List (BirdLife International 2016).
Thirteen genus and species were grouped into six groups, according to bird families: Weavers (Ploceidae), which comprise Ploceus sp. and Ploceus cucullatus, due to the low number of weavers identified to the species level; Hornbills (Bucerotidae), including Lophoceros semifasciatus, Bycanistes fistulator and Ceratogymna elata; Turacos (Musophagidae), including Tauraco persa, Corythaeola cristata and Crinifer piscator; Bulbuls (Pycnonotidae), including Pycnonotus barbatus and Chlorocichla simplex; Glossy Starlings (Lamprotornis sp.), since not all individuals were identified with certainty to species level; Doves, which include Streptopelia sp. and a small number of individuals identified as Streptopelia semitorquata.
All the models that best summarize the roles that different intrinsic characteristics of observed trees and landscape elements have on abundance and richness of potential seed dispersers in degraded areas, are compiled in Table 3.4. Most models show a good adjustment to the data, except the models for
a B b B b B b B c B b B b B c B
13 Gypohierax angolensis and Turacos. Careful considerations should be made regarding the results for these species and family.
Table 3.3 - List of bird species identified as potential seed dispersers in the degraded areas and guild-level assignment for each
species. Guild levels were attributed based on Bennun et al. (1996) classification, described in section 2.3.2. and new classifications are marked with symbol ‘*’.
Bird Species Common name N Guild Habitat
Ploceus sp. Weavers 4274 Nf*
Treron calvus (Temminck, 1808) African Green-pigeon 1203 F
Streptopelia sp. Doves 1133 f
Pycnonotus barbatus (Desfontaine, 1789) Common Bulbul 738 f
Cinnyricinclus leucogaster (Boddaert, 1783) Violet-backed Starling 622 f
Streptopelia semitorquata Rüppell, 1837 Red-eyed Dove 165 f
Lamprotornis sp. Glossy Starlings 135 F
Turtur afer (Linnaeus, 1766) Blue-spotted Wood-dove 119 f
Lophoceros semifasciatus (Hartlaub, 1855) West African Pied Hornbill 115 F
Ploceus cucullatus (Müller, 1776) Village Weaver 36 Nf*
Gypohierax angolensis (Gmelin, 1788) Palm-nut Vulture 31 Nf*
Bycanistes fistulator (Cassin, 1852) Western Piping Hornbill 26 FF
Chlorocichla simplex (Hartlaub, 1855) Simple Greenbul 7 f*
Poicephalus senegalus (Linnaeus, 1766) Senegal Parrot 7 Nf*
Turtur tympanistria (Temminck, 1809) Tambourine Dove 7 F
Tauraco persa (Linnaeus, 1758) Green Turaco 7 FF*
Corythaeola cristata (Vieillot, 1816) Great Blue Turaco 5 FF*
Crinifer piscator (Boddaert, 1783) Western Plantain-eater 5 Nf*
Pogonornis bidentatus (Shaw, 1789) Double-toothed Barbet 5 FF*
Ceratogymna elata (Temminck, 1831) Yellow-casqued Hornbill 4 FF*
Nicator chloris (Valenciennes, 1826) Western Nicator 3 F
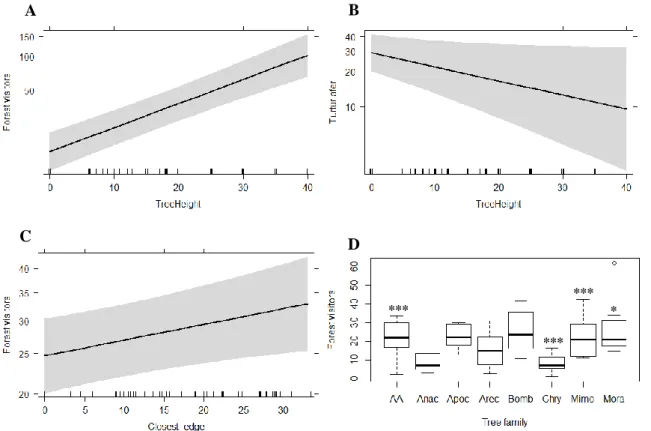
Overall, models show that tree height and distance to the closest forest edge are the most influential variables, having a significant effect on the abundance of most potential seed dispersers. Tree height had a significant positive effect in Bulbuls, Turacos, Doves and Forest visitors, and a negative effect on African Green-pigeons, Blue-spotted Wood-doves, Weavers and Forest generalists (Tab. 3.4). Distance to the closest forest edge positively affects the abundance of the total number of potential seed dispersers, Weavers, Doves and Forest visitors. On the other hand, it negatively affects the abundance of African Green-pigeons, Hornbills and Forest generalists (Tab. 3.4).
There appears to be no generalized pattern for tree families that attract most of the potential seed dispersers, however they seem to be less attracted by trees of Anacardiaceae and Chrysobalanaceae families (Tab. 3.4). Notwithstanding, the model for species richness seems to highlight a higher species richness in trees belonging to the Moraceae family (Tab. 3.4, Fig. 3.2).
Weavers are the predominant species of the guild Non-forest bird species, so both models show a positive relation with distance to the closest forest edge (p < 0.001) and height of the nearby tallest tree (p < 0.001) (Tab. 3.3, Fig. 3.3A and 3.3B). In addition, their abundance revealed a negative relation with tree height (p < 0.05, Tab. 3.4, Fig. 3.3C), being more abundant in trees belonging to Arecaceae family. Trees from Anacardiaceae and Chrysobalanaceae families seem to have a less positive impact on the abundance of these individuals (Tab. 3.4, Fig. 3.3D).
14
Figure 3.2 - Boxplot representing species richness of potential seed dispersers in seven tree families and empty fields (AA).
Tree family acronyms are described in Table 2.3. Significance codes: ‘***’ p < 0.001, ‘**’ p < 0.01, ‘*’ p < 0.05.
Figure 3.3 - Plots of the effect of distance to the closest forest edge (A), height of the tallest tree nearby (B) and tree height (C)
on Weaver’s abundance, with 95% confidence intervals. Bird abundance is represented with a logarithmic scale. Boxplot D shows the effect of different tree families on Weaver’s abundance. Tree family acronyms are described in Table 2.3. Significance codes: ‘***’ p < 0.001, ‘**’ p < 0.01, ‘*’ p < 0.05. B B C C D D A B *** B *** B *** B *** B *** B *** B *** B *** B *** B *** B *** B *** B *** B *** B *** B *** B
15 Forest visitors, such as Doves and Bulbuls, are positively affected by tree height (p < 0.001, p <0.01 and p < 0.001, respectively) (Tab. 3.4, Fig. 3.4A) and height of the closest tree (p < 0.001, Tab. 3.4). Conversely, Blue-spotted Wood-doves (Turtur afer) show a negative relation with tree height (p < 0.05, Tab. 3.4, Fig. 3.4B). Species belonging to this guild are more common in empty fields and in the presence of trees from Mimosoideae subfamily (Tab.3.4, Fig. 3.4D). Trees from the Chrysobalanaceae family seem to have a less positive impact on forest visitor’s abundance (Tab. 3.4, Fig. 3.4C). Forest visitors also revealed a positive relation with distance to the closest forest edge (p < 0.05, Tab. 3.4, Fig. 3.4C) and distance to the closest tree (p < 0.01, Tab. 3.4).
Figure 3.4 - Plots of the effect of tree height on Forest visitors’ (A) and Blue-spotted Wood-doves’ (B) abundance, with 95%
confidence intervals. Bird abundance is represented with a logarithmic scale. Plot C shows the effect of distance to the closest forest edge and Boxplot D the effect of tree families on Forest visitors’ abundance. Tree family acronyms are described in Table 2.3. Significance codes: ‘***’ p < 0.001, ‘**’ p < 0.01, ‘*’ p < 0.05.
Forest generalists, such as the African Green-pigeon, show a negative relation with distance to the closest forest edge (p < 0.001, Tab. 3.4, Fig. 3.5A). Glossy starlings, on the other hand, seem to be more abundant further away from forest edges (p < 0.001, Tab. 3.4). Tree height revealed to affect species in this guild negatively (p < 0.01, Tab. 3.4, Fig. 3.5B). Moreover, these species appear to be positively affected by trees from Apocynaceae, Chrysobalanaceae and Moraceae families (Tab. 3.4, Fig. 3.5C). Turacos and Hornbills seem to be, respectively, positively driven by an increase in tree height (p < 0.01) and negatively by distance to the closest forest edge (p < 0.001) (Tab. 3.4, Fig. 3.6A), being more abundant close to forest patches. Even though it was not possible to obtain models for Forest specialists, which comprise two turaco species, two hornbill species and one African Barbet species (Tab. 3.4), results from Spearman correlations show that all height variables (tree height (Spearman r = 0.39), height of the closest tree (Spearman r = 0.31) and height of the tallest and closest tree (Spearman r = 0.28))
C C B B D D A B *** B *** B *** B * B