INTRODUCTION
The European mole (Talpa euro p a e a L., 1758) and the Iberian mole (T. occidentalis Cabrera, 1907) are two mor-phologically similar fossorial mammals from the order Insectivora. The former occurs throughout most of Europe, whereas the latter is endemic to the Iberian Peninsula (SW Europe). In Spain, the European mole is present in the north-central and north-eastern regions, while the Iberian mole lacks in the north-east and is especially common in the north-western quadrant (Palomo & Gisbert 2002). T h e two species’ ranges partially overlap in northern Spain, in a sympatry area that reaches 14 administrative provinces. Soil quality and consistence and prey availability are con-sidered the main local factors conditioning mole occur-rence (MacDonald & Barrett 1993, Palomo & Gisbert 2002). The subterranean environments inhabited by moles are microclimatically stable, highly specialized and low in productivity (Elton & Miller 1954, Nevo 1979). Conse-q u e n t l y, food availability could affect the species’ s p a t i a l distribution and abundance (Nevo 1979). Moles feed essentially on earthworms, but also on larvae of beetles, flies, and other insects, and on adult beetles, myriapods, molluscs, and occasionally other small prey (Stone 1986, Castién & Gosálbez 1995, Beolchini & Loy 2004). Many of these species are intermediate hosts of heteroxenous par-asites that use moles as their definitive host, so the distribu-tion and abundance of these prey condidistribu-tion that of these
parasites and, consequently, total parasite species richness. Until the present work, only faunistic and ecological data were provided about the helminths of Ta l p a s p e c i e s ; no anterior works deal with aspects such as patterns of distribution, which have been studied in other mammal parasite species (Feliu et al. 1997, Goüy de Bellocq et al. 2002, 2003). The aims of the present work were (1) to determine the helminth parasite species richness (SR) of Talpa euro p a e a and T. occidentalis, both separately and a l t o g e t h e r, in a set of sampled provinces of peninsular Spain; (2) to assess the effects of sampling effort and environmental factors on the species richness observed; and (3) to predict mole parasite diversity in non-sampled provinces where the host species is present.
METHODS
The study area, peninsular Spain, covers approximately 4 93 000 km2, which is nearly 85% of the Iberian Peninsula. It
has heterogeneous climate and orography, and is relatively iso-lated from continental Europe by the Pyrenees, which cross the isthmus that links the Peninsula to the continent, thus restricting biotic and abiotic interchange (Bosque & Vilà 1989). Peninsular Spain is divided into 47 administrative provinces which have been used successfully as operative territorial units in a number of previous biogeographical studies (e.g. Barbosa et al. 2 0 0 1 , Márquez et al. 2001, Real et al. 2003).
G E O G R A P H I C A L PATTERNS OF THE SPECIES RICHNESS OF
HELMINTH PARASITES OF MOLES (TA L PA S P P.) IN SPA I N :
S E PA R ATING THE EFFECT OF SAMPLING EFFORT FROM T H O S E
OF OTHER CONDITIONING FA C TO R S
A. RIBAS
1*, A. M. BARBOSA
2, J. C. CASANOVA
1, R. REAL
2, C. FELIU
1, J. M. VARGAS
2 1Unitat de Parasitologia, Departament de Microbiologia i Parasitologia Sanitàries, Facultat de Farmàcia,Universitat de Barcelona Avda, Diagonal s/n, 08028 Barcelona, Spain
2Laboratorio de Biogeografía, Diversidad y Conservación, Departamento de Biología Animal,
Facultad de Ciencias, Universidad de Málaga, 29071 Málaga, Spain *Corresponding author: Alexis Ribas, e-mail: [email protected]
A B S T R A C T. – We analysed the viscera of 534 moles (Ta l p a spp.) from 30 of the 47 provinces of peninsular Spain, including 255 individuals of T. europaea from eight provinces, 154 individ-uals of T. occidentalis from 20 provinces, and 125 unidentified Ta l p a individindivid-uals from two provinces. We identified their helminth parasites and determined parasite species richness. We related parasite species richness with sampling effort using both a linear and a logarithmic func-tion. We then performed stepwise linear regressions to predict mole parasite species richness from a small set of selected predictor variables that included sampling effort. We applied the resulting models to forecast T. euro p a e a, T. occidentalis, and Ta l p a spp. parasite species rich-ness in all provinces with recorded host presence, assuming different levels of sampling eff o r t . F i n a l l y, we used partial regression analysis to partition the variation explained by each of the selected variables in the models. We found that mole parasite species richness is strongly condi-tioned by sampling effort, but that other factors such as cropland area and environmental distur-bance have significant independent effects.
SPECIES RICHNESS TALPA SPP. HELMINTH PARASITES SPAIN GEOGRAPHICAL PATTERNS SAMPLING EFFORT
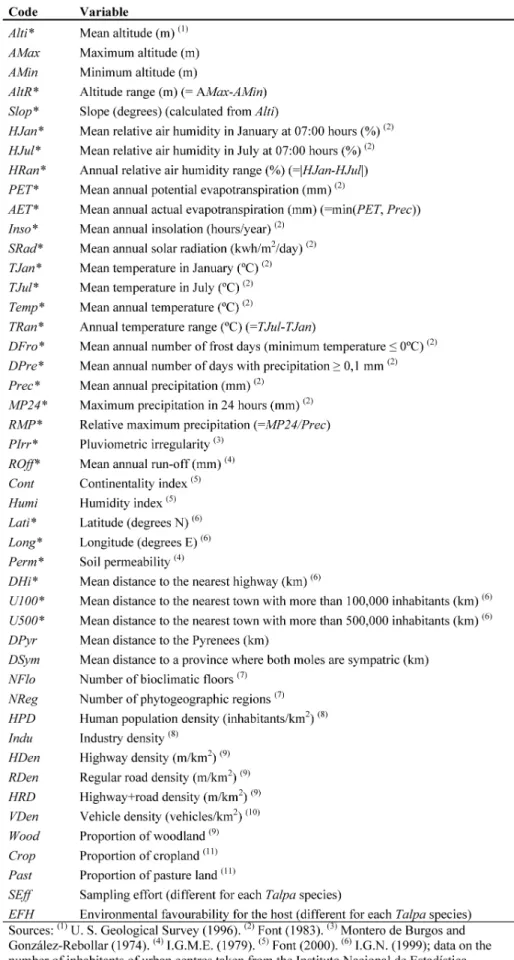
Table I. – Variables used to model mole parasite species richness in the Spanish provinces. Marked with an asterisk (*) are the variables available on UTM 10x10-km squares used to model T.
e u ro p a e a and T. occidentalis
distribution and obtain environ-mental favourability for the host (EFH).
Between 1976 and 2002, we obtained 534 moles from 30 Spanish provinces, captured with specific traps for fossorial mammals. Of these, 255 were T. europaea, 154 were T. occiden
-t a l i s, and 125 belonged -to ei-ther one of -these species bu-t
specif-ic identifspecif-ication could not be achieved. We included them to increase the amount of data in the analysis of both Talpa species t o g e t h e r. We checked the viscera of each individual for para-sites, recovered and isolated all helminths found, and stored them in 70 % ethanol. For microscopical study, plathelmintes were stained in Semichon acetocarmine and mounted in Canada balsam, and nematodes were cleared in Amann lactophenol. We determined helminth parasite species richness (number of species) for T. europaea, T. occidentalis, and for Talpa spp. alto-gether, in each sampled province.
We recorded 46 variables chosen on the basis of their rela-tion with factors potentially affecting parasite distriburela-tion and, c o n s e q u e n t l y, species richness (Barbosa et al. 2005), namely sampling effort, topography (a surrogate for a series of environ-mental variables), climate, soil permeability (related with water availability), human activity, distance to the area where the two host species are sympatric, and environmental favourability for the host (Table I). Our aim was not to find the direct causes of species richness (SR) variation, but rather to make an explorato-ry analysis and detect relationships between SR and a series of variables that are correlated with more proximate causal factors. Statistical analyses were carried out using SPSS 11.5.
Environmental favourability for each mole species was cal-culated on UTM 10x10-km squares using the favourability function described by Real et al. (in press), the variables marked with an asterisk in Table I, and presence/absence data taken from Palomo & Gisbert (2002). We then calculated mean envi-ronmental favourability for each mole species in each province. Environmental favourability for both moles together was obtained by calculating the complementary of the simultaneous unfavourability for T. euro p a e a and T. occidentalis, using the following formula: FT. s p p .= 1 - [ ( 1 - FT. e u r.) x (1 - FT. o c c .)]. A l l other variables were obtained as explained by Barbosa et al. (2005). Geographical coordinates (latitude and longitude) were included to take into account spatial autocorrelation in species
distributions (see Legendre 1993, Barbosa et al. 2003). T h e variables whose distributions were significantly different from normal (p < 0.01) according to Kolmogorov-Smirnov’s test were excluded from subsequent analyses.
We assessed the relationship between parasite SR and sam-pling effort for each species, by regressing SR on samsam-pling e ffort and on its natural logarithm (LN) separately. When the logarithmic function was more significant than the linear func-tion, we used LN of sampling effort (instead of plain sampling e ffort) in subsequent analyses. We then performed stepwise lin-ear regressions to find subsets of variables that account for the variation in the parasite SR of T. euro p a e a, T. occidentalis a n d
Ta l p a spp. This procedure reduces the problem of collinearity
among variables, as it selects only those with the most signifi-cant contributions. We used the resulting models to predict para-site SR in all provinces with recorded presence of the host (taken from Palomo & Gisbert 2002 and from our own data), assuming constant sampling efforts of 30 and of 100 host indi-viduals analysed per province.
Interactions between factors often result in an overlaid eff e c t in space, so the sum of the amounts of variation explained by each variable included in a multiple regression model is usually d i fferent from the total amount explained by the whole model (Sokal & Rohlf 1981). Besides, it is interesting to discern which part of the variation in SR is explained exclusively by each of the variables included in the model, and how these variables act together affecting SR. Consequently, we performed a variation partitioning (Borcard et al. 1992, Legendre & Legendre 1998), a procedure useful to specify how much of the variation explained by each of the variables corresponds to its pure effect, and which proportions are attributable to the common effects of dif-ferent variables.
RESULTS
Three variables (NFlo, HPD and Indu) failed the nor-mality test and were thus excluded from subsequent anal-yses. The favourability (F) functions obtained for T.
Fig. 1. – Environmental favourability for the European mole (Talpa euro p a e a) and the Iberian mole (T. occidentalis) on the UTM 10x10-km squares of peninsular Spain, according to the favourability functions obtained.
e u ro p a e a and T. occidentalis were the following (vari-ables are placed in the same order they entered the mod-els):
FT. e u r.= 1 - (1 / (1 + EXP(-30.029 - 0.0028 I n s o + 0.77
L o n g - 0.35 P I rr + 0.024 D F ro - 0.022 U 1 0 0 + 0.011 U 5 0 0 + 0.013 A re a + 0.060 H J a n + 0.017 D P re + 0.017 SRad - 0.00075 Alti + 0.68 Lati - LN(325 / 4842)))).
FT. o c c .= 1 - (1 / (1 + EXP(13.20 + 0.020 D P re - 0.040
H J u l - 0.32 L o n g + 0.59 P e r m + 0.0013 A l t R - 0.00085 P re c + 0.0099 D H i - 0.0063 U 1 0 0 - 0.22 L a t i - 0.0073 E T P - 0.25 T R a n + 0.0089 A re a + 0.048 H R a n + 0.0070 DFro - LN(713 / 4454)))).
The environmental favourability maps for T. euro p a e a and T. occidentalis are shown in Fig. 1.
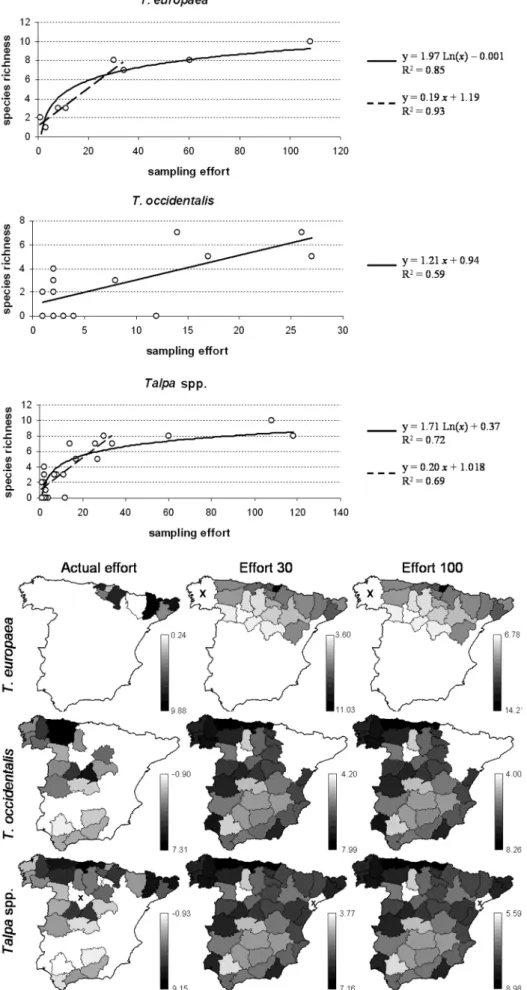
We found 12 helminth species parasitizing T. europaea and 14 species parasitizing T. occidentalis, in a total of 18 helminth species (Table II). By province, T. europaea parasite SR varied between 1 and 10, and that of T. occiden -t a l i s be-tween 0 and 7. The maximum provincial sampling e ffort was 108 for T. euro p a e a, 27 for T. occidentalis, and 118 for both species together (Fig. 2).
Regression analysis of SR on sampling effort revealed that their relationship was logarithmic for T. euro p a e a and Ta l p a spp., but linear for T. occidentalis (Fig. 3). T h e logarithmic functions obtained suggest that, up to about 30 moles analysed per province, the relationship between sampling effort and SR is linear, as occurs with T. occi
-d e n t a l i s, for which the maximum effort was 27. Regres-sion analysis using only the provinces with sampling e ffort lower than 35 for T. euro p a e a (n = 6) and for Ta l p a spp. (n = 27) confirmed that, within this range of sam-pling effort, its relationship with parasite SR is linear (Fig. 3) and then it tends to asymptotize. We may reason-ably expect that the relationship between parasite SR and sampling effort would also asymptotize for T. occidental -i s w-ith h-igher values of the latter. Consequently, we used a logarithmic instead of a linear function to predict the parasite SR expected for T. occidentalis with a sampling effort of 100 moles per province.
Stepwise linear regressions of T. euro p a e a, T. occiden -t a l i s and Ta l p a spp. parasi-te SR (TESR, TOSR and T S R , respectively) on the 43 normally distributed variables yielded the following equations:
TESR = -8.27 + 2.64 LN(SEff) + 0.039 MP24; (R2= 0.97, F = 91.50, p < 0.001, N = 8) (1)
TOSR = 3.034 + 0.17 SEff - 5.18 Crop;
(R2= 0.70, F = 20.22, p < 0.001, N = 20) (2)
TSR = 2.094 + 1.51 LN(SEff) - 4.55 Crop;
(R2= 0.78, F = 47.95, p < 0.001, N = 30) (3)
The model built for T. occidentalis with LN(S E f f), to extrapolate to non-sampled provinces assuming a sam-pling effort of 100 analysed individuals, was the follow-ing: TOSRLN = 2.99 + 1.18 LN(S E f f) - 5.82 C ro p (R2= 0.67, F = 17.079, p < 0.001).
Table II. – Helminth parasite species found in Talpa euro p a e a ( T.e.) and in T. occidentalis (T.o.). Presences are marked with an “x”.
The SR values predicted by these models in the provinces sampled in each case, considering the actual sampling effort applied, and in all provinces where the host species is present assuming constant sampling e fforts of 30 and of 100 analysed individuals per province, are represented in Fig. 4. The results of varia-tion partivaria-tioning are schematized in Fig. 5.
DISCUSSION
Unlike other statistical methods such as path analysis that are based on the building of testing hypotheses, step-wise procedures are used to select subsets of relevant variables without assuming any a priori hypotheses. Any-w a y, Any-we try to interpret a posteriori the variables that are included in the models.
Several authors have shown that the estimation of SR can be strongly conditioned by sampling effort (Guégan & Kennedy 1996, Feliu et al. 1997, Poulin 1997, 1998). Our results corroborate the importance of sampling eff o r t for the SR encountered, but we identify other factors that have significant contributions to the models. Interesting-l y, the resuInteresting-lts suggest that, with more than 30 host speci-mens analysed, the obtained parasite SR is much less affected by effort (Fig. 3).
Stepwise regression showed that a combination of sampling effort and maximum precipitation in 24 hours accounts for 97% of the observed variation in T. europaea parasite SR (see R2of equation 1). The maximum
precipi-tation in 24 hours is a measure of flooding intensity. Floods are a type of environmental disturbance and have been previously proposed as a controller of SR (e.g. Real et al. 1993). The variation partitioning for T. euro p a e a Fig. 2. – Sampling effort and the obtained helminth parasite species richness of moles, both separately and together, in the Spanish provinces sampled. Enclosed non-sampled provinces (no data) are marked with an “x”. Note that the grey scale varies among provinces.
Fig. 3. – Relationships between mole parasite species richness and sampling effort (number of moles analysed) in the provinces of peninsular Spain. Linear regressions were obtained for the provinces with less than 35 host individuals sampled (see text for details).
Fig. 4. – Predicted helminth parasite species richness of moles, both separately and t o g e t h e r, considering the actual values of sampling e ffort employed (in the sam-pled provinces) and assuming a fixed effort of 30 and of 100 sampled individuals (for the provinces with recorded host presence). The “x” marks provinces with no data (host not present). Note that the greyscale varies among maps.
showed that sampling effort alone accounts for most (nearly 62%) of the variation in parasite SR, but that an additional 12 % is justified exclusively by the diff e r e n c e s in flooding intensity (Fig. 5). Besides, a supplementary 23 % of the variance is due to both factors indistinguish-a b l y, which meindistinguish-ans thindistinguish-at the provinces where sindistinguish-ampling e ffort was higher also have more intense floods (which, according to equation 1, has a positive effect on parasite species richness), thus having higher parasite SR because of these two factors acting together.
For T. occidentalis, sampling effort and cropland area were included in a model that explains 70 % of SR varia-tion, with croplands having a negative effect on parasite SR (equation 2). In croplands, the abundance and diversi-ty of arthropods and terrestrial gastropods that act as intermediate hosts for the majority of Capillarinae species, I t y o g o n i m u s spp., S. talpae, M. filamentosa, Moniliformis sp., and S. occidentalis, could be expectedly lower than in undisturbed, more complex habitats. T h e use of pesticides in agriculture could be one of the con-tributors to this effect. Sampling effort alone explains nearly one third of the variation, but an additional 11 % is explained independently by the differences in cropland proportion (Fig. 5). Since this variable has a negative e ffect on T. occidentalis parasite SR (equation 2) and is also negatively correlated with sampling effort ( r = -0.409, p = 0.07, n = 20), the combined effect of cropland and sampling effort on SR is synergic and they explain part of the variation together.
For Talpa spp. altogether, sampling effort and cropland area account for 78 % of SR variation (equation 3). More than 24 % of this variation is accounted for by sampling e ffort, and cropland area accounts for another 6% inde-pendently (Fig. 5). Almost 48 % of the variation is due to these two factors indistinguishably, which means that
provinces with greater proportion of cropland (which affects SR negatively according to equation 3) have also been less sampled, so SR is affected by the simultaneous action of both factors.
Sampling effort could also be controlled using diversity indices such as Shannon’s and S i m p s o n ’s, which can be less affected by eff o r t (see, for example, Barbosa et al. 2005). The use of estimators may avoid some spurious correla-tions such as the fact that it is easier to trap host individuals living in high density, and that high density also may favour the accumulation of parasite species (Guégan & Kennedy 1996). H o w e v e r, we have included environmental favourability for the host species as an indirect measure of abundance (Araújo & Wi l l i a m s 2000), and it was not selected as a significant contributor to the models.
At constant sampling effort values, the maxi-mum number of parasite species predicted was higher for T. euro p a e a (up to 11 species per province with 30 sampled individuals, and up to 14 with 100 individuals) than for T. occidentalis (up to 8 species in both cases) (Fig. 4). However, the high number of helminth species predicted for T. e u ro p a e a in the province of Guipúzcoa (central north) is likely biased, since only one individual from this province was anal-ysed and it held two different parasite species. This prob-ably (but not necessarily) exacerbated the effect of sam-pling effort on the predictions for T. europaea.
Parasite SR of T. euro p a e a and T. occidentalis seem to be controlled by different environmental factors and show different geographical trends. However, the joint model for the parasite SR of both species, which includ-ed 125 additional specimens from the provinces of Cantabria and Burgos (N Spain), adds predictive power to the T. occidentalis model (the one with the greatest number of provinces analysed) and has a considerably higher F value (see equations 2 and 3). This seems to indicate that cropland may also have an effect on the par-asite SR of T. eauro p a e a that is not revealed by the few provinces analysed for this species. In addition, the mean percentage of cropland area in the provinces analyzed for T. euro p a e a (21.6%) was significantly lower than in those analyzed for T. occidentalis (34.4%) (t = -2.13, p < 0.05); there might be a minimum threshold of cropland surface from which its effect on parasite SR could be n o t e d .
AC K N O W L E D G E M E N T S- We thank Alba Estrada for assistance
with data management, and all the people involved in sample collection and laboratory analyses. This work was partially fun-ded by projects AIRE-CTP2003-4 (Generalitat de Catalunya) and REN 2003-02471 (Ministerio de Ciencia y Tecnología). A M B is supported by doctoral grant SFRH/BD/4601/2001 (Fun-dação para a Ciência e a Tecnologia, Portugal).
Fig. 5. – Results of the variance partitioning procedure for T. euro p a e a , T.
o c c i d e n t a l i s, and Ta l p a spp. parasite species richness. Values in the
dia-grams are the percentages of the variation in species richness attributable to the pure effect of each of the variables included in the corresponding regression model, and to their common effects. U V: percentage of unex-plained variation. Variable codes as in Table I.
REFERENCES
Anderson RC 2000. Nematode parasites of vertebrates: their development and transmission. Cabi.
Araújo MB, Williams PH 2000. Selecting areas for species per-sistence using occurrence data. Biol Conserv 96(3): 331-345. Barbosa AM, Real R, Márquez AL, Rendón MA 2001. Spatial, environmental and human influences on the distribution of otter (Lutra lutra) in the Spanish provinces. Divers Distrib 7: 137-144.
Barbosa AM, Real R, Olivero J, Va rgas JM 2003. Otter (L u t r a
lutra) distribution modeling at two resolution scales suited to
conservation planning in the Iberian Peninsula. Biol Conserv 114: 377-387.
Beolchini F, Loy A 2004. Diet of syntopic Talpa ro m a n a a n d
Talpa europaea in central Italy. Mamm Biol 69: 140-144.
Barbosa AM, Segovia JM, Va rgas JM, Torres J, Real R, Miquel J 2005. Predictors of red fox (Vulpes vulpes) helminth para-site diversity in the provinces of Spain. Wildl Biol Pract 1: 3-14.
Borcard D, Legendre P, Drapeau P 1992. Partialling out the spa-tial component of ecological variation. E c o l o g y 73: 1045-1055.
Bosque J, Vilà J 1989. Geografía de España. Editorial Planeta. Castién E, Gosálbez J 1995. Caractérisation de la niche
trophique de Talpa euro p a e a Linnaeus 1758 dans les Pyrénées occidentales (nord de la péninsule Ibérique). M a m
-malia 59: 43-50.
Dirección General de Tráfico 1996. Anuario estadístico general 1996. D.G.T., Ministerio del Interior, Madrid.
Elton C, Miller RS 1954. The ecological survey of animal com-munities: with a practical system of classifying habitats by structural characters. J Ecol 42: 460-496.
Feliu C, Renaud F, Catzeflis F, Hugot JP, Durand P, Morand S 1997. A comparative analysis of parasite species richness of Iberian rodents. Parasitology 115: 453-66.
Font I 1983. Atlas Climático de España. Inst Nacion Meteo-rología, Madrid.
Font I 2000. Climatología de España y Portugal. 2nded. Ed Univ
Salamanca, Salamanca.
Goüy de Bellocq J, Morand S, Feliu C 2002. Patterns of parasite species richness of western Palaeartic: micro-mammals: island effects. Ecography 25: 173-183.
Goüy de Bellocq J, Sara M, Casanova JC, Feliu C, Morand S 2003. A comparison of the structure of helminth communi-ties in the woodmouse, Apodemus sylvaticus, on islands of western Mediterranean and continental Europe. P a r a s i t o l
Res 90: 64-70.
Guégan JF, Kennedy CR 1996. Parasite richness/sampling e ffort/host range: the fancy threepiece jigsaw puzzle. P a r a
-sitol Today 12: 367-369.
I G M E 1979. Mapa hidrogeológico Nacional. Explicación de los mapas de lluvia útil, de reconocimiento hidrogeológico y de síntesis de los sistemas acuíferos, 2n ded. Inst Geológico y
Minero de España, Madrid.
I G N 1999. Mapa de carreteras. Península Ibérica, Baleares y Canarias. Instituto Geográfico Nacional / Ministerio de Fomento, Madrid.
Instituto Nacional de Estadística 1996. Anuario Estadístico de España, año 1995. I N E, Madrid.
Instituto Nacional de Estadística 1999. Anuario Estadístico de España, año 1998. I N E, Madrid.
Instituto Nacional de Estadística 1999. Población de hecho. I n Demografía y población. http://www.ine.es. Cited 19 Oct 1999.
Instituto Nacional de Estadística, 1999. Encuesta industrial de empresas. I n Industria y construcción. http://www. i n e . e s . Cited 19 Oct 1999.
Instituto Nacional de Estadística, 1999. Padrón municipal: cifras oficiales de población desde 1996. I n Cifras de población. http://www.ine.es. Cited 15 Jul 1999.
Jourdane J 1977. Ecologie du développement et de la transmis-sion des Plathelminthes parasites de Soricidae pyrénéens.
Mém Mus Natl Hist Nat Zool 103: 1-171.
L a fferty KD, Kuris AM 1999. How environmental stress aff e c t s the impacts of parasites. Limnol Oceanogr 44: 925-931. L a n d s b e rg JH, Blakesley BA, Reese RO, McRae G, Forstchen
PR 1998. Parasites of fish as indicators of environmental stress. Environ Monit Assess 51: 211-232.
Legendre P 1993. Spatial autocorrelation: trouble or new paradigm? Ecology 74: 1659-1673.
Legendre P, Legendre L 1998. Numerical ecology. 2n d e d .
Developments in Environmental Modelling 20. Elsevier. MacDonald D, Barrett P 1993. Mammals of Britain & Europe.
Collins Field Guide. Harper Collins.
Márquez AL, Real R, Va rgas JM 2001. Methods for comparison of biotic regionalizations: the case of pteridophytes in the Iberian Peninsula. Ecography 24: 659-670.
Montero de Burgos JL, González-Rebollar JL 1974. Diagramas bioclimáticos. ICONA, Madrid.
Nevo E 1979. Adaptative convergence and divergence of sub-terranean mammals. Annu Rev Eco Syst 10: 269-308. Palomo LJ, Gisbert J 2002. Atlas de los mamíferos terrestres de
España. Dir General Conserv Natural-SECEM-SECEMU. Poulin R 1997. Species richness of parasite assemblages:
evolu-tion and patterns. Annu Rev Ecol Syst 28: 341-358.
Poulin R 1998. Comparison of three estimators of species rich-ness in parasite component communities. J Parasitol 8 4 : 485-490.
Real R, Barbosa AM, Porras D, Kin MS, Márquez AL, Guerrero JC, Palomo LJ, Justo ER, Va rgas M 2003. Relative impor-tance of environment, human activity and spatial situation in determining the distribution of terrestrial mammal diversity in Argentina. J Biogeogr 30: 939-947.
Real R, Va rgas JM, Antúnez A 1993. Environmental influences on local amphibian diversity: the role of floods on river basins. Biodivers Conserv 2: 376-399.
Real R, Barbosa AM, Va rgas JM in press. Obtaining environmental favourability functions from logistic regression. E n v
-iron Ecol Stat.
Rivas-Martínez S 1985 Biogeografía y vegetación. RACEFN, Madrid.
Sokal RR, Rohlf FJ 1981. Biometry. WH Freeman and Compa-ny.
U S Geological Survey 1996. GTOPO30. In Land Processes Distributed Active Archive Center (LP DAAC), EROS Data C e n t e r. http://edcdaac.usgs.gov/gtopo30/gtopo30.asp. Cited 22 Sept 1999.
Yamaguti S 1975. A synoptical review of the life histories of digenetic trematodes of vertebrates. Keigaku publishing.
Received June 15, 2005 Accepted November 21, 2005