UNIVERSIDADE DE LISBOA
FACULDADE DE CIÊNCIAS
Departamento de Biologia Vegetal
Topoisomerase-II mediated DNA damage: role
of BRCA1 and other chromatin structure
regulators
Inês Teles Alves
Mestrado em Biologia Molecular Humana
UNIVERSIDADE DE LISBOA
FACULDADE DE CIÊNCIAS
Departamento de Biologia Vegetal
Topoisomerase-II mediated DNA damage: role
of BRCA1 and other chromatin structure
regulators
Inês Teles Alves
Dissertação sob orientação científica de: - Dr. João António Augusto Ferreira
(Professor associado da Faculdade de Medicina, Universidade de Lisboa)
- Dr. Júlio António Bargão Duarte
(Professor associado da Faculdade de Ciências, Universidade de Lisboa)
Mestrado em Biologia Molecular Humana
Table of contents:
I. LIST OF FIGURES: ... I
II. LIST OF DIAGRAMS AND TABLES: ... IV
III. LIST OF ABBREVIATIONS: ... V
IV. ACKNOWLEDGMENTS... VII
V. ABSTRACT:... IX
VI. RESUMO:... X
VII. RESUMO ALARGADO: ... XI
VIII. KEYWORDS: ...XIV
IX. PALAVRAS-CHAVE: ...XV
I) INTRODUCTION:... - 1 -
II) OBJECTIVES: ... - 6 -
III) MATERIALS AND METHODS:... - 7 -
i) Cell culture: ... 7
ii) Drugs, chemicals and antibodies:... 7
iii) Transfection of small hairpin RNA ... 8
iv) Western blotting ... 8
v) Immunolabeling procedures: ... 9
vi) The MTT assay ... 10
vii) Clonogenic assay ... 10
viii) Flow citometry assay:... 10
-IV) RESULTS: ... - 11 -
i) Cell line characterization: ... 11
ii) MTT cytotoxicity assay:... 15
iii) Clonogenic assay, the gold standard of cell sensitivity assays:... 17
-iv) BRCA1 plays a role in triggering the senescent cellular outcome following exposure to Topoisomerase II poisons:... 19
-v) Time course analysis of the effect of TOP2 and TOP1 drugs in cell cycle distribution and cellular DNA content:... 21
a) Etoposide induces a subtle increase in the cellular DNA content:... 21
-b) BRCA1 knock-down increases the number of cells with high DNA contents after exposure to Doxorubicin... 23
-vi) The amount of H2A.X lesions is independent of the cell cycle phase at which cells were exposed to Etoposide: ... 26
-vii) Etoposide treatment causes a decrease in histone H3 K9 tri-methylation in addition to an increase in heterochromatin protein 1α: ... 28
-V) CONCLUSION ... - 29 -
X. REFERENCES: ... I
I
I. List of figures:
Figure 1: Catalytic mechanism of type II DNA topoisomerases [58]...v Figure 2: Schematic illustration of the DNA damage response [59]. Either ATM or ATR can activate signal
transduction pathways, which respond to DSBs or to single-stranded regions respectively. The signalling pathways involve mediator proteins that amplify the signal (MDC1, 53BP1, MRN, BRCA1), transducer kinases (CHK1 and CHK29 and effector proteins. There is considerable overlap between ATM and ATR phosphorylation substrates. Two G1/S checkpoints are dependent on ATM signalling...v
Figure 3: DNA DSBs repair pathways [29]. Replication forks can stall and may collapse when they
encounter a blocking lesion. This will induced H2AX phosphorylation in the site of damage. Fork restart usually involves HR proteins. Frank double strand breaks (two broken ends) may be repaired either by NHEJ or by HR...vi
Figure 4: General scheme of DNA damage or replication fork arrest responses: the impact on cell fate,
cancer development and genomic instability [34]...vi
Figure 5: P53-dependent senescence, adapted from [60]. An increased DNA damage response results in
p53 phosphorylation which transcriptionally upregulates genes that mediate either apoptosis or cellular senescence to inhibit tumorigenesis...vii
Figure 6: HCT116 WT growth curve. HCT116 WT cells growing exponentially were plated and counted in
a hemocytometer every 12 hours. Results were plotted on a log-linear scale. The population-doubling time was determined using the linear regression equation displayed on the graph. HCT116 WT cell line has a doubling time of 15h and 10 min...11
Figure 7: HCT116 p53 K.O. growth curve. HCT116 p53 K.O. cells growing exponentially were plated and
counted in a hemocytometer every 11 hours. Results were plotted on a log-linear scale. The population-doubling time was determined using the linear regression equation displayed on the graph. HCT116 p53 K.O. cell line has a doubling time of 16h and 37 min...12
Figure 8: HCT116 p21 KO growth curve. HCT116 p21 K.O. cells growing exponentially were plated and
counted in a hemocytometer every 11 hours. Results were plotted on a log-linear scale. The population doubling time was determined using the linear regression equation displayed on the graph. HCT116 p21 K.O. cell line has a doubling time of 19h and 46 min...12
Figure 9: BrdU labelled mitosis. Cells were stained for BrdU and DNA was stained with DAPI (bar, 5µm).
Note that BrdU and DAPI colocalize at the metaphasic plate (white arrow). DAPI staining of a metaphasic plate that does not stain for BrdU (grey arrow)...vii
Figure 10: HCT116 WT labelled mitosis graph. The percentage of mitotic cells BrdU positive (+) at each
time point were plotted in the graph and the 50% points in the ascending and descending portions of the curve were determined...14
Figure 11: Determination of percentage of survival after doxorubicin treatment. Note that, with 500 nM of
doxorubicin, HCT116 WT, HCT116 p53 K.O. and HCT116 p21 K.O. have not yet reached the IC50. The
percentage of survival with 500 nM of doxorubicin in all three cell lines does not vary significantly………16
Figure 12: Determination of percentage survival after irinotecan treatment. Note that, with 3600 nM of
irinotecan, HCT116 WT, HCT116 p53 K.O. and HCT116 p21 K.O. have an overall survival close to 70%...16
Figure 13: Clonogenic survival assay after doxorubicin treatment. HCT116 BRCA1 k.d. and SCRAMB
cells were treated with doxorubicin (500nM, 2h, 4h and 8h) and plated in clonogenic conditions. After one week cells were stained with haematoxylin and counted (both single-cells and colonies). IC50 for
doxorubicin was achieved with 4h exposure to the drug. The increase in % survival with 8h exposure compared to 4h exposure in SCRAMB cells might be a technical artifact. Future experiments shall confirm these results………17
II
Figure 14: Clonogenic survival assay after etoposide treatment. HCT116 BRCA1 k.d. and SCRAMB cells
were treated with etoposide (50µM, 10 min, 15 min, 30 min and 45 min) and plated under clonogenic conditions. After one week cells were stained with haematoxylin and counted (both single-cells and colonies). IC50 for etoposide was achieved with 15 min exposure to the drug. The increase in % survival
with 15 min exposure compared to 10 min in both SCRAMB and BRCA1 k.d. cells might be a technical artifact. Future experiments shall confirm these results………...18
Figure 15: Western blotting experiment to evaluate the level of BRCA1 depletion. HCT116 WT SCRAMB,
lane 1 and HCT116 WT BRCA1 k.d., lane 2...ix
Figure 16: Haematoxylin staining of HCT116 WT BRCA1 k.d. cells. A, HCT116 WT BRCA1 k.d. cells
treated with doxorubicin (500nM, 4h). Note the size of the senescent cell (black arrow)).Bar, 60 µm. B, HCT116 WT BRCA1 k.d. cells (control, no treatment). Note a large colony of regular cells. Bar, 60 µm...x
Figure 17: Senescent outcome after doxorubicin treatment. SCRAMB and BRCA1 k.d. cells were stained
with haematoxylin and classified as either senescent-like or normal looking cells. BRCA1 k.d. cells displayed a significant increase in the proportion of senescent-like cells compared to SCRAMB cells..…19
Figure 18: Senescent outcome after irinotecan treatment. SCRAMB and BRCA1 k.d. cells were stained
with haematoxylin and classified as either senescent-like or normal looking cells. BRCA1 k.d. cells displayed a slight increase in the proportion of senescent-like cells compared to SCRAMB cells………...20
Figure 19: Senescence-associated β-galactosidase staining of HCT116 WT BRCA1 k.d. cells treated with doxorubicin (500nM, 4h). Bar, 50 µm...x
Figure 20: Senescent outcome following etoposide treatment (50 µM, 15 min). Exponentially growing cells were stained for senescence-associated β-galactosidase and imaged by brightfield microscopy using identical image capture settings. For SCRAMB, 785 cells in the control (no treatment) group and 510 in the etoposide group were analysed. For BRCA1 k.d., 978 cells in the control group and 341 in the etoposide group were analysed. BRCA1 k.d. cells displayed an increase of 46% in the senescent outcome compared to SCRAMB cells...21
Figure 21: Total DAPI Intensity Histogram. Cells were grown in coverslips and treated with etoposide
(50μM, 15 min). DNA was stained with DAPI; ≥ 100 nuclei per experimental group were analysed and distributed according to the total DAPI intensity range. Note that 72h after exposure to etoposide roughly all nuclei were distributed across a wide range of high total DAPI intensities………..…………23
Figure 22: Flow citometry analysis of cell cycle distribution in the controls. . HCT116 WT, p53 K.O. and
p21 K.O cell lines with BRCA1 k.d. were designated (BRCA1 k.d. WT, BRCA1 k.d. p53 and BRCA1 k.d. p21 respectively). HCT116 WT, p53 K.O. and p21 K.O cell lines without BRCA1 k.d. were designated (SCRAMB WT, SCRAMB p53 and SCRAMB p21 respectively). Cells growing exponentially were treated with DMSO for 4h, allowed to recover for 1h and then fixed with ethanol 70%. Cells were stained with propidium iodide at least 2h before flow citometry acquision. Note that, all BRCA1 k.d. cells displayed a higher number of cells with a mean percentage of DNA content above G2 (%>G2)………..……24
Figure 23: Flow citometry analysis of cell cycle distribution in cells treated with doxorubicin. HCT116 WT,
p53 K.O. and p21 K.O cell lines with BRCA1 k.d. were designated (BRCA1 k.d. WT, BRCA1 k.d. p53 and BRCA1 k.d. p21 respectively). HCT116 WT, p53 K.O. and p21 K.O cell lines without BRCA1 k.d. were designated (SCRAMB WT, SCRAMB p53 and SCRAMB p21 respectively). Cells growing exponentially were treated with doxorubicin (500nM, 4h) and fixed with ethanol 70% after 1h, 24h and 48h. Note that, BRCA1 k.d. cells displayed a higher number of cells with a mean percentage of DNA content above G2 (%>G2) compared to SCRAMB cells 48h after treatment with doxorubicin………..25
Figure 24: FACS analysis of time course cell cycle distribution in cells treated with irinotecan. HCT116
WT, p53 K.O. and p21 K.O cell lines with BRCA1 k.d. were designated (BRCA1 k.d. WT, BRCA1 k.d. p53 and BRCA1 k.d. p21 respectively). HCT116 WT, p53 K.O. and p21 K.O cell lines without BRCA1 k.d. were designated (SCRAMB WT, SCRAMB p53 and SCRAMB p21 respectively). Cells growing exponentially were treated with irinotecan (3600nM, 12h) and fixed with ethanol 70% after 1h, 24h and 48h. Note that, BRCA1 k.d. and SCRAMB cells displayed a similar number of cells with a mean percentage of DNA content above G2 (%>G2) 48h after treatment with Irinotecan………26
III
Figure 25: Use of BrdU-based tag to identify cells that have been damages at a specific cell cycle phase.
To tag cells in early and late S phases, cells were exposed to a BrdU pulse (10µM 15 min) and shortly after (10 min) to etoposide (50µM 15 min). In this way, cells would be exposed to etoposide at early and late S phases and we may analyse them directly by their replication patterns.
To tag cells in G2, cells were exposed to a BrdU pulse and subsequently to etoposide (50µM 15 min) after a 3h chase. The 3h chase was chosen because after 3h, cells that were BrdU-pulsed while in late S phase are in G2 upon exposure to etoposide. Thus, using this chase time, the late S pattern can be used as a marker (“tag”) for targeting G2 stage (i.e. cells targeted by etoposide while in G2).
To tag cells in G1 we have chosen a 7h pulse chase between the BrdU pulse and the etoposide exposure because after 7h cells that were BrdU-pulse while in late S are in G1 upon exposure to etoposide. Similarly, we used the late S pattern as a marker for “tagging” G1 stage...27
Figure 26: Cell cycle targeting of H2AX foci after etoposide exposure. Cells were exposed to etoposide
(50µM, 15 min) at each cell cycle phase and the levels of H2AX foci were analysed. Cells were imaged by confocal microscopy using identical image capture settings; 25 cells per experimental group were analysed. Note the high dispersion of the H2AX foci area distribution at all cell cycle stages...28
Figure 27: Western blot experiment to evaluate the expression levels of HP1α and H3K9me3 in HCT116 WT control (lane 1); HCT116 WT treated with etoposide 50 µM 15 min, 1 day, 2 days and 3 days after exposure (lane 2, lane 3 and lane 4 respectively); HCT116 wt treated with etoposide 50 µM 30 min, 1 day, 2 days and 3 days after exposure (lane 5, lane 6 and lane 7 respectively). MW, molecular weight marker. There was concomitantly an increase in HP1α and a decrease in H3K9me3 after treatment with etoposide...29
IV
II. List of diagrams and tables:
Diagram 1: Schematic of the labelled mitosis method. Cells that were in late S phase when BrdU-pulsed
will be the first mitotic BrdU positive (+) cells. Similarly, cells that were in G1 phase when BrdU-pulsed will be the last mitotic BrdU positive (+) cells of the first cell cycle. A second cell cycle will initiate when the original late S phase cells pass through G2 an enter mitosis for the second time...ix
Diagram 2: Experimental plan details. Cells growing exponentially were exposed to a short pulse of
etoposide (50µM, 15 min) and collected at defined time points (12h, 24h, 48h and 72h after the pulse) for microscopy analysis...22
Table 1: Percentage of HCT116 WT mitotic BrdU positive (+) cells at each time point. For each time point
approximately 250 cells were analyzed and classified as either BrdU positive (+) or BrdU negative (-). The percentage of mitotic cells BrdU positive (+) was determined for each time point………13
Table 2: Absolute duration of each S phase sub-stages in HCT116 WT cell line. For determination of the
absolute duration of each S phase sub-stage 264 cells from the 2h time point were classified according to their replication pattern………..14
V
III. List of abbreviations:
TOP2 DNA topoisomerase II
TOP1 DNA topoisomerase I
TOP2A DNA topoisomerase IIα
DSBs Double-strand breaks
DDR DNA damage response
PIKKs Phosphatidylinositol 3-kinase related kinases
ATM Ataxia Telangiectasia Mutated
ATR Ataxia Telangiectasia and RAD3-related
DNA-PK DNA-dependent protein kinase
MDC1 Mediator of DNA damage checkpoint 1
BRCA1 Breast-cancer associated protein 1
53BP1 P53 binding protein 1
MRN Mre11/Rad50/Nbs1
Mre11 Meiotic recombination 11 protein
Nbs1 Nijmegen breakage syndrome 1
DSE One-ended DSB
FANCD2 Fanconi anaemia complementation group D2
CHK2 Checkpoint kinase 2
HR Homologous recombination
NHEJ Non-homologous end-joining
RPA Replication protein A
BRCA2 Breast-cancer associated protein 2
SA-βgal Senescence-associated β-galactosidase
SAHF Senescence-associated heterochromatin foci
VI
HDCAi Histone deacetylase inhibition
MTT (3-(4, 5-dimethylthiazolyl-2)-2, 5-diphenyltetrazolium bromide)
HP1 Heterochromatin protein 1
K.O. Knockout
HCT116 WT HCT116 wild type for p53 and p21
BrdU 5-bromo-2´-deoxyuridine
IC50 Half-minimal inhibitory concentration
SCRAMB Scramble
k.d. Knock-down
HP1α Heterochromatin protein 1α
H3K9me3 Histone H3 tri-methyl K9
VII
IV. Acknowledgments
Well it is supposed for me to say in a few words all that has happened in these last eleven months. As you can imagine it is quite difficult to resume such a period of time in mere words as much of what has happened changed the way I am and the way I see things and this kind of effects are not writable. Nevertheless, I will give it a try!
The most dramatic change for me was engaging the scientific world; good lord this is crazy, starting to think and do a thousand things all at the same time without any mess…I know as João says “it is not a patient’s life” but for god it is my ass on the line! So it turns out that I spent this year quite stressed, worried that I would not be perfect enough doing this, doing that…Nonetheless, here I am a vigorous worker that does her best and learned from the best!
So, I will start thanking to:
- João, the holly João that was always worried about the P.I.B. and saying: “Come on Inês work!” or ”You don’t have to eat you have to work” or “P.I.B., P.I.B., P.I.B.” but the truth is that without his wonderful gourmet chocolates I would not have made it through. Although you were kind of picky sometimes, you always did your best to teach me how to do things properly, how to become a successful scientist, how all these bureaucracies work, how we should be committed to what we are doing with all our heart and our soul. Although we have had a lot of conversations about work and also about life and in many things, especially about life, we do not agree, I have always taken your thoughts in great consideration. Needless is to say how much I thank you for receiving me in your lab and for all your support. You were always available to help me in my search for a PhD and more than that you have prepared me to engage one! In the end, what I really want you to know is that whatever you need in the future, you can count on me for I will do my best to give all your help in return.
- Joana, I have to thank you for all your effort to make me feel at home, with all our nice chats about ourselves and our lives. The way you have treated and trusted in me and in my work made me feel more confident and I can say that it was really a pleasure working with you. Everyday I woke up knowing that we were going to work together was a day I went happier on the bus and went happier home. I will never forget IAJC and I will certainly not forget all you have done for me, all your advices, all your support, all your dedication! You know and even if you don’t I want to make it clear that you will always have a home in Holland (in case I go there for my PhD;)!
- Pedro, I don’t know how I could manage to count all those clonogenic assays without your help! I really have to thank you for helping in everything that I needed. I will go away but whatever I can do for feel free to ask! You know if these “no access to articles” situation continues I will help with the ones I hope I will have access to;)
VIII
- Sandra, Ricardo and Joana, I thank you all the support, specially the Ricardo’s crazy arabic/japanese things;) Oh and of course “música enrolada” and Joana’s nice lunches when all I could eat was lettuce.
- My family, my mother, my sister and my father; my mother and my sister are part of my life, they were always there to support me after an exhausting day at work! I can never thank them enough for that and for all the dedication throughout my entire life! Although my mother got bored every time I talked to her about my work (she couldn’t understand a thing) she never stopped listening largely because she enjoyed having company during a two hour’s dinner. Well my sister is the only one who does not fall asleep watching cartoons and so I cannot thank her enough for hilarious moments in the cinema. I hope she won’t force me to see Hannah Montana! All the dinners at the Chinese, the karaoke, everything we did together helped me to keep a smile on my face in the worst situations. And that’s how I will continue as long as Sofia continues to be Hello Kitty fan number one, my mother continues to take hours to finish any meal whatsoever and my father keeps surprising us with wonderful dinners at Edmundo.
- At last but not at least, my boyfriend Rui, to whom I have to thank for everything, all the motivation he gave me when I was so tired and in despair. You know much more than what I may say to you in these acknowledgments; in fact no words can tell what we tell by simply looking at each other. If I say that writing this Master thesis was full of joy and happiness is because you were by my side all along. If I could stand this year in which everything changed it was because you have stood right next to me, the two of us together always. Truthfully this was the first year since we were four years old that our school routine vanished! It was utterly difficult and only we know how much it really affected us; in a glimpse we went from the school chair to the bench table. All the hours we spent talking about such a hasty change made us grow inside and made our relationship grow: we have become more mature. The most valuable treasure we took from this long journey is the strength we have found in each other to “Always look on the bright side of life” and we are always there whatever comes! All the afternoons we have spent chating and listening to music couldn’t have helped us more. Never forget: “everybody’s got some trouble when you worry you make it double, don’t worry be happy”.
IX
V. Abstract:
DNA topoisomerases are essential to the resolution of DNA topology during several metabolic processes such as transcription, replication and chromosome segregation. Topoisomerase II (TOP2) catalyzes the passage of one DNA double strand through another and that is the reason why this enzyme can (un)knot or (de)catenate DNA molecules. In mammals there are two isoforms of TOP2, α and β, which are encoded by separate genes.Given their vital functions TOP2 enzymes are a main target of anticancer drugs. Poisons, such as etoposide and doxorubicin, cause DNA double-strand breaks which assault DNA integrity and need to be properly repaired to guarantee genomic stability. The repair of these DNA lesions, either by homologous recombination or non-homologous end joining, will be triggered by the DNA damage response (DDR) in which BRCA1 is one of the key players. Senescence and apoptosis can also be signaled through the DDR, acting as barriers to neoplastic progression. Senescent cells undergo several changes not only in morphology but also in gene expression. Here, we provide evidence that BRCA1 role in the DDR also relates to the cellular fate given that BRCA1 depletion leads to an increase in the senescent outcome following exposure to TOP2 poisons. We also found evidence for etoposide-induced alteration of heterochromatin composition and distribution, namely altered levels of tri-methylated histone H3 at Lysine 9 (H3K9 me3) and heterochromatin protein 1α. Future studies shall address whether BRCA1 facilitates the senescent outcome via chromatin alteration.
X
VI. Resumo:
As DNA topoisomerases são essenciais para a resoluçao de alterações na topologia do DNA que surgem das mais diversas actividades metabólicas tais como a transcrição, replicação e segregação dos cromossomas. A enzima DNA topoisomerase II (TOP2) produz quebras transientes na dupla cadeia de DNA através das quais passará a outra dupla cadeia de DNA intacta. Deste mecanismo catalitico resulta a capacidade de catenação/decatenação desta enzima. Os mamíferos possuem duas isoformas da topoisomerase II, α e β, codificadas por diferentes genes. Em virtude das funções vitais desta enzima, ela é um dos alvos de numerosas drogas utilizadas currentemente no tratamento do cancro. Venenos tais como o Etoposido e a Doxorrubicina provocam quebras na dupla cadeia de DNA que precisam de ser convenientemente reparadas de modo a assegurar a estabilidade genómica. A reparação destas lesões, seja por recombinação homóloga ou por junção de extremidades não-homólogas, é iniciada através de uma via de sinalização geral designarda: resposta a lesões no DNA. A proteína BRCA1 é um interveniente fulcral nesta resposta onde também se dita o destino celular, senescência ou apoptose a fim de travar a tumorigenese. As células senescentes passam por várias alterações, tanto a nível morfológico como a nível da expressão génica. Verificou-se que o papel de BRCA1 na resposta a lesões no DNA também está relacionado com a decisão sobre o destino celular dado que a depleção de BRCA1 levou a um aumento na senescência após o tratamento com venenos de TOP2. Viu-se também que a trimetilação da histona H3 na lisina 9 diminui após o tratamento com o Etoposido enquanto que a expressão da proteina 1α da heterocromatina aumenta. Sugerimos assim que BRCA1 influencia a senescência após tratamento com venenos de TOP2 e que tal poderá estar relacionado com modificações estruturais e funcionais da cromatina.
XI
VII. Resumo Alargado:
A replicação, transcrição, recombinação e a segregação cromossómica são algumas das várias actividades metabólicas que requerem a resolução de topologias complexas no DNA. Na verdade, é a própria estrutura em dupla hélice da molécula de DNA que leva ao surgimento de alterações topológicas durante o seu metabolismo, e garantir a viabilidade celular está dependente da sua resolução. Existe, para esse fim, uma família de enzimas ubíquas: as DNA topoisomerases. Estas enzimas dividem-se em dois tipos: topoisomerases do tipo I, que produzem quebras transientes de cadeia simples no DNA por onde se dá a passagem da cadeia complementar e topoisomerases do tipo II que produzem quebras transientes de cadeia dupla . As diferenças no mecanismo catalítico destas enzimas leva a que possuam diferentes competências, sendo as do tipo I responsáveis principalmente pelo relaxamento dos enrolamentos no DNA e as do tipo II pela actividade de catenação/decatenação. Posto isto, é importante referir que apesar das topoisomerases do tipo II (TOP2) poderem substituir as funções das do tipo I, o inverso já não se aplica uma vez que a actividade de catenação/decatenação é exclusiva das TOP2. Os mamíferos possuem duas isoformas da topoisomerase II, α e β, codificados por genes distintos.
A importância da TOP2 na viabilidade celular possibilitou a utilização corrente de drogas contra esta enzima no tratamento de vários tipos de cancro. Estas drogas dividem-se em duas grandes classes: venenos, nomeadamente o Etoposido, e a Doxorrubicina, e inibidores catalíticos. Enquanto os venenos provocam quebras na dupla cadeia de DNA, os inibidores catalíticos apenas inibem a actividade da enzima não agredindo directamente a integridade genómica. O tratamento com venenos de TOP2 tem inúmeras consequências a nível celular tais como a alteração da expressão génica e a interrupção temporária do ciclo celular. No entanto, é a activação da resposta a lesões no DNA que permite sinalizar a sua reparação quer por recombinação homóloga, quer por junção de extremidades não-homólogas. Esta resposta pode dividir-se em três fases principais: a detecção da lesão de dupla cadeia por proteínas sensores, o recrutamento de proteínas que transduzem o sinal e levam à sua amplificação e finalmente, a mobilização de proteínas efectoras que regulam diversos aspectos funcionais da célula incluindo a reparação do DNA. BRCA1 é uma das proteínas chave desta resposta tendo já sido descritas as suas funções não só ao nível do recrutamento como também de mobilização de outras proteínas. Além disso, BRCA1 também desempenha um papel central na escolha do mecanismo de reparação uma vez que dependendo da fase do ciclo em que a célula se encontra assim deverá será favorecida a recombinação homóloga ou a junção de
XII
extremidades não-homólogas. BRCA1 participa nos dois mecanismos de reparação mencionados; qualquer defeito ao nível dos mesmos pode causar instabilidade genómica e levar à tumorigenese. De forma a travar estes dois processos a resposta a lesões no DNA pode também levar à apoptose ou à senescência celular através da activação de p53. Na verdade, já se observou em fibroblastos senescentes a persistência de marcadores moleculares característicos da resposta a lesões no DNA, o que vem reforçar ainda mais a ligação entre resposta a lesões no DNA e senescência.
A senescência é descrita como um estado de paragem permanente do ciclo celular no qual a célula sofre várias alterações, tanto a nível morfológico como a nível da expressão génica mantendo-se no entanto metabolicamente activa. Este fenómeno pode ter diversas causas, sendo a resposta a lesões no DNA apenas uma delas. Alterações na estrutura da cromatina também já são reconhecidas como potenciais desencadeadores deste destino celular uma vez que algumas células senescentes possuem focos de heterocromatina associados à senescência. Estes correspondem a heterocromatina facultativa e possuem muitas vezes algumas modificações de histonas (por exemplo a metilação na histona H3 da lisina 9) e proteínas (nomeadamente proteína 1α da heterocromatina) associadas à heterocromatina. Em oposição a este papel da heterocromatina no estabelecimento e manutenção do estado senescente surge a evidência de que, a utilização de inibidores de acetilases de histonas que promovem a formação de eucromatina, também induzem a senescência; na verdade, núcleos de maiores dimensões, muitas vezes preditivos da senescência, apresentam uma cromatina mais laxa.
Apesar de todos os benefícios que a indução da senescência possa ter como mecanismo inibidor da progressão neoplásica, o facto das células senescentes secretarem factores muitas vezes estimuladores da tumorigenese, e segundo novas evidências, serem capazes de reverter o fenótipo senescente levanta grandes questões sobre o que está realmente estamos a provocar quando recorremos a tratamentos com drogas como venenos de TOP2.
Assim, é nosso objectivo esclarecer de que modo o tratamento com venenos de TOP2 pode conduzir à senescência e, em particular, se BRCA1, dada a sua importância na resposta a lesões no DNA, tem alguma influência neste processo. Além disso, dado que a cromatina parece ter também um papel determinante na senescência, avaliou-se a expressão de histonas modificadas – H3 trimetilada na lisina 9 e proteínas associadas à heterocromatina - proteína 1α da heterocromatina. Considerou-se ainda relevante analisar de que modo a fase do ciclo celular
XIII
em que a droga é aplicada pode relacionar-se com a quantidade de lesões que surgem no DNA após o tratamento.
No geral, viu-se que a depleção de BRCA1 provoca um aumento no número de células senescentes após o tratamento com Etoposido e Doxorubicina tendo isto sido verificado tanto em condições clonogénicas como em crescimento em massa (mass growth). A avaliação da instabilidade genómica através da análise da distribuição de diferentes graus de ploidia demonstrou que a depleção de BRCA1 causa um aumento no número de células com um conteúdo de DNA superior a 4N (conteúdo DNA na fase G2) sendo este aumento mais evidente após o tratamento com Doxorubicina. Em relação à expressão de proteínas associadas à heterocromatina verifica-se concomitantemente uma diminuição da trimetilação da histona H3 no segundo e terceiro dia após o tratamento com Etoposido e um aumento da proteína 1α da heterocromatina no segundo e terceiro dia ou apenas no segundo dia dependendo do tempo de exposição ao fármaco. No que diz respeito à análise da quantidade de lesões no DNA após o tratamento com Etoposido em diferentes fases do ciclo celular observou-se que existia uma grande variabilidade no número de lesões dentro de cada uma das fases, isto é, para cada fase observam-se células com elevado e com baixo número de lesões. Este resultado, apesar de evidente para os núcleos analisados, necessitará de uma maior amostragem de modo a poder concluir-se com elevado grau de confiança que a quantidade de lesões no DNA é independente da fase do ciclo em que a célula se encontra quando sujeita ao Etoposido.
Em suma, o estudo da resposta a lesões no DNA mediadas por TOP2 possui grande relevância em termos clínicos, uma vez que esta enzima se tornou um dos principais alvos de várias terapias anti-tumorais. O facto da resposta a lesões no DNA poder conduzir não só à apoptose como também à senescência, e de este último fenómeno ser muitas vezes encarado como indesejável no tratamento do cancro, levanta sérias questões sobre até que ponto será vantajosa a indução da senescência mediada por drogas anti-TOP2. Caso se venha a verificar que esta mesma indução durante o tratamento do tumor se correlaciona com um pior prognóstico a longo prazo, quaisquer factores, tais como a análise do estado de BRCA1, que permitam prever este destino celular poderão ser decisivos na escolha de esquemas terapêuticos mais eficazes.
XIV
VIII. Keywords:
DNA topoisomerases BRCA1
Senescence
DNA damage response Genomic instability
XV
IX. Palavras-chave:
DNA topoisomerases BRCA1
Senescência
Resposta a lesões no DNA Instabilidade genómica
- 1 - I) Introduction:
The topological state of DNA in both prokaryotic and eukaryotic cells is monitored by a special family of enzymes known as DNA topoisomerases [1]. The extended double helix structure of DNA raises several obstacles to key cellular events such as DNA replication, repair, transcription and recombination and this implies the presence of topoisomerases to assure cell viability. These enzymes can be classified into two highly conserved classes, type I and type II [2] [3]. While type I class enzymes catalyse the passage of one strand of the DNA helix through a transient nick in the complementary strand and do not require a high energy cofactor for catalysis, type II class enzymes catalyse the passage of one intact DNA double helix through a transient DNA double strand break which requires the hydrolysis of ATP [2]. Given this distinct mechanism of action type I enzymes are mainly involved in the relaxation of supercoiled DNA whereas type II enzymes can resolve knots, entanglements and catenations [3] (Fig. 1, Annex).
Type II topoisomerases have a three-domain structure viz an ATPase N-terminal region, a DNA binding/cleavage core and a C-terminal tail important for nuclear targeting and interactions with other proteins [4] [5]. Moreover, they are expressed in vertebrates as two closely related but distinct isoforms designated α (MW= 170 kDa) and β (MW= 180 kDa) which are encoded by separate genes [6] [7] [8]. Dimerisation of these enzymes is a prerequisite for their function and both homo and heterodimers can occur although only the homodimers are active [8] [9]. As for the expression patterns and physiological functions there are several differences between these enzymes namely the up-regulation of the α-isoform during cell proliferation and its tight association with mitotic chromosomes. In contrast, the β-isoform has an expression pattern that is independent of cell proliferative status and dissociates from chromosomes during mitosis [6] [8] [10]. Additionally, it is known that cells can survive without the β-isoform but not without the α-isoform since only the latter participates in DNA replication, removing the catenations left on DNA after this process [6].
The relevance of DNA topoisomerases goes well beyond their essential cellular functions; in fact they are the targets for a number of anticancer drugs currently in clinical use [2] [6] namely etoposide (VP-16) and doxorubicin which target primarily topoisomerase IIα (TOP2A) [8] but also camptothecin and irinotecan which will target topoisomerase I (TOP1) [11]. All these compounds will promote the stabilization of a reversible reaction intermediate termed the “cleavable complex” which is a normal intermediate in the catalytic cycle of these enzymes (fig. 1, Annex) [12]. This stabilization will change the kinetics of the reaction and cause the enzyme
- 2 -
to remain covalently bound to the DNA for a longer period of time which allows the conversion of the cleavable-complexes into single or double-strand breaks due to collision with the replication fork (TOP1 inhibitors) or with the transcription machinery (TOP2 poisons) [13] [11]. The way cell cycle progression is affected by these drugs also depends on which is used such that the exposure to TOP2 poisons will influence mostly the progression through G2/M with almost no effect on S-phase progression whereas exposure to TOP1 inhibitors will mainly affect S-phase.
Drugs targeting TOP2 can be divided into two broad classes: poisons, which as mentioned above will stabilize the cleavable complex and generate DNA DSBs and catalytic inhibitors that do not induce DNA DSBs and may act either by locking the DNA-bound enzyme in the closed clamp form or by interfering with TOP2 binding to DNA.
The exposure to TOP2 poisons has multiple cellular effects such as altered gene expression and cell cycle arrest, but probably the most important of them all is the triggering of the DNA damage response (DDR) [11]. Generally, the DDR can be divided into three main steps: the detection of the DNA DSB by sensor proteins, the recruitment of transducer and adaptor proteins to the site of lesion that will amplify and diversify the DNA-damage signal and, finally, the enrolment of downstream mediator/effector proteins that regulate various aspects of cellular function including DNA repair [14] [15]. As a consequence of the DNA damage signalling there is a process of cell cycle arrest, termed the “checkpoint response” which can induce a transient delay in G1, S or G2 phases. With respect to the DDR there is still no unanimous chronological pathway, mainly because it is in fact a network of interacting pathways that will work to execute a response depending on cell cycle stage upon induction of the DNA damage [16].
Regarding the signalling processes activated by the presence of DSBs, it is commonly accepted that they depend on the phosphatidylinositol 3-kinase related kinases (PIKKs) ATM (Ataxia Telangiectasia Mutated) and ATR (Ataxia Telangiectasia and RAD3-related) although the main PIKK responsible for the signalling of DSBs is ATM [17]. Recently it has been demonstrated that ATM activation (by intermolecular trans-phosphorylation) can be rapidly triggered by changes in chromatin structure even if those changes are not likely to induce DSBs. In light of this evidence it has been proposed that the initiating event in the DDR is a change in chromatin structure derived from the chromosomal damage [18] [19].
Another early event in the DDR is the phosphorylation of H2A.X on Ser 139 (the X member of the H2A histone family) which can be performed either by ATM or by DNA-dependent protein kinase (DNA-PK) [17] [20] [21]. This H2A.X phosphorylation, termed γ-H2A.X,
- 3 -
propagates over megabase-pair regions away from the DSB in both directions - H2A.X foci and is required to either the recruitment or stable retention of mediator proteins such as mediator of DNA damage checkpoint 1 (MDC1), breast-cancer associated protein 1 (BRCA1), p53 binding protein 1 (53BP1) and the MRN (Mre11/Rad50/Nbs1) complex [17] [21]. This latter complex has also been referred to as a candidate sensor for it binds both to ATM and DNA [22] (Fig. 2, Annex).
Activated ATM phosphorylates numerous key proteins namely MDC1, BRCA1, 53BP1 and FANCD2 [23] and, in turn, some of those substrates such as BRCA1, 53BP1 and Nbs1 can function either upstream of ATM or downstream of Chk2 depending on the context [23] [24]. Indeed, it has been shown that a subset of ATM as well as ATR-dependent phosphorylation events require BRCA1 namely phosphorylation of p53, Nbs1 and Chk2 [25]. Once the relevant protein have been recruited and assembled at the site of damage these complexes can engage checkpoint activity to halt DNA replication, which is required for proper repair of damaged DNA [26] (Fig. 2, Annex).
As DSB are considered to be, in general, the most cytotoxic of all DNA lesions, there are efficient and multi-potent mechanisms to repair them, namely the nonhomologous end joining (NHEJ) and homologous recombination (HR) pathways [27] [28]. The nonhomologous end joining pathway (NHEJ), mediated by the DNA-PK complex, functions throughout the cell cycle and is the predominant DSB repair mechanism in the G1 phase [20]. Repair via the homologous recombination pathway (HR) takes place in late S-G2 phase and involves the generation of a single-stranded DNA region to which RPA proteins bind. DSBs which originate from replication fork collapse are also repaired primarily by HR since the fork collapse produces a one-ended DSB (DSE) [20] [29] (Fig. 3, Annex).
Early acting proteins that influence both repair pathways may control the choice of repair pathway [29]. Once a commitment has been made towards one of the repair pathways, specific proteins involved in that pathway will drive the reaction to HR or NHEJ products (fig. 3). It is possible that BRCA1, one of the key players involved in the cellular response to DSBs [14] [28] [30] [31] [32] and which functions in both DSB repair pathways, [33], regulates also the pathway choice although the precise mechanism for this is currently unknown. One hypothesis relies on the evidence that BRCA1 negatively regulates MRN-mediated end processing and thus may suppress the endo- and exonuclease activity of Mre11 allowing for an enhancement in NHEJ accuracy while, at the same time, can interact with BRCA2 which is a critical mediator of the Rad51 strand transferase (step of the HR pathway) [29].
- 4 -
Defects in any of these pathways will cause genome instability and promote tumorigenesis [30] [34] (Fig. 4, Annex). In fact, whenever a break goes unfixed the consequences can be disastrous ranging from gene rearrangements to chromosomal breakdown.
For this reason, the engagement of the DDR can lead either to apoptotic or senescent outcomes in order to block neoplastic progression. Indeed, it has already been shown that senescent human fibroblasts display molecular markers characteristic of cells with DSBs such as γH2AX foci, 53BP1 and MDC1 [35] and this evidence strengthens the causal relation between DNA damage and senescence (Fig. 5). Senescence is described as a state of permanent cell cycle arrest in which the cell undergoes several distinct biochemical and morphological changes [36] and yet remains metabolically active. Senescent cells show a flat and enlarged morphology and are resistant to apoptosis though the precise mechanism for this feature is unknown [35] [37].
One of the specific markers related to the senescent outcome is senescence-associated β‑galactosidase (SA-βgal) which is detectable by histochemical staining. In addition, some senescent cells display senescence-associated heterochromatin foci (SAHFs) in euchromatic DNA which are detected by the preferential binding of DNA dyes such as 4′,6-diamidino-2-phenylindole (DAPI) as well as by the presence of certain heterochromatin-associated histone modifications (for instance, H3 Lys9 methylation) and proteins [for example, heterochromatin protein-1 (HP1)] [35] [38]. The accumulation of DNA damage is the trigger to all this global changes in nuclear architecture, which also includes a gradual loss of perinuclear and perinucleolar heterochromatin [39]. Although it is believed that senescent cells show chromatin condensation [38], chemical histone deacetylase inhibition (HDCAi) which promotes euchromatin formation, induces senescence [40]. This finding seems to be inconsistent with the role of heterochromatin and SAHFs in both establishing and maintaining the senescent growth arrest. Indeed, it remains clear how senescence can be associated with heterochromatin biogenesis (SAFHs) but also, in other contexts, by activities that promote heterochromatin disruption (HDACi) [35]. Nonetheless, chromatin perturbations have been proposed as another possible cause for senescence. Amongst the numerous functions regulated by BRCA1, this protein has also been shown to induce large-scale chromatin decondensation [41] possibly via its interaction with TOP2 [42].
The stimuli that generate a DDR induce senescence chiefly through the p53 pathway (Fig. 5). P21 is a critical transcriptional target of p53 and mediator of p53-dependent
- 5 -
senescence. In spite of this, p21 is also responsible for a transient growth arrest induced by DNA damage and thus what determines whether cells merely arrest or undergo senescence is currently unknown; it is, however, commonly accepted that a sustained p53-p21 signalling is required for cells to undergo senescence. Whatever the case, there is experimental evidence showing that reduction of p53, p21 or DDR proteins prevents the DNA-damage-initiated senescence and can even reverse the senescent growth arrest [35]. The proliferation of these damaged cells can lead to a state of extensive genomic instability and cell death termed crisis or mitotic catastrophe, which acts as a second barrier to malignant transformation.
In spite of all the benefits that the senescent outcome seems to bring to organisms that are at high risk of developing a neoplastic phenotype there is an emerging, though still largely speculative, idea that the DNA-damage-initiated senescence is a two-edge sword [43]. On one hand, senescent cells can modify the microenvironment that surrounds preneoplastic cells and hence stimulate tumorigenesis [43]. On the other hand, it appears that senescence reversal can occur in case cells senesce without complete engagement of the pRB pathway and subsequently lose p53 function [35] [44] [45]. In either case, this raises concern to what might be the prognosis when cancer patients are treated with drugs that promote the senescent outcome. In brief, DNA topoisomerases are fundamentally dualistic in nature, not only they are essential to cell viability but also capable of imposing great harm to the cell genome [2]. This dark side of topoisomerases has proven to be of great value in the development of antineoplastic drugs [2]. That is to say, DNA double-strand breaks are probably the most dangerous type of DNA damage insomuch as little as one DSB can be sufficient to kill a cell or trigger apoptosis [30]. Furthermore, an incorrect joining of broken DNA DSBs may lead not only to loss or amplification of chromosomal material but also to translocations in which chromosomal segments are exchanged [30]. In the end, all these events can lead to tumorigenesis and yet we intend to treat cancer using the same weaponry with which it probably arose. Ultimately, future research on this complex network of proteins that function to repair DSBs can unravel some new pathways to develop more effective strategies in cancer therapy as well as help to predict how individual cancer’s will respond to existing therapies based on the genotyping and phenotyping of their DNA damage response pathways [29] [30].
- 6 - II) Objectives:
Drugs that poison DNA topoisomerases and related compounds (inhibitors) have been mainstays in cancer therapy since the 1960s although it was not until 1971 that Wang discovered the first DNA topoisomerase. Actually, these drugs were among the earliest ones to be used in medical oncology and they have become central components of both primary and adjuvant chemotherapy regimens in current usage. In light of this fact, there is a mounting concern on which cellular effects may emerge from exposure to these drugs. Here, we have partially addressed some of the issues raised by these concerns. To do so, we have:
1. Investigated the role of BRCA1 in the cellular senescent outcome after treatment with TOP2 and TOP1 poisons. BRCA1 was chosen due to its key involvement in the DNA damage response and the resulting connection with increased genomic instability, and also to its known involvement in tumorigenesis in humans.
2. Examined how the BRCA1 background interferes with cell cycle distribution and whether it influences or not the cellular DNA content after exposure to both TOP1 and TOP2 drugs.
3. Scrutinized how the cell cycle phase in which cells were exposed to TOP2 poisons influences the amount of γH2AX foci harbouring DNA lesions (DSBs). It is common knowledge that cancer cells proliferate more than normal cells. Moreover, if a certain cell cycle phase is longer when compared to others, the chance of catching the cells in that particular phase upon drug exposure is higher and so it becomes interesting to know if the effects, with respect to number of lesions, depend on the cell cycle phase.
4. Analysed the status of some heterochromatin markers, in order to assess whether these can be utilized as markers of “pre-senescent” nuclei.
Together, the results to be obtained are expected to clarify the role of TOP2-mediated DNA lesions in genomic instability and in the induction of senescence, and to what extend BRCA1 could act as a modifier of these cellular outcomes.
- 7 -
III) Materials and Methods:
i) Cell culture:
HCT116 cell lines [HCT116 wt [American Type Culture Collection (ATCC), Rockville, MD], HCT116 p53 K.O. and HCT116 p21 K.O. kindly provided by Dr. Bert Vogelstein] were grown in a 37ºC incubator with 5% CO2 in McCoy’s (Gibco BRL) supplemented with L-glutamine (1,5 mM), antibiotics (penicillin and streptomycin) and 10% of fetal bovine serum (FBS). Human embryonic kidney 293T/17 cell line (ATCC) was grown in Dulbecco’s Modification to Eagle’s Medium (DMEM).
ii) Drugs, chemicals and antibodies:
Etoposide (VP-16), 4, 6- diamidino-2-phenylindole (DAPI), and 5-bromo-2´-deoxyuridine (BrdU) were purchased from Sigma-Aldrich; Doxorubicin Hydrochloride was from Calbiochem (USA) and Irinotecan was from Pfizer (CAMPTOSAR 20 mg/mL, D5G300). The antibodies used for immunostaining were as follows: mouse monoclonal anti-phospho-Histone H2AX (Ser139) clone JBW301 (Upstate); rabbit polyclonal antibodies against Histone H4, Histone H4 (tri methyl K20), Histone H3 (tri methyl K9) were purchased from Abcam (USA); mouse monoclonal anti Histone H3 (Abcam); sheep polyclonal against BrdU (Biodesign International). Alexa488, FITC and Texas red-conjugated affinity purified secondary antibodies were purchased from Jackson ImmunoResearch Laboratories (West Grove, PA).
The antibodies used for western blotting include: mouse monoclonal anti-Brca1 (Calbiochem), mouse monoclonal anti-βactin (Sigma-Aldrich); also the rabbit polyclonal antibodies against Histone H4, Histone H4 (tri methyl K20), Histone H3 (tri methyl K9) and the mouse monoclonal anti Histone H3 (Abcam).
MTT reagent ((3-(4, 5-dimethylthiazolyl-2)-2, 5-diphenyltetrazolium bromide)) was purchased from Calbiochem.
Transfection material includes: pCMV-dR8.91 (TRC); VSV-G (TRC); TransIT-LT1 transfection reagent (MirusBio); OPTI-MEM serum-free media (Invitrogen); DMEM (Dulbecco’s Modification to Eagle’s Medium; Mediatech); iFBS (heat-inactivated FBS; HyClone); Polybrene (Hexadimethrine bromide; Sigma) and Puromycin Dihydrochloride (Sigma).
Histochemical staining of β-galactosidase activity was performed using the Senescence cells histochemical staining kit (purchased from Sigma-Aldrich) as per the manufacturer instructions.
- 8 - iii) Transfection of small hairpin RNA
The small hairpin RNAs used were obtained from The RNAi Consortium (TCR). These include: BRCA1.I, BRCA1.II, BRCA1.III, BRCA1.IV and SCRAMBLE. The preparation of transfection-quality plasmid DNA was as described in [46]. Lentiviral production and infection were as detailed in TCR Lentivirus production protocol Part 2 (18 Jan 2007) and in TCR Lentivirus infection protocol Part 1 (9 Feb 2009). In brief, the most relevant steps in the transfection process were as follows:
- Lentiviral production: 293T packaging cell line was seeded at 2.2x10⁵ cell/mL in low-antibiotic growth media [DMEM + 10% iFBS (heat-inactivated FBS) + 0.1x Pen/Strep) in a 96 well-plate. After approximately 24 hours cells were transfected with the transfection mix containing packaging and VSV-G envelope plasmids, the hairpin-pLKO.1 of interest and the TransIT-LT1 transfection reagent (diluted in OPTI-MEM). After 18-20 hours the medium was changed and replaced with high serum growth media. Cells were incubated for 24 hours and the medium containing the viral pool was harvested and stored at -80ºC.
- Lentiviral infection: HCT116 cell line/s was/were seeded in a 24-well plate. The media was replaced for fresh media containing polybrene and then the viruses were added. Cells were spun at 2250 rpm in plate for 90 min at 37ºC. Media was changed immediately after the spin infection. After 24 hours puromycin (1mg/mL) was added to each well. The puromycin selection lasted for 4 days post-transfection.
iv) Western blotting
Total cell extracts were prepared by adding Laemmli 2X buffer (125 mM Tris pH 6.8, 4% SDS, 20% glycerol, 0.004% bromophenol blue, 10 % 2-mercaptoethanol). Cells were scraped from the dish, transferred to an eppendorf and boiled for 10 min at 95ºC. To analyse the knock-down status of BRCA1, an aliquot of cell suspension was collected to an eppendorf, centrifuged at 3000 rpm for 5 min at 4ºC, washed with PBS, resuspended in 2X concentrated electrophoresis sample buffer and finally boiled for 10 min at 95ºC. The protein extracts were kept at -20ºC. To reduce viscosity cells were treated with benzonase () for 20 min at room temperature previously to loading and running the gel.
Detection of high molecular weight proteins was done using a 7% polyacrylamide gel while detection of lower molecular weight species was done using a 14% polyacrylamide gel.
Coomassie staining was used to visualize the low molecular weight proteins. The 14% gels were incubated with Coomassie Brilliant Blue solution for 1 hour with mild agitation. For
- 9 -
destaining, gels were incubated with Coomassie Destain solution with mild agitation until the excess die had been removed.
For wet transfer of proteins to nitrocellulose membranes conditions were 90 min at 250 mA to high molecular weight proteins and 45 min at 80 mA to small molecular weight proteins. A reversible Ponceau Red staining was used to check for success of transfer.
The membranes were blocked using a 5% non-fat skimmed milk solution in PBS 1x. It was incubated for 1 hour at room temperature under agitation.
The incubation time with primary and secondary antibodies was 2 hours, and the membrane was washed several times with PBS 1x after each incubation time.
An ECL detection kit was used to detected HRP-conjugated antibodies.
v) Immunolabeling procedures:
Cells growing on coverslips were fixed either in PHT [Paraformaldehyde (PFA) 7.4%, HPEM 2x buffer and Triton X-100] for 10 min at room temperature with mild agitation or in PFA 1% for 1 min followed by Methanol at -20ºC for 10 min. Cells were kept in PBS-Tx (PBS 1x buffer and Triton X-100 0.05%) at 4ºC until immunostaining. Primary and secondary dilutions as well as washes during the immunostaining procedure were done in PBS-Tx. Coverslips were incubated for 1 hour in a 37ºC humid chamber with both the primary and secondary antibodies. Coverslips were washed several times after the two incubations. For post-staining fixation cells were left in FA 2% in PBS for 10 min then washed several times and mounted in Vectashield + 4, 6- diamidino-2-phenylindole (DAPI). In double-labelling experiments with a sheep polyclonal anti-BrdU antibody and a mouse monoclonal specific for H2AX, H2AX detection preceded that of BrdU and the incubation time with both the primary and secondary antibodies was twice the usual incubation time. After H2AX immunostaining cells were subjected to 4N HCl for 10 min, in dark, in order to accomplish DNA depurination. Acid neutralization was achieved by leaving the coverslips in PBS-Tx + Tris 0.1M pH 8.0, in the dark for at least 1 hour. BrdU staining followed as described after these two key steps. For DAPI quantifications cells were left in DAPI (1mg/ml) in PBS-Tx for 5 min and then mounted in Vectashield medium.
- 10 - vi) The MTT assay
Cells were plated in 96-well plates to test different concentrations of Irinotecan and Doxorubicin. Following each drug exposure the medium was replaced; after 24 hours the MTT solution was added to a final concentration of 1mg/mL in each well. Plates were left for 2 hours at 37ºC with 5% CO2. The medium was then removed and a DMSO + glycine buffer (pH=10.5) solution was added. Plates were read at 570 nm with Tecan i-Control 1.4.5.0 software.
vii) Clonogenic assay
Cells were seeded and treated with Irinotecan, Doxorubicin or Etoposide when a suitable cellular density was reached (approximately 60% confluency). After drug exposure, cells were incubated with fresh drug-free medium and allowed to recover for 1 hour at 37ºC with 5% CO2. The appropriate number of cells was plated in 10 cm Petri-dishes in order to allow the formation of colonies within 1 week. After this time cells were fixed with 2% FA in PBS, 1 min followed by Methanol, 10 min at room temperature. Then, cells were hydrated in distilled water for 1 min, stained with haematoxylin for 5 min, washed two times with water and finally dehydrated with Ethanol [70% (1 min), 95% (1 min) and 100% (1 min)].
viii) Flow citometry assay:
For DNA content analysis, cells were plated in 6-well plates and treated with different drugs according to the specific experimental procedures. Cells were then fixed in 70% ethanol (at least for 4 hours) at 4ºC and stained with Propidium Iodide (PI) approximately two hours before flow citometry acquision.
ix) Senescence-associated β-galactosidade assay:
Cells growing exponentially were treated with Etoposide and the Senescence-associated β-galactosidade (SA β-gal) staining was done following the Senescence Cells Histochemical Staining Kit protocol using Nuclear Fast Red as counterstaining.
- 11 -
IV) RESULTS:
i) Cell line characterization:
In order to accomplish our objectives we had to first determine the doubling time and the duration of the cell cycle phases of the cell lines used in this project viz HCT116 wild type for p53 and p21 (WT), HCT116 p53 knock-out (K.O.) and HCT116 p21 knock-out (K.O.). To do so, we generated their respective growth curve, as well as, for HCT116 WT cell line a diagram of labelled mitoses. From each growth curve, we determined the doubling time of the respective cell line. For this reason we could establish the following doubling times:
HCT116 WT (p53 +/+ and p21 +/+): 15,16 hours (15h and 10min), (Fig. 6) HCT116 p53 K.O.: 16,61 hours (16h and 37min), (Fig. 7)
HCT116 p21 K.O.: 19,77 hours (19h and 46min), (Fig. 8)
Figure 6: HCT116 WT growth curve. HCT116 WT cells growing exponentially were plated and counted in a haemocytometer every 12 hours. Results were plotted on a log-linear scale. The population-doubling time was determined using the linear regression equation displayed on the graph. HCT116 WT cell line has a doubling time of 15h and 10 min.
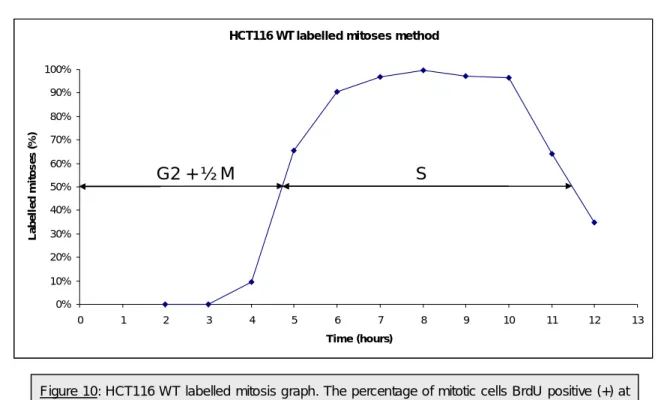
- 12 -
In what concerns the diagram of labelled mitosis it is convenient to explain in a little more detail the rationale behind the method. Labelled mitosis is a method of relating measurements on single cells to the cell cycle and consists on scoring labelled mitosis in samples collected at successive time points. In essence, we give a pulse of BrdU, which is a thymidine analogue that will only be incorporated by replicating cells [47] [48]. Afterwards we start sampling the cells at defined intervals and from each one of those intervals we count the number of mitoses that are
Figure 8: HCT116 p21 KO growth curve. HCT116 p21 K.O. cells growing exponentially were plated and counted in a haemocytometer every 11 hours. Results were plotted on a log-linear scale. The population doubling time was determined using the linear regression equation displayed on the graph. HCT116 p21 K.O. cell line has a doubling time of 19h and 46 min.
Figure 7: HCT116 p53 K.O. growth curve. HCT116 p53 K.O. cells growing exponentially were plated and counted in a haemocytometer every 11 hours. Results were plotted on a log-linear scale. The population-doubling time was determined using the linear regression equation displayed on the graph. HCT116 p53 K.O. cell line has a doubling time of 16h and 37 min.
- 13 -
BrdU-labelled under the microscope and determine the percentage of labelled mitoses (Fig. 9, Annex and Tab. 1). The principle behind this approach is simple since labelled mitoses can only emerge after cells that were transversing S-phase have progressed through G2 phase. The labelled mitoses do not come all at once since cells were at different S-phase stages in the beginning (Diag. 1, Annex). From the point where approximately all mitoses are labelled (which implies that all cells from the different S phase stages reached mitosis) we start to see a trough as cells that were initially in G1 come to the end of their cycle (Diag. 1, Annex). The duration of the different phases of the cell cycle is conventionally determined using the 50% points.
Therefore, the time between the start of the experiment and the 50% point in the ascending curve will correspond to the duration of G2 phase plus half the mitosis duration, the time between the 50% points in the ascending and in the descending portions of the curve correspond to S phase duration. The duration of G1 will be determined by subtracting from the total cell cycle time (time between two similar points in the curve) the duration of G2, S and M phases. The great advantage of this method is giving the absolute duration of the cell cycle phases although one should be careful not to use synchronous cells in this assay.
Time collection (after BrdU pulse) Number of mitotic cells Number of mitotic cells BrdU+ % Mitotic cells BrdU+ 2h 250 0 0 3h 250 0 0 4h 256 24 9.37% 5h 252 165 65.47% 6h 250 226 90.40% 7h 253 245 96.80% 8h 250 249 99.60% 9h 257 250 97.27% 10h 250 240 96.50% 11h 250 160 64% 12h 250 87 34.80%
Table 1: Percentage of HCT116 WT mitotic BrdU positive (+) cells at each time point. For each time point approximately 250 cells were analyzed and classified as either BrdU positive (+) or BrdU negative (-). The percentage of mitotic cells BrdU positive (+) was determined for each time point.
- 14 -
HCT116 WT labelle d mitose s method
0% 10% 20% 30% 40% 50% 60% 70% 80% 90% 100% 0 1 2 3 4 5 6 7 8 9 10 11 12 13 Time (hours) L a b e ll e d m it o s e s ( % ) G2 + ½ M S
HCT116 WT labelle d mitose s method
0% 10% 20% 30% 40% 50% 60% 70% 80% 90% 100% 0 1 2 3 4 5 6 7 8 9 10 11 12 13 Time (hours) L a b e ll e d m it o s e s ( % ) G2 + ½ M S
With respect to the HCT116 WT cell line, we could conclude that the G2 phase duration is 4h (4h 45 min minus 45 min of ½ M), the S-phase duration is 6h and 20 min and the G1 phase duration is 3h (Fig. 10). This last result was obtained resorting to the duplication time calculated from the growth curve of this cell line since the sampling intervals used in our BrdU labelled mitosis experiment did not allow us to reach the end of a complete cell cycle.
Beyond, we could also define the duration of the different phase stages given that S-phase BrdU positive cells display replication patterns that can easily be identify and scored to each stage. Using this approach, we were able to come up with the following results (Tab. 2):
Replication
Pattern Number BrdU+ cells Replication Pattern % Duration (hours)
1 97 36.7% 2.3
2 67 25.4% 1.6
3 54 20.5% 1.3
4 and 5 46 17.4% 1.1
All 264 100% 6.3
Table 2: Absolute duration of each S phase sub-stages in HCT116 WT cell line. For determination of the absolute duration of each S phase sub-stage 264 cells from the 2h time point were classified according to their replication pattern.
Figure 10: HCT116 WT labelled mitosis graph. The percentage of mitotic cells BrdU positive (+) at each time point were plotted in the graph and the 50% points in the ascending and descending portions of the curve were determined.
- 15 -
The first and second replication patterns are considered Early S-phase stages, the third is considered a Mid S-phase stage and, finally, the fourth and fifth correspond to Late S-phase stages [49].
Characterizing the biological material we intended to use in our project is of great
importance when defining our experimental work, and in this case, it proved to be an exceptional tool for other experimental approaches [50]. In addition, it is fundamental to assure the quality of the cell lines in order to perform successful experimentation. This becomes even more relevant given that a growing amount of evidence demonstrates that cell lines at high passage numbers in culture experience modifications in cell morphology as well as in growth rates and protein expression when compared to lower passage cells (e.g., ATCC Technical Bulletin no. 7, 2007).
ii) MTT cytotoxicity assay:
Cytotoxicity assays are widely used as a powerful tool to measure the effect of a certain drug on cell growth. The basis of the MTT assay consists of exposing cells in exponential growth to a cytotoxic drug (exposure time and drug dosage vary accordingly to the final goal of the experiment); after its removal, cells are allowed to proliferate for two or three doubling times so we can distinguish between cells that are not only viable but also capable of proliferation from cells that although viable cannot proliferate. The number of viable cells is an indirect measure of MTT dye reduction. In essence, MTT is a water-soluble yellow dye that is reduced by viable cells to a purple formazan product insoluble in aqueous solutions. The amount of product will be proportional to the number of viable cells and can be determined spectrophotometricaly after its solubilisation [51]. In light of this determination we can also obtain the half maximal inhibitory concentration (IC50) which is the drug concentration at which we reduce the population growth by 50%, in vitro. Therefore, we next determined the effect of different concentrations of doxorubicin and irinotecan in the growth of HCT116 WT, HCT116 p53 K.O. and HCT116 p21 K.O. cell lines. Exposure times to irinotecan and doxorubicin were 12 and 4 hours, respectively.
- 16 - Doxorubicin MTT assay 0.5 0.7 0.9 1.1 1.3 0 500 1000 1500 2000 Drug dose (nM) % s u rv iv a l HCT116 WT HCT116 p53 K.O. HCT116 p21 K.O. Irinotecan MTT assay 0.3 0.5 0.7 0.9 1.1 1.3 0 2000 4000 6000 8000 10000 12000 14000 Drug dose (nM) % S u rv iv a l HCT116 WT HCT116 p53 K.O. HCT116 p21 K.O.
Regardless some points in the graphs, which are incongruent with what was expected, the main reason for this assay was assessing the sensitivity of each cell line to each of the two drugs. Therefore, we could retrieve at least two very important hints from the two graphs: firstly, even a staggeringly high dosage of doxorubicin was not enough to reach the IC50 in any of the cell lines used (Fig. 11) and secondly, only an exaggerated dose of irinotecan seemed sufficient to achieve the IC50 in all the cell lines (Fig. 12). Nevertheless, it is important to notice that all the three cell lines seem to behave similarly with respect both to the doxorubicin and irinotecan drug
Figure 12: Determination of percentage survival after irinotecan treatment. Note that, with 3600 nM of irinotecan, HCT116 WT, HCT116 p53 K.O. and HCT116 p21 K.O. have an overall survival close to 70%. Figure 11: Determination of percentage of survival after doxorubicin treatment. Note that, with 500 nM of doxorubicin, HCT116 WT, HCT116 p53 K.O. and HCT116 p21 K.O. have not yet reached the IC50. The