UNIVERSIDADE DE ÉVORA
DEPARTAMENTO DE ECONOMIA
DOCUMENTO DE TRABALHO N.º 2005/16
September
Is FDI Taking the Orient Express?*
(this version: October 2004)
Carlos Vieira
Universidade de Évora, Departamento de Economia Isabel Vieira
Universidade de Évora, Departamento de Economia Aurora Galego
Universidade de Évora, Departamento de Economia
∗ This research is part of the project Ezoneplus (www.ezoneplus.org), financially supported by the European Commission’s 5th Framework Programme. Corresponding author: impvv@uevora.pt
UNIVERSIDADE DE ÉVORA DEPARTAMENTO DE ECONOMIA
Largo dos Colegiais, 2 – 7000-803 Évora – Portugal Tel.: +351 266 740 894 Fax: +351 266 742 494
Abstract:
Is foreign direct investment crossing Europe towards the East? During the last few years, news of foreign direct disinvestments have regularly emerged on the Portuguese media. The group of
suspects have been identified as the new European Union members, where low wages, low
corporate taxes and a highly educated labour force seems to attract multinationals eager to cut costs in an economy slowly recovering from recession. The clues of investment displacements abound, but no definite proof has yet been found in the empirical literature. This paper considers the available evidence, contributing to avoid possibly unfair incriminations.
Keywords: Foreign direct investment, EU Enlargement, Gravity model, FDI determinants, FDI
diversion
Introduction
The fifth enlargement of the European Union (EU) has been often heralded as a positive-sum game. Although the new EU members are expected to reap the largest benefits, the older members would also gain from an enlarged common market. Well, not all really. Many studies have highlighted Portugal as the expected looser from enlargement. Baldwin, Francois and Portes (1997) find Portugal to be the only incumbent country loosing, in net terms, from enlargement. They justify this loss with the importance of textiles in the Portuguese economy, the sector expected to be the most negatively affected. Breuss (2002) estimates that the Central and Eastern European Countries (CEEC) will gain, on average, ten times more than the older EU members, which would, with enlargement, increase real GDP by an average of around 0.5 per cent. However, he also estimates that the economic costs will surpass the benefits in three countries: Spain, Denmark and, especially, Portugal.
One of the main problems of the EU’s enlargement process for the Portuguese economy is the possible diversion of foreign direct investment (FDI) flows, especially in labour-intensive industries such as textiles, a traditionally strong Portuguese sector within the EU. Examples of diversion can, however, also be found in technologically more advanced sectors, such as in electronics and electrical machinery.
In fact, several distinct examples of FDI displacement from Portugal to the East have come to public, in sectors such as textiles, footwear, electric and electronic machinery. Some other investment projects have been reallocated to non-EU transition economies such as Romania, older EU member countries such as France, or even to countries outside Europe, like India and China. Unfortunately, to our knowledge, there is no consistent and detailed record of foreign disinvestments publicly available.
The countries of Central and Eastern Europe have soon realised the importance of attracting large flows of foreign investment to modernise their production structures, in the transition from centrally planned to market economies. Foreign investments are a vital source of financing for industry restructuring, increasing the country’s technological level of production and hence promoting higher economic growth. Being less volatile than portfolio investment, there is a much lower risk of investment reversals, with the dramatic consequences recently felt for example in South-East Asia and Latin America.
Sometimes considered an undesirable interference in the domestic markets, almost all governments worldwide now eagerly welcome foreign investments. Foreign investment laws have been revised and some special incentives offered. In Europe, the Irish
experience of an FDI-based development model, resulting in sustained strong growth during the last decade, stands as a much-quoted example. In Portugal, FDI inflows increased rapidly after accession to the, then named, European Economic Communities, partly sustaining economic convergence closer to EU levels. In 2002, the Portuguese government acknowledged the vital importance of foreign investment, creating the Portuguese Agency for Investment, presided by a former Finance Minister, with the aim of promoting abroad the advantages of investing in the country. More recently, the prospect of EU enlargement to the East, although welcomed in most political and economic circles, raised some concerns of possible disinvestments, especially by companies looking for lower production costs and/or a more central location in Europe.
This paper will examine the evidence of FDI diversion from Portugal, assess its relative importance and the potential economic consequences. Diversion may be impelled by low wages, together with geographical proximity, a more skilled labour force, and increasing integration in EU markets. The next section surveys the evidence produced so far in the literature. Following this, several distinct approaches will be applied to empirically assess the question. Section two takes an informal look at the data available, trying to uncover the major trends. Section three employs an econometric model to find the major determinants of FDI flows in these countries, using the estimates to test the hypothesis of diversion. Section four considers the indicators of FDI potential and FDI performance, provided by UNCTAD, to examine the recent investment dynamics in these countries. Finally, some conclusions are presented in the last section of the paper.
1. A review of the literature
During the last few years, several studies have approached from different perspectives the question of the potential diversion of FDI inflows from the Southern cohesion countries to the EU’s Eastern new members. Barry and Hannan (2001) claim that, during the nineties, FDI has indeed been diverted from the Southern European countries (Portugal, Spain and Greece) to the CEEC. Their conclusion is essentially based on cursory evidence of the evolution of FDI inward stocks during this time span, when CEEC inflows rose by a factor of 23, while increasing 2.3 times in the EU and only 1.7 times in the group of Southern cohesion countries. This diversion phenomenon is explained, according to the authors, by the business decisions to reallocate activities
from the low wage Southern EU members to the even lower wage countries of Central and Eastern Europe.
Braconier and Ekholm (2001) arrive at the same verdict of FDI diversion, also from observing simple trends in a firm-level dataset. They consider the particular case of Swedish multinational companies, and show that employment in these firms has decreased in Southern Europe during the 1990’s, while increasing by almost the same amount in the CEEC.1 The authors then proceed to a more formal, econometric analysis of wage competition between EU regions. Their estimated model suggests that affiliate employment in the CEEC is more sensitive to labour costs if firms also have affiliate activities elsewhere in the EU. However, some caution is obviously needed when generalising such conclusions, as the data sample contains only Swedish firms.
In a study particularly devoted to the effects of enlargement on the Portuguese economy, Crespo, Fontoura and Barry (2004) also suggest the possibility that the CEEC will directly compete with Portugal, and other cohesion countries, for the same investment projects. They compare the competitiveness level of these countries in various aspects relevant to foreign investors, and expose several weaknesses in the Portuguese position vis-à-vis the CEEC, notably at the government and justice levels, the rigidity of labour markets and the quality of human capital.
However, more formal analyses have not been able to uncover evidence of FDI diversion. Brenton, Di Mauro and Lucke (1999) employ a gravity model to examine the dynamics of bilateral FDI flows in a group of EU and non-EU states, introducing dummy variables for the Southern and the CEEC. They find no evidence that integration of new members in the EU, and the consequent increase of FDI inflows in those countries, has negatively affected FDI flows to the older members.
Buch, Kokta and Piazolo (2003) also employ a gravity model to estimate FDI determinants and forecast FDI stocks in the CEEC and in Southern Europe. By comparing expected and actual FDI values, they conclude that no FDI diversion has occurred between the two regions during the analysed time interval. This same conclusion had already been reached by these same authors (see Buch, Kokta and Piazolo, 2003), using FDI flows instead of stocks.
The same divergence of opinions occurs at the institutional level. The Portuguese central bank suggests that some reorientation of capital flows, namely to the Eastern
and Central Europe, has taken place (Banco de Portugal, 2004, p. 188). On the wake
1
of accession, the UNCTAD (2004, p. 72) has assertively assured that no significant diversion of FDI flows from the old to the new EU members has occurred. The global inflows of the ten new members have even decreased, from a share of 10.6% of the global inflows of the other fifteen members in 1995, to a share of only 3.5% in 2003. Given the obvious divergence of results in the literature, there is clearly space for further research on this issue, as new data becomes available and more robust results may be produced.
2. The dynamics of FDI flows
FDI inflows to the Portuguese economy grew considerably following the country’s adhesion to the European Communities in 1986. As may be seen in figure 1, relative inflows, which were always below 1% of GDP before the middle 80s, attained much higher magnitudes in the years that followed. Values reached 4% of GDP for the first time in 1991, probably due to the big investment of Ford-Volkswagen, and registered the peak value of around 6% in 2001. Since then, the weight of FDI inflows in the Portuguese GDP has hastily decreased, also prompted by the exhaustion of the privatisation process.
From 1998 onwards Portugal became a net exporter of direct investment funds, thus reversing its well established reputation has a net absorber of foreign capital. This reversal may be a result of both an increased international dynamics on the part of domestic agents, but also a relatively lower attractiveness of the Portuguese economy for foreign investors.
[Figure 1 about here]
In fact, although gross inflows have steadily increased until 2000, following the worldwide decline afterwards, disinvestment has grown sharply, leading to a considerable decrease of liquid FDI in the Portuguese economy in the last two years. (see figure 2).
In what concerns the CEEC, FDI has considerably increased, triggered by the transition process towards a market economy and the prospects of EU integration. From 1995 onwards, most of these countries have attracted rapidly increasing volumes of investment funds and some have even escaped the downward international decline trend in FDI in these last years. Due to a favourable geographical location and to a well established reputation as suppliers of cheap labour, these countries have often been accused of causing a diversion of investment projects from the poorer older EU members, such as Portugal.
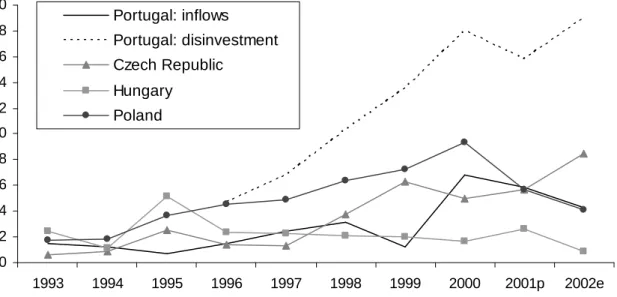
In terms of volume of the FDI inflows attracted, only the Czech Republic, Hungary and Poland are comparable to Portugal. However, the comparison of these countries’ inflows with those received by Portugal, and also with the level of disinvestments registered in the Portuguese economy, do not display clear evidence of FDI diversion (Figure 3).
[Figure 3 about here]
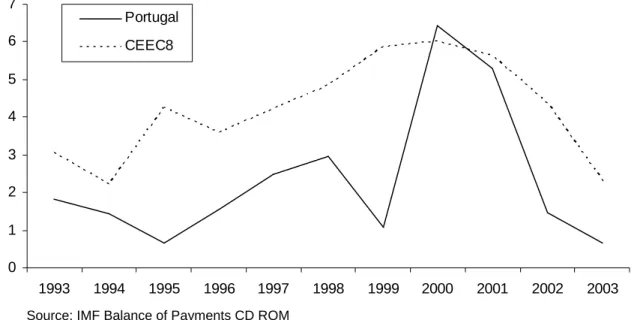
A distinct perspective is obtained by aggregating data and expressing it as a percentage of GDP, so that the differences in terms of countries’ economic dimensions are removed. Figure 4 presents FDI inflows has a percentage of GDP, in Portugal and in the eight CEEC that recently joined the EU. In spite of an almost symmetrical evolution in some years until the end of the 90s, the overall trend does not display significant differences, henceforth not suggesting diversion. Portuguese data briefly overtake those of the CEEC in the year 2000 and, from that year onwards, both series exhibit a sharp decrease. As Portugal, the new EU members also suffered a dramatic fall in 2003, primarily due to the end of the privatisation process in the Czech Republic and Slovakia.
[Figure 4 about here]
One important question when addressing the issue of possible FDI diversion is the identification of the main suppliers of funds. According to data from the Portuguese Central Bank and the Portuguese Ministry of Finance (Ministério das Finanças, 2003), from 1996 to 2001, the top three gross investors in Portugal were the United Kingdom, Germany and France. In terms of liquid investment, the ranking changes radically, with
Spain in the top position, followed by the Netherlands and the United Kingdom. The fact that Spain is the main investor in Portugal may suggest that the qualms of possible FDI diversion towards Eastern locations may be unfounded, but also indicates that, in what concerns FDI, geographical proximity is a significant aspect to consider. In this respect, it is important to stress that the Netherlands and Germany are also the first and second main investors in the three above mentioned CEEC. However, neither the Dutch, nor German data display evidence of net disinvestment in Portugal. On the contrary, in the case of Germany net FDI inflows increased from 1999 to 2001 (Ministério das Finanças, 2003: p.89).
In terms of sectoral allocation, FDI funds in Portugal are firstly directed at services and secondly at manufacturing. In recent years, there has been an increasing trend in flows to the tertiary sector and a decline in those directed at manufacturing. The latter has also coincided with a reallocation of foreign funds, out of labour intensive industries, and into more technologically sophisticated ones. Such trend, which is positive from the host country’s perspective, would be inevitable, with or without the Eastern enlargement of the EU. In fact, there will always be alternative locations more attractive from the point of view of labour costs.
3. The empirical analysis of FDI determinants
The aim of this empirical analysis is twofold: first, to study the determinants of bilateral FDI flows and, having obtained these, to use them to estimate FDI potential levels for several countries and compare them with current values. In order to achieve these goals, a gravity model is estimated using data for the period 1993-2000. The data sample includes fourteen investing countries and a total of twenty seven hosts, including Western and Eastern European countries.2
The estimation of the gravity model follows the methodology usually adopted in this area of research, thus allowing a suitable comparison of the obtained results with those of previous studies. The choice of the period of analysis was mainly constrained by the availability of reliable data. In spite of this, the time sample is adequate for the purposes of this analysis since it was only after the early nineties that an important increase in Western FDI inflows into the CEEC took place.
In an attempt to improve on many of the previous analyses, robust econometric procedures were adopted, in order to obtain more accurate results. There are several options in terms of specification in the estimation of a gravity model. In this empirical
analysis, panel data methods were employed, considering a two-way model with time and individual specific effects:
(1) Yijt =Xijt
β
+α
ij+γ
t +ε
ijt,where Yijt represents the logarithm of bilateral FDI flows over the population of the
destination country, in order to take into account the differences in size among the countries considered in the sample, and Xijt stands for the logarithm of explanatory
variables that are specific to both the origin and the destination countries. The specification also includes time dummies (
γ
t), to take into account business cycle effects. αij represents the unobservable fixed effect andit
ε
is the remainder stochastic disturbance term.Unlike most previous empirical studies, in this model αij represents bilateral common
effects, instead of country specific effects, to take into account all unobservable country-pair specific effects that are time-invariant and may affect FDI flows between two countries (geographical, historical, political, cultural and other factors). Some authors have concluded that this approach to the econometric specification of gravity models is more general and generates better estimates than the traditional specifications (see for example Egger and Pfaffermayer, 2000, or Cheng and Wall, 2001). Moreover, it is argued that the inclusion of bilateral common effects also provides better in-sample predictions, which is an important aspect to consider given the main objective of the present analysis.
Equation (1) was estimated in different specifications, within the following set of explanatory variables: the GDP per capita in the origin country (i) and in the destination country (j), (GDPcap), the population of both the origin (i) and the destination country (j), (pop), the degree of openness of the destination country, proxied by the ratio of external trade (exports plus imports) over GDP, (open), the relative compensation levels of the host country in relation to the compensation levels of the origin country, (CL),3 the geographical distance between the two countries’ capital cities, (dist), and a dummy variable taking the value of one when the countries share a common border, (Frontier).4 It is important to mention that, contrary to most previous empirical research,
3Compensation levels comprehend total hourly compensation for manufacturing workers, including wage and supplementary
benefits (World Competitiveness Yearbook, 1993 to 2000).
4Although developments in technology and communications have shortened the relative distance between countries, suggesting
that these variables are loosing importance and even raising doubts on the present validity of the gravity models, Eurostat data for 1999 suggests that EU firms still prefer to invest in geographically close countries: the Nordic investors prefer the Baltic countries, the Swedish investors supply mainly Estonia and Lithuania, Austrian and German firms contribute largely to Slovenia and the Slovak Republic, while firms in the Netherlands and Germany (the main investors in the CEEC), and also France, are important investors in Poland.
we analyse the relationship between FDI flows and the population and GDP per capita of investing countries, variables usually not considered in the tests.
Other variables which are usually employed in similar studies of FDI diversion to Eastern countries, such as labour force skills, country risk, measures of economic transformation or privatisation schedules, could not be used in this work.5 In fact, we are considering a panel data for a total of 27 host countries, consisting of both Western and Eastern nations, and therefore information about those variables is not consistently available for a satisfactory number of countries and years.
In a panel data model, if the common specific effects (αij ) are correlated with the
explanatory variables, a fixed-effects model should be adopted. On the other hand, if αij
are treated as random variables, then we have a random effects model. In the random effects model, the explanatory variables are assumed to be independent of αij,
it
ε
andt
γ
. The Hausman test was used to test this correlation. There was no rejection of the null hypothesis of no correlation between the common specific effects and the regressors. A random effects model may therefore be used, as the possibility of endogeneity of the explanatory variables was discarded, following from their correlation with the bilateral common effects in the model.Another possible source of endogeneity derives from the fact that the explanatory variables may be correlated with the idiosyncratic error term (
ε
it). In general, previous studies do not investigate this type of correlation, and the explanatory variables are assumed to be exogenous. In this work we have performed a sensitivity analysis, considering several combinations of variables as potentially endogenous and employing the instrumental variables estimator.6 The results were not much different from the ones obtained when considering all the variables as exogenous. Moreover, endogeneity tests did not reject the hypothesis of exogeneity of the variables. As a consequence, we estimate a random-effects model and use the Generalised Least Squares method to obtain consistent and efficient estimates. The results for the different specifications are reported in table 1.[Table 1 about here]
5Other explanatory variables, like the weight of the deficit on the country’s GDP and the inflation rate turned out to be not significant and therefore were not included in the specifications presented.
6 We considered the possibility of GDPcapi, GDPcapj, Open and CLij to be endogenous and used lagged values of these variables
It may be concluded that, although there are discrepancies in magnitude, the parameters’ estimates are not qualitatively different for most of the variables of interest included in the several specifications of the model. The results indicate that the GDP
per capita of the destination countryhas a positive influence on FDI inflows, whereas distance between countries seems to have a negative effect. In addition, there are suggestions that trade and FDI can be considered as complements, as the variable
open seems to positively affect foreign investment inflows.7 This result is not in accordance with some authors who claim that trade and FDI are substitutes. On the contrary, it corroborates the idea that FDI is associated with the intensification of production segmentation leading to an expansion of international trade.
Significant is also the fact that relative labour compensation levels exert a negative and significant influence on FDI. This supports the common notion that labour costs are a decisive factor of FDI attraction in some countries and productive sectors. On the other hand, the fact that both countries share a common border does not seem to affect the FDI flows significantly. The population of the host country is not significant, which is in accordance with the findings of previous studies and would obviously be expected as we are using FDI/POPj as the dependent variable.
Unlike most previous empirical analyses, however, our study reveals a positive relationship between FDI and both the population and the GDP per capita of investing countries. This positive relation suggests that the larger the economic and demographic dimensions, the higher the probability of entrepreneurs to engage in foreign investments. A possible explanation is that firms in larger and more populated countries have better possibilities of, inside their borders, reaching the minimum efficient scale necessary to support the structures for international expansion. Smaller and relatively less populated countries, with a relatively smaller potential demand, are less motivating and less capable of generating the suitable environment for the emergence of large-scale firms, which are most probably prepared to expand their activities at the international level.
These results suggest that, as the theoretical analyses indicate, both market and efficiency reasons influence the decisions to invest abroad. The positive relationship between host country’s GDP per capita and FDI flows imply that the hypothetical purchasing power of potential consumers is often considered by international entrepreneurs when deciding the international allocation of investment funds. This is obviously the case of those projects directed to the supply of foreign markets. Although
7 The degree of openness of the host country is statistically significant at the 1% level in the second model and significant at the
low labour costs often reflect low average productivity and/or a scarcity of skilled labour, a negative significant relationship between labour compensation levels and FDI emerges from the estimations, thus sustaining a rationale for efficiency seeking FDI. In fact, some projects are implemented abroad with the objective of reducing production costs and are therefore attracted to areas where labour is less expensive, independently of its inherent qualifications and/or productivity.
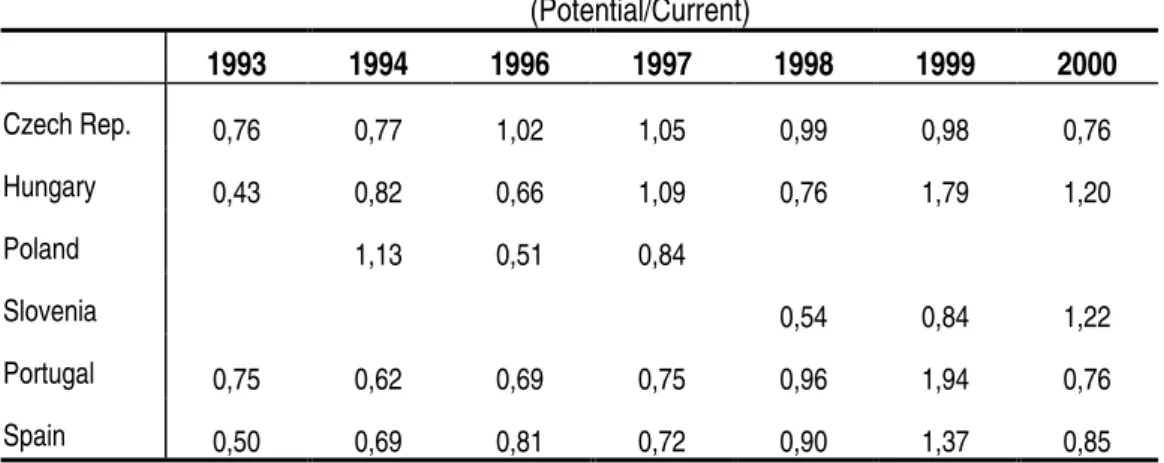
The estimation results, and more specifically those of specification (3), are used to perform in-sample predictions of FDI flows to Portugal, Spain, Poland, the Czech Republic, Slovenia and Hungary. The objective is to assess FDI diversion from the EU periphery to the CEEC, by comparing the potential and current flows to these countries. In order to calculate the expected FDI flows, only data from the major European investors (Austria, Germany, Netherlands and France) and from the United States and Japan are considered. The results of the ratio of potential FDI inflows to observed ones are presented in Table 2.
Due to a catching-up effect, considering that these countries still exhibit FDI stocks below the ones observed on average in the other EU members, it should be plausible to expect that potential values would be below the observed ones in the CEEC (values below unity in the indicator displayed in table 2). The same could be expected in the Iberian countries, although with lower magnitudes, given the fact that they also still hold values much lower than the EU’s average.
[Table 2 about here]
It may be concluded that most countries display a similar trend on the ratio between the potential and the current levels of FDI. Therefore, there is not much difference on the results for the several countries. In most cases the displayed values are below unity until 1998 (slightly lower for the CEEC, but not as much as expected), and above unity in 1999, declining significantly in 2000 (the exception being Slovenia). This latter result seems to be in accordance with international data on FDI flows, which reveal that there was a major decline on FDI flows in the year 2000 for most countries, being the Eastern countries and the Iberian countries an exception to this pattern. Therefore, we find no evidence of FDI diversion from the Southern countries to the CEEC in these years. This does not mean, of course, that this phenomenon has not been happening beyond the year 2000, or that it will not happen in the future as new developments unfold. These results are in accordance with those of earlier analyses, such as those of
Buch et al. (2001 and 2003), but not in line with those of Braconier and Ekholm (2001), who find diversion effects on employment.
4. Potential versus performance indicators
The comparison in the previous section between expected and actual FDI values may be complemented by contrasting two similar indicators recently presented by the UNCTAD (2002): the performance and the potential indices of FDI attraction. The performance index is computed by simply dividing the share of a country’s FDI inflows in the world global FDI by the share of that country’s GDP in the world’s GDP. A value of one would then indicate that this country attracts FDI in proportion to its economic dimension. Most CEEC and Cohesion countries present values above unity in the period 1998-2000, with a few exceptions revealing possible structural competitiveness problems in those economies.
On the other hand, the potential index is intended to measure each country’s potential to attract FDI, and it is computed as a simple weighted average of several structural variables, arbitrarily chosen, including some of those employed in the model estimated above (real GDP growth, GDP per capita, total exports, telephone mainlines, commercial energy use, R&D expenditures, students in tertiary education and country risk). However, no econometric analysis is performed to test each variable’s significance as an FDI determinant.
The relative position of each country, in terms of both indices, is plotted in Figure 5 for some EU members. The arrows indicate the evolution from the period 1988-90 to the period 1998-2000. The figure confirms that both the Southern countries and the CEEC share similar characteristics. All these countries increased their potential to attract FDI but, simultaneously, all worsened their performance between the end of the eighties and the end of the nineties.
[Figure 5 about here]
Remarkably, the situation is quite different in the Northern and Central EU members. In all these countries that are displayed in the figure, the potential indices have also increased but, at the same time, all were able to also augment their performance in attracting FDI projects. This raises the question of whether FDI in the South may be
diverted not to the EU new members, but to the Northern and Central EU older member states.
Conclusions
The prevailing perception that the recent process of EU enlargement may have displaced FDI projects from Portugal, and other Southern Cohesion members, to the newly arrived member states is consistently not confirmed by the quantitative analyses. Some possible explanations may be tentatively proposed. First, consistent and reliable data for these countries still cover a rather limited time span, so that econometric evidence of diversion may only emerge after new data arrive, also covering the post-adhesion period. Second, the investment projects actually diverted to the East, which sometimes appear in the media’s front pages, represent a small fraction of global FDI flows, too insignificant to be detected by the empirical tests. Third, it may be that FDI is not being diverted from the South to the East, but to other non-CEEC locations.
The effects of full EU membership on FDI reallocation are still not clear. First, the adoption of the acquis communautaire, namely in terms of labour and environmental policies, may imply some additional costs for firms. Conversely, it may reduce investment risks, ensuring more clear relationships between firms, investors and governments. Second, the new members will benefit from the EU structural funds, aimed at, among others, improving basic infrastructures and labour force skills. Third, most new members have recently implemented some measures aimed at promoting FDI, namely by liberalising some markets and reducing corporate taxes.
Competition over corporate taxes recently generated a live debate within the EU, with Germany and France in the forefront trying to establish minimum rates, fearing that the very low taxes in the new EU members might affect foreign investments in Central Europe. The older members are even threatening to cut development aid to the newcomers, arguing that such low corporate taxes suggest they do not need the money. In Portugal the basic rate is 27.5%, bellow that of the EU 15 average of 31.5%, but above the average of the new members – 21.5%. However, the general opinion seems to be that corporate taxes are not the main FDI attractor. Low wages are still considered to be the main Eastern attraction. In Germany, for instance, although corporate tax rates are almost two times higher than those in the new members, labour costs are between five and twelve times above labour costs in Eastern countries. Competition for FDI will increase in the European Union, and it will certainly be extremely difficult for Portugal to compete with the new EU partners to attract the same
type of FDI projects. Being an established EU member for almost twenty years confers some relative advantages for the Portuguese economy. It possesses better infrastructures, a more reliable legal and administrative environment, stronger purchasing power, and higher political and macroeconomic stability, namely from being already an EMU member. Obviously, some of these advantages may soon be eroded as the catching-up process in the new members evolves. Besides, Portugal also presents several important disadvantages relatively to the new EU members, affecting its ability to attract foreign investment. Most of these are of a more structural nature, and are difficult to surpass in the medium term: higher production costs in terms of wages and corporate taxes, more rigid labour laws (see, for example, Riboud, Sánchez-Páramo and Silva-Jáuregui, 2002), a less educated labour force, a smaller market, more distant from the EU’s centre.
The earlier role of the Southern EU countries as low wage destinations of FDI, lately assumed by the EU’s newcomers, is now being taken over by non-EU countries further East. Apparently, the Express continues heading towards the Orient. On the part of Portugal, there is however still time and scope for political measures aimed at strengthening its relative advantages as an attractive FDI destination.
References
BALDWIN, R., FRANCOIS, J. and PORTES, R. (1997) The costs and benefits of eastern enlargement: the impact on the EU and Central Europe, Economic Policy, 24, 125-170.
BANCO DE PORTUGAL (2004) Relatório do Conselho de Administração, Banco de Portugal.
BARRY, F. and HANNAN, A. (2001) Will enlargement threaten Ireland’s FDI Inflows?,
Quarterly Economic Commentary, December 2001, Economic and Social
Research Institute, Dublin, pp. 55-67.
BRACONIER, H. and EKHOLM K. (2001) FDI in Central and Eastern Europe: Employment effects in the EU, CEPR w.p. 3052.
BRENTON, P., DI MAURO, F. and LUCKE, M. (1999) Economic integration and FDI : an empirical analysis of foreign investment in the EU and in Central and Eastern Europe, Empirica, 26, pp. 95-121.
BREUSS, F. (2002) Benefits and Dangers of EU Enlargement, Empirica, 29, pp. 245-274.
BUCH, C., KOKTA, R. and PIAZOLO, D. (2001) Does the east get what would otherwise flow to the south? FDI diversion in Europe, Kiel Institute of World
Economics W.P. 1061.
BUCH, C., KOKTA, R. and PIAZOLO, D. (2003) Foreign direct investment in Europe: Is there redirection from the South to the East?, Journal of Comparative Economics, 31, pp. 94-109.
CHENG, I-Hui and H. WALL, H. (2001) Controlling for Heterogeneity in Gravity Models of Trade, The Federal Reserve Bank of St. Louis, Working Paper 1999-010B. CRESPO, N., FONTOURA, P. and BARRY, F. (2004) EU Enlargement and the
Portuguese economy, The World Economy, 27(6), pp. 781-802.
EGGER, P. and PFAFFERMAYR, M. (2000) The Proper Econometric Specification of the Gravity Equation: a Three-Way Model with Bilateral Interaction Effects, mimeo, revision requested by Empirical Economics.
EKHOLM K. and MARKUSEN, J. (2002) Foreign Direct Investment and EU-CEE Integration, background paper for the conference “Danish and International Economic Policy” held at the Institute of Economics, University of Copenhagen. Institute for Management Development, The World Competitiveness Yearbook, several
issues.
MINISTÉRIO DAS FINANÇAS (2003) Portugal no Espaço Europeu – o Investimento Directo Estrangeiro, Departamento de Prospectiva e Planeamento.
OECD (2002) International Direct Investment Statistics Yearbook, 1980-2000.
RIBOUD, M., SÁNCHEZ-PÁRAMO, C. and SILVA-JÁUREGUI, C. (2002) Does Eurosclerosis Matter? Institutional reform and labour market performance in Central and Eastern European Countries in the 1990’s, Social Protection
Discussion Paper Series n. 0202, The World Bank.
UNCTAD (2002) World Investment Report 2002: Transnational Corporations and
Export Competitiveness, United Nations.
UNCTAD (2004) World Investment Report 2004: The Shift Towards Services, United Nations.
Appendix: Data sources
FDI flows - OECD data on FDI outflows from Austria, Benelux, Denmark, Finland, France, Germany, Italy, Netherlands, Norway, Sweden, Switzerland, United Kingdom,
United States and Japan to a panel of countries that include all the present EU members, Japan, United States, Canada, Australia, Norway, Switzerland, Poland, Czech Republic, Hungary, Romania, Slovenia, Slovakia and Bulgaria, between 1993 and 2000 (whenever data is available) is used.
GDPcapi and GDPcapj – GDP per capita from origin country and destination country
Source: Chelem Database
popi and popj – population of both origin and destination countries
Source: Chelem Database
Distj – geographical distance in km between the countries’ capital cities
Source: http://www.indo.com/distance/
Frontier – dummy variable equal one if the countries share a common border
CLij – compensation levels of the host country in relation to the compensation levels of
the origin country
Source: IMD World Competitiveness Yearbook
All variables are in constant values (1990 US dollars).
Figures and Tables:
Figure 1 – Portuguese direct investment abroad and foreign investment in Portugal (10^6 euros) -1% 0% 1% 2% 3% 4% 5% 6% 7% 8% 1965 1969 1973 1977 1981 1985 1989 1993 1997 2001 FDI outflows FDI inflows
Figure 2: Foreign direct investment in Portugal (10^6 euros) 0 5 10 15 20 25 30 1996 1997 1998 1999 2000 2001 2002 2003 gross disinvestment liquid inflows
Source: Banco de Portugal
Figure 3 – FDI inflows in Portugal and in the major CEEC recipients (billions $)
0 2 4 6 8 10 12 14 16 18 20 1993 1994 1995 1996 1997 1998 1999 2000 2001p 2002e Portugal: inflows Portugal: disinvestment Czech Republic Hungary Poland
Figure 4 – FDI inflows in Portugal and in the EU new Eastern and Central members (% GDP) 0 1 2 3 4 5 6 7 1993 1994 1995 1996 1997 1998 1999 2000 2001 2002 2003 Portugal CEEC8
Source: IMF Balance of Payments CD ROM
Figure 5: Inward FDI Performance (horizontal axis) and Potential Indices, 1988-90 to 1998-2000 (UNCTAD) 0,2 0,25 0,3 0,35 0,4 0,45 0,5 0,55 0,6 0,65 0,7 0 1 2 3 4 5 Spain Portugal Slovenia Greece Poland Czech Rep. Hungary Ireland Austria Germany Finland Sweden Netherlands
Table 1: Determinants of FDI flows Random-Effects GLS Regressions (1) (2) (3) Variable Coefficient (Std. Err.) Coefficient (Std. Err.) Coefficient (Std. Err.) GDPcapi 3.492* (0.69) 3.337* (0.69) 3.769* (0.73) GDPcapj 0.951* (0.13) 1.089* (0.14) 1.698* (0.32) Popi 0.623* (0.12) 0.588* (0.12) 0.736* (0.13) Popj -0.175 (0.12) -0.022 (0.13) -0.038 (0.14) Openj _ 0.652* (0.22) 0.448 (0.24) Clij _ _ -0.616* (0.23) Distij -0.836* (0.17) -0.734* (0.17) -0.848* (0.17) Frontier -0.063 (0.48) -0.028 (0.47) -0.136 (0.48) Constant -37.581* (7.10) -38.084* (7.07) -48.459* (8.07) N 2177 2177 1674
Wald Test (all coeff. =0) 477.46* 488.45* 324.15*
Std. Deviation Residual 1.047 1.047 1.065
Hausman specif. test 19.15 20.04 19.07
All variables in logs. Dependent variable is the logarithm of FDI flows/POPj. Variables definition,
countries used in regression and data sources are displayed in the appendix. Year dummies were also included but not reported. (*) and (**) denotes values significant at 1% and 5% respectively.
Table 3: Potential and Current FDI Flows (Potential/Current) 1993 1994 1996 1997 1998 1999 2000 Czech Rep. 0,76 0,77 1,02 1,05 0,99 0,98 0,76 Hungary 0,43 0,82 0,66 1,09 0,76 1,79 1,20 Poland 1,13 0,51 0,84 Slovenia 0,54 0,84 1,22 Portugal 0,75 0,62 0,69 0,75 0,96 1,94 0,76 Spain 0,50 0,69 0,81 0,72 0,90 1,37 0,85