Introduction
Sulphur dioxide is commonly used in wine processing to inhibit chemical and microbial spoilage. The amount of SO2 in the final wine product is strictly controlled by legislation. Carbon dioxide can be present in young wines as a product of the fermentation, can indicate spoilage, and in the case of sparkling wines it is added to the wine in high concentra-tion. Both components are important in developing the organoleptic properties of the wines. Therefore, the levels of carbon dioxide and sulphur dioxide are routinely controlled in wineries.
The analytical methods usually used for these determina-tions are time consuming, often limited in the application range and sometimes affected by the loss of the analyte dur-ing the determination [1].
To automate these determinations, some flow injection methodologies have been proposed [2-11]. These methods involve the acidic conversion of the analytes, present in dif-ferent forms, to CO2 and SO2, and subsequent in-line sepa-ration of the gaseous species from the sample matrix, resort-ing to a gas-diffusion process. Afterwards, the analytes could be detected in the acceptor stream using either spectropho-tometric [2-7], electrochemical [7-9] or a chemilumines-cence detection [10,11]. Spectrophotometric detection of
CO2 is based on the decolorization of an acid base indica-tor in low capacity buffer stream. Although the reaction is not specific, the use of the gas diffusion process excludes the possible interference of most sample components, except sulphur dioxide, which also diffuses through the membrane. Spectrophotometric determination of SO2 was based on the colorimetric reaction of SO2 with formaldehyde and p-rosaniline [2,6,12]or p-aminoazobenzene [5], with iodine [7], or with malachite green [4]. Regarding electrochemical detection, potentiometry [7,9] and amperometry [8] were used.
The only flow injection system proposed for the simulta-neous determination of CO2and SO2in wines was described by Linares et al. [12]. A non-specific potentiometric detec-tion (pH measurement affected by both analytes) was com-bined with a spectrophotometric detection of SO2, and the concentrations were calculated using an empirical model.
In this work the objective was to develop one flow injec-tion system for the spectrophotometric determinainjec-tion of CO2 in Portuguese sparkling wines (Vinhos Verdes), avoiding the interference of sulphur dioxide, and another one capable of determining the two analytes with a single manifold. Spectrophotometric detection was preferred as it is more robust and it is usually available in routine control labora-tories.
77
Spectrophotometric determination of carbon dioxide
and sulphur dioxide in wines by flow injection
G.T. Atanassov, R.C. Lima, R.B.R. Mesquita,
A.O.S.S. Rangel
*and I.V. Tóth
Escola Superior de Biotecnologia, Universidade Católica Portuguesa, Rua Dr. António Bernardino de Almeida, 4200-072 Porto, Portugal
Abstract. Flow injection analysis (FIA) methods for the spectrophotometric determination of CO2and SO2in wines are described. The determination of CO2is based on the colour change of a low capacity buffer (containing an acid-base indicator) due to the dissolved carbon dioxide. The determination of SO2is based on the decoloration of malachite green by sulphur dioxide. Two FIA manifolds are presented; one for the determination of CO2in sparkling wines and another for the simultaneous determination of CO2 and SO2in table wines. The analytes are isolated inside the manifold from the sample matrix using gas-diffusion units. Regression equations (FIA versus reference methods) showed no statistical difference, at 95 % confidence level, between the two sets of results for both determinations; additionally, for the determination of CO2, recovery values between 93.5 % and 111 % were found. RSD lower than 4.5 % for SO2and 2.4 % for the CO2determination were found. The sampling rates achieved were: 30 h–1 for the uniparametric system and 40 h–1 for the biparametric system. The single determination manifold is applicable in the concentration ranges of 0.5 to 4 g L–1of CO
2, and the simultaneous determination manifold in the range of 0.25 to 3 g L–1 of CO2and 0.05 to 0.3 g L–1of SO2.
Key words. Carbon dioxide – sulphur dioxide – wines – flow injection – spectrophotometry.
*Correspondence and reprints.
Materials and methods
Reagents and solutions
Reagents with analytical grade and deionized water were used. A 10.0 g L–1stock solution of carbon dioxide was pre-pared by dissolving 9.55 g of NaHCO3in 500 mL of previ-ously boiled water. The standard solutions of carbon diox-ide in the range of 0.5 to 5 g L–1were prepared by rigorous dilution of the stock solution. The standard solutions for the simultaneous determination were prepared as combinations of CO2with SO2in the following compositions: 3 g L–1with 0.05 g L–1, 2 g L–1 with 0.1 g L–1, 1 g L–1 with 0.15 g L–1, 0.5 g L–1 with 0.2 g L–1 and 0.25 g L–1 with 0.3 g L–1, respectively. The standard solutions also contained 0.325 M of NaOH. The working standard solutions and the SO2stock solution of 1 g L–1 were prepared daily and the concentra-tion of the stock soluconcentra-tion of SO2 was determined by iodo-metric titration. The reagent solutions used in the flow injec-tion system were: 20 mg L–1malachite green in 6.25 10–3M KH2PO4; 0.094 M K2HPO4; 0.2 M H2SO4; 300 mg L–1 of H2O2 in 0.06 M H2SO4; 60 mg L–1of H2O2in 0.2 M H2SO4 and a 28 mg L–1of bromothymol blue in 0.1 mM carbonate buffer at pH = 7.8.
Instrumentation and flow injection procedure The flow injection systems depicted in figure 1 were com-posed of Gilson Minipuls 3 peristaltic pumps, a Rheodyne 6 port rotary valve, Unicam 8625 UV/Vis spectrophotometers equipped with Hellma 178011 flow cells and a Kipp & Zonen BD 112 recorder. The flow channels were constructed using Gilson poly-tetrafluorethilene (PTFE) tubing (i.d. 0.8 mm), Omnifit end-fittings and connectors and a Y shaped confluence. Gas diffusion units [13] with straight flow channels (35×2×0.5 mm and 70×2×0.5 mm) were used. The applied gas diffusion membranes were made of PTFE and poly-vinylidene fluoride (PVDF) (Millipore, GVHP09050).
Flow injection procedure for the determination of CO2 (Fig. 1A)
The sample was injected into a water carrier stream (Q2) and merged with the acid stream (Q3) containing hydrogen per-oxide. The two streams were mixed in the R1reactor. When the sample plug reached the gas diffusion unit, part of the free carbon dioxide diffused to the acceptor stream (Q1) of carbonate buffer containing the bromothymol blue. Inside the R2reactor the analyte produced a decrease in the pH of the buffer stream and the corresponding colour change of the acid base indicator was measured at the flow cell.
Flow injection procedure for the simultaneous determination of SO2 and CO2 (Fig. 1B)
The sample was injected into a carrier stream of water (Q3) and subsequently was mixed with a solution of sulphuric
acid (Q4) to convert all forms of the analytes to CO2 and SO2. The SO2 that diffused through GDU1 to the acceptor stream (Q1+ Q2) reacted with malachite green and caused the colour change of the solution.
In parallel, the portion of the sample, which remained in the donor channel, was mixed with the solution of H2O2 to eliminate the remaining SO2, which would interfere in the determination of carbon dioxide. The CO2 then diffused (GDU2) to the channel Q6 and caused an alteration of the pH of the solution and consequently a change in the colour of the acid base indicator.
Sample treatment
Before introduction in the flow system, the wines were treated with hydroxide to allow the determination of total SO2 and to fix the concentration of CO2. A 20 mL of 50 % w/w NaOH was added to bottles containing 750 mL wine.
Reference determination
The reference determinations [1] used for evaluating the quality of the results obtained by the FIA methods were: Ripper method for total sulphur dioxide, and a titration of alkalized CO2 with H2SO4 between pH 8.6 and 4.0 for car-bon dioxide.
Results and discussion
The different parameters of the systems were studied in order to achieve a good sensitivity in the expected determi-nation range. After preliminary experiments to set approxi-mate values for the manifold parameters, an univariate opti-mization procedure was followed. The values found are presented in figure 1.
CO2 determination
The manifold was optimized to be able to perform the deter-mination of carbon dioxide in the range of 0.5 to 4 g L–1for sparkling wines.
The injection volume was varied between 50 and 240µL. Sensitivity increased with increasing volumes, but the sam-pling rate decreased due to the longer time necessary to return to the baseline. Therefore, the volume of 100µL was selected for further experiments.
The decrease of the flow rate in the acceptor stream (Q1) from 3.3 to 1.2 mL min–1produced a higher sensitivity but lowered the sampling rate. Therefore, a compromise value of 1.7 mL min–1flow rate was used.
The length of the reactor (R1) was increased up to 50 cm to allow sufficient mixing. The effect of the length of the R2 reactor was studied in the range of 30 to 130 cm. The sen-sitivity improved up to 120 cm, and decreased for longer ones due to higher dispersion.
Two types of gas diffusion membrane materials, PTFE and PVDF, were tested. When the PTFE membrane was
used the sensitivity at the low concentration range (up to 1.5 g L–1) was higher than the one achieved with the PVDF membrane. However, the PVDF membrane presented higher resistance to the pressure difference between the two chan-nels; therefore this type of membrane was chosen to guar-antee better repeatability.
The sensitivity increased by decreasing the concentration of the carbonate buffer from 0.2 to 0.1 mM. The lower con-centration was more difficult to handle because of limited stability of the low capacity buffer, due to dissolution of atmospheric carbon dioxide, causing a considerable baseline
drift. Therefore, nitrogen was bubbled through the freshly prepared acceptor solution, and subsequently maintained in a closed bottle. This way, no significant sensitivity change was observed for one working day.
By increasing the bromothymol blue concentration in the acceptor stream from 10 to 30 mg L–1 the sensitivity aug-mented. However, when a 30 mg L–1 concentration was used, the baseline absorbance became too high (> 1.8), decreasing dramatically precision. The 28 mg L–1 concentra-tion was used in the subsequent experiments, yielding a sta-ble baseline reading at around 1.5 of absorbance.
Fig. 1. A. Flow injection manifold developed for the determination of carbon dioxide in wines, P: peristaltic pump; V: injection valve (100 µL); Qi: reagent streams; Q1(1.7 mL min–1): 28 mg L–1bromothymol blue in 0.1 mM carbonate buffer; Q
2(0.8 mL min–1): H2O;
Q3(1.4 mL min–1) 60 mg L–1 H
2O2in 0.2 M sulphuric acid solution; Ri: reactors; R1: 50 cm; R2: 120 cm; GDU: gas diffusion unit; λ:
spectrophotometer (614 nm); W: waste. B. Flow injection manifold developed for the simultaneous determination of SO2 and CO2 in wines, Qi: reagent streams; Q1 (0.8 mL min–1): 20 mg L–1 malachite green in 6.25 10–3 M KH
2PO4; Q2(0.8 mL min–1): 9.4 10–2 M
K2HPO4; Q3 (0.8 mL min–1):H
2O; Q4 (1.3 mL min–1): 0.2 M H2SO4; Q5 (0.3 mL min–1): 300 mg L–1 H2O2 in 0.06 M H2SO4; Q6
(1.7 mL min–1): 28 mg L–1bromothymol blue in 0.1 mM carbonate buffer; λ
i: spectrophotometers, λ1: 614 nm, λ2: 617 nm; Ri: reactors;
The effect of the acid concentration (Q3) on the sensitiv-ity was measured by increasing the concentration of the sul-phuric acid in the range of 5 10–3M to 0.5 M. Over 0.2 M the sensitivity in the desired concentration range (up to 5 g L–1) did not change. Therefore, for the further experi-ments a 0.2 M solution was used.
The reaction on which the determination is based is about 5 times more sensitive for SO2 than for CO2. Therefore, even in the presence of a small amount of SO2 in the wine, the CO2 result can overestimated. To overcome this prob-lem, hydrogen peroxide was used to oxidise SO2 to SO42–. As sulphate does not pass through the gas diffusion mem-brane to the acceptor stream, the interference is avoided. To assess the necessary amount of hydrogen peroxide, its con-centration was increased until there was no peak recorded for the injection of 0.3 g L–1 SO
2 standard solution, as this should be the maximum amount of this analyte in the wine samples [14]. It was found that a 60 mg L–1 concentration of hydrogen peroxide was sufficient for this purpose. As the peaks recorded for the CO2 standards had the same height in the presence or the absence of hydrogen peroxide, it indi-cated that this amount of hydrogen peroxide had no effect on the CO2 determination.
Simultaneous determination of SO2 and CO2
Based on the optimized system for CO2, the injection vol-ume, the flow rate and the concentration of the acid stream was kept constant. The part of the system corresponding to the CO2 determination was not changed.
The implemented method for the determination of SO2 was based on the one described by Sullivan et al. [4] and modified to achieve the desired working concentration range (between 0.05 and 0.3 g L–1SO
2).
The effect of the concentration of the malachite green was studied between 2 and 24 mg L–1. The sensitivity increased with the concentration of the reagent; however, the intense colour of the solution did not allow using higher concentra-tions. The 20 mg L–1 solution provided a stable baseline reading at around 1.5 of absorbance.
The effect of the acceptor stream flow rate (Q1+ Q2, Q1= Q2) was studied in the range of 1.0 to 2.6 mL min–1,
sensitivity increased with lower flow rates therefore, 1.2 mL min–1was chosen as a compromise value.
The configuration of the gas diffusion unit was selected to provide a good sensitivity. The sensitivity increased with the length of the flow channel; meanwhile when the zigzag configuration was used, the calibration curve became more affected by the other (CO2) component diffusing through the membrane.
The length of the reactor R3 was tested in the range of 30 to 200 cm. Since no significant change in sensitivity occurred between 50 and 150 cm, a 50 cm length, which produced higher sampling rate, was chosen.
Application to wine analysis
Under the selected conditions, the performance of the flow injection methods was tested, and some of the important characteristics of the systems are presented in table I. Determination of CO2 in wine
The proposed method (A) was applied to the determination of CO2 in 13 samples of carbonated Portuguese wines, and the values (in g L–1) were compared with those obtained by the reference method, involving titration of alkalized CO2 with H2SO4 between pH 8.6 and 4.0. A linear relationship (CFIA= C0 + S×CReference) was established, and the values for intercept (C0), slope (S) and the correlation coefficient were 0.018 (±0.230), 0.990 (±0.086) and 0.9916 respec-tively, where the values in parenthesis are the limits of the 95 % confidence intervals [15]. These figures demonstrate a good agreement between the two methods.
Recovery studies were also carried out to assess the accu-racy of the developed method in a wider application range. Three wine samples whose carbon dioxide concentration corresponded to three different ranges of the analysed sam-ples were used. The CO2was added to the wines in the form of NaHCO3 corresponding to three different levels of CO2 concentration: 0.5, 1.0 and 1.5 g L–1. The results obtained are presented in table II. When statistical test (t test) was used the results showed that the added and the recovered amounts were not different at 95 % significance level; the calculated t value was 1.368 corresponding to a critical t value of 2.306.
Table I. Some figures of merit of the developed systems.
CO2system CO2/ SO2system CO2 SO2 Repeatability a) (RSD %) 1.91 (0.61 g L–1) 1.5 (0.81 g L–1) 4.5 (0.079 g L–1) 0.82 (2.33 g L–1) 2.4 (1.4 g L–1) 3.9 (0.084 g L–1) 1.06 (2.74 g L–1) Determination range (g L–1) 0.5-4.0 0.25-3.0 0.05-0.3 Sampling rate (h-1) 30 40
Simultaneous determination of CO2 and SO2 in wine
The developed method (B) was applied for the determina-tion of CO2and SO2in Portuguese wines. The results of the SO2 determination were compared with the results obtained by the Ripper method, while the result of the CO2 determi-nation were evaluated by a two level recovery study. The results obtained for the analysis of SO2in six red and white wines are summarized in table III. The comparison of the results (in mg L–1) obtained for the determination of SO
2 with the developed FIA method (CFIA) and with the refer-ence method (CReference) showed a good agreement as can be perceived from the parameters of the regression equation: CFIA = –0.718 (± 12.3) + 1.002 (± 0.110)× CReference, R = 0.997. The values in parentheses are the limits of the 95 % confidence intervals. The recoveries obtained for the CO2 determination showed acceptable accuracy as well. A repeatability study is presented on figure 2.
Conclusions
The developed method for the determination of CO2 and SO2 can be quite useful for wine companies, as its allows to monitor both components with the same manifold. No sample pre-treatment is required, which is an advantage over a previous work [12]. It should also be enphasized the pos-sibility of monitoring spectrophotometrically CO2 in the
presence of SO2, just by adding hydrogen peroxide to the samples inside the flow system.
Table II. Recoveries obtained when 0.5, 1.0 and 1.5 g/L of CO2 was added to three different wines.
Recovery, %
No addition, g L–1 1st add. a) 2nd add.b) 3rdadd. c)
0.61 100 98.0 98.8 2.27 98.0 102 103 2.74 96.0 96.7 94.7 Addition of a) 0.5 g L–1, b) 1.0 g L–1and c) 1.5 g L–1CO 2in the form of sodium carbonate.
Table III. Simultaneous determination of CO2and SO2levels in wines by the developed manifold.
CO2 SO2
No addition Recovery % FIA Ripper meth. RD % c)
mg L–1 1stadd.a) 2nd add.b) mg L–1 mg L–1 432d) 96.6 93.5 111 112 –0.89 820d) 108 97.4 102 108 –5.5 475d) 102 99.6 87.4 84.8 3.1 288e) 101 99.8 94.6 93.6 1.1 801e) 110 111 64.6 65.3 –1.1 176e) 175 0.06
a)Addition of 500 mg L–1,b)addition of 1000 mg L–1CO2in the form of carbonate; c)relative deviation; d) White table wines; e) Red table wines
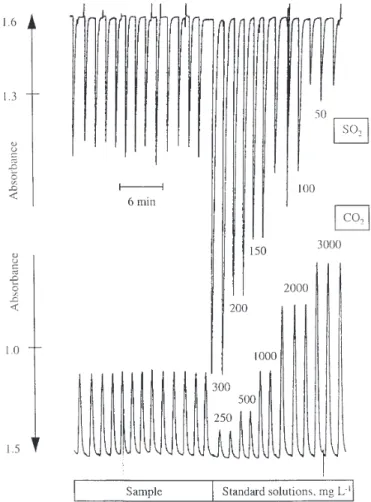
Fig. 2. Recorder output of the simultaneous determination of CO2 and SO2, corresponding to the injection of a set of standards and a sample injected 13 times.
Acknowledgements
I.V. Tóth thanks the grant PRAXIS XXI/BD/5643/95. G. T. Atanassov thanks TEMPUS SJEP 09841-95 programme. Collaboration of the Sociedade dos Vinhos Borges, S.A. is also acknowledged.
References
1. Amerine, M. A.; Ough, C. S. Methods for Analysis of Must
and Wines; New York: John Wiley, 1980, pp 200-212, pp
278-282.
2. Falcone, F.; Maxwel, K. C. J. Agric. Food Chem. 1992, 40, 1355-1357.
3. Tecator. Determination of total carbonate in beverages (refreshing drinks, sparkling wines, etc.) by flow injection analysis. Application note, ASN 66-21, 1983.
4. Sullivan, J. J.; Hollingworth, T. A.; Wekell, M. M.; Newton, R. T.; Larose, J. E. J. Assoc. Off. Anal. Chem. 1986, 69, 542-546.
5. Bartroli, J.; Escalada M., Jorquera, C. J.; Alonso, J. Anal.
Chem. 1991, 63, 2532-2535.
6. Mataix E., Luque de Castro M. D. Analyst, 1998, 126, 1547-1549.
7. Shi, R.; Stein, K.; Schwedt, G. Deutsche Lebensmittel
-Rundschau 1996, 10, 323-328.
8. Granados, M.; Maspoch, S.; Blanco, M. Anal. Chim. Acta 1986, 179, 445-451.
9. Araújo, A. N.; Couto, C. M. C. M.; Lima, J. L. F. C.; Montenegro M. C. B. S. M. J. Agric. Food Chem. 1998, 46, 168-172.
10. Burguera, J. L.; Burguera, M. Anal. Chim. Acta 1988, 214, 429-432.
11. Huang, Y. L.; Kim, J. M.; Schmid, R. D. Anal. Chim. Acta 1992, 266, 317-323.
12. Linares, P.; Luque de Castro, M. D.; Valcárcel, M. Anal. Chim.
Acta 1989, 225, 443-448.
13. Van der Linden, W. E. Anal. Chim. Acta 1983, 51, 359-369. 14. Office International de la Vigne et du Vin (OIV) Recueil des
Méthodes Internationales d’Analyse des Vins et des Moûts;
OIV: Paris, 1990.
15. Miller, J. C.; Miller, J. N. Statistics for Analytical Chemistry Ellis Horwood: New York, 1993, 3rd ed., pp 120-124.