Risk management Tools in the context of Common Agriculture Policy- Dairy Market
Ângela Cristina Cunha Luis 30698
A Project carried out on the Master in Finance Program, under the supervision of: João Pedro Pereira
1
Table of Contents
Abstract ... 3
Introduction ... 3
Risks faced Nowadays ... 4
Climate change Impacts ... 4
Future tendencies in Climate Change ... 7
Risk Management tools ... 8
Origins of Risks ... 8
Risks faced in Agriculture ... 9
Strategies to reduce risks ... 10
Common Agricultural Policy Brief History of CAP creation ... 13
CAP Reforms ... 14
Present CAP instruments ... 17
Methodology ... 22 Results ... 24 Conclusion... 27 References ... 28 Appendix ... 34
List of Figures
Figure 1……….. 35 Figure 2……….. 25 Figure 3……….. 36 Figure 4……….. 26List of Tables
Table 1……… 34 Table 2………...…. 35 Table 3……… 36 Table 4………...……. 37 Table 5………...…. 38 Table 6……… 392
Abbreviation List
CAP - Common Agriculture Policy CBT -Chicago Board of Trade
CMO - Common organisation of the markets
EAFRD - European Agricultural Fund for Rural Development ECSC - European Coal and Steel Community
EU - European Union
GATT - General Agreement on Tariffs and Trade GHG - Greenhouse gas emissions
LAG - Local Action Group
LEADER - Liaison Entre Actions de Développement de l'Économique Rurale MGQs - Maximum Guaranteed Quantities
MS - Member State
OECD - Organisation for Economic Co-operation and Development RDPs - Rural Development Programmes
SAP - Single Area Payment SFP - Single Farm Payment SMP - Skim Milk Powder
UNEP - United Nations Environment Program WHO - Word Health Organization
WMO - World Meteorological Organization WWF - World Wildlife Fund
3
Abstract
This essay provides an introductory approach concerning environmental and consequently the agricultural risks faced currently, it also discusses the main causes, present consequences and also the tendencies for the future risks. It addresses the Common Agriculture Policy (CAP) history and its instruments. It also describes the current risk management tools under CAP to deal with risks possessed and its past implementation in dairy market (2014-2016). Lastly, it studies the potential effectiveness of such policies, a regression analysis was conducted wherein the dairy market prices were regressed by various variables (risk management tools) to determine if risk management tools had any influence on the prices.
Introduction
Having done a Research Internship at European Court of Auditors, I had the opportunity to work with Risk Management tools of the Common Agriculture Policy.
In this essay, I will approach the current environmental challenges triggered by climate change that have drastic consequences. I have focused specifically on agriculture.
After which I have put forth the discussions on risk, its origins and how they affect agriculture in general and the current strategies taken up by the European Union to mitigate the risks at either farmer level or at the level of the Member States.
I go on to briefly analyse the history of CAP, its most remarkable reforms and its current instruments under Pillar I and Pillar II. It carries a lot of importance at the EU since it takes up 45% of EU budget.
Subsequently I have analysed the Dairy market, the history of milk quotas and on the milk quotas abolition that happened in 2015. I have also discussed as to how the
4
Russian ban on the EU products that affected the prices and also how China’s decrease of demand in 2014 affects the prices of the Whole Milk Powder.
Regarding the methodology of the study I studied the effect of risk management tools of the CAP in order to mitigate market disruptions caused by various factors in the dairy sector. The Dairy market risks are mitigated at the farmer level with the usual EU subsidies, direct payments under Pillar I and at EU level with had hoc measures, the exceptional measures of 2014 to 2016, as demonstrated on Table 2 appendix.
In order to study these two risk management instrument’ effects, a regression analysis was utilized with milk subsidies and exceptional measures as independent variables. First regression gives emphasis on the milk subsidies. While second studies the effect of exceptional measures. Thus, the effects of these instruments on the milk prices was studied, the milk price variable here is used as a proxy to the dairy market. The regression analysis also included fuel and fertilizer prices as these variables act as costs. The fuel prices specifically had a huge impact on the farming sector as a result of the financial crisis of 2007. The other market variables were EU milk production and historical exportations to Russia and China. And a reinforcing regression was conducted to further the impact of the above two variables by measuring their effects simultaneously.
Risks faced Nowadays
Climate change Impacts
Climate Change consists in a deep change of the normal state of climate and it could be due to natural and human actions. By natural action we intend for example Earth’s Orbit, Solar Radiation and atmosphere composition, whereas human action mainly refers to Greenhouse gas emissions (GHG), urbanization and deforestation
5
(WMO, 2010). Concerning GHG emissions. GHG englobe three most environmental damaging corresponding to 98% of the total emissions: carbon dioxide (CO2), methane
(CH4) and nitrous oxide (N2O). CO2 emissions, caused by fossil fuel’s combustion for
energy production (equal to 2/3 of total energy production) represent around 75% of the total GHG emissions. The second largest group of GHG emissions are CH4 emissions,
which are more harmful than CO2, around 25 times more potent in a century period
(OCDE, 2012; WMO, 2010). CH4 emissions come from fossil fuel production, current
practices of farming, waste management, biomass burning, oceans, and many others as wildfires (OECD, 2018). Lastly, N2O emissions, even though representing the lowest
percentage in GHG composition, are the ones from this sample that last longer in the planet (around 120 years) and are considered more than 310 times warming potent than CO2 in a century. Nowadays, GHG emissions are increasing and in response to that, the
average annual climate catastrophes worldwide have been growing significantly (WMO, 2010). For instance the average catastrophic events from 1980-1989 were 335, and this number more than doubled in the period 2002-2011, reaching the average of 716 events per year (EASAC, 2013).
Regarding deforestation, one of most worrying examples is the case concerning the Amazon which caused the destruction of 20% of Amazon biome. The World Wildlife Fund (WWF) estimates that more than a quarter of the current fauna and flora will disappear within 12 years if this rate of deforestation is maintained and no preventions are taken(WWF, 2018).
The natural catastrophes due to human actions affect us in an extremely evident way. An alarming study of Hawkins et al., (2017) shows that the increase of global temperature from preindustrial period (1850-1900) when the temperature was 0.65 ºC
6
until nowadays was more than 0.7ºC It has been a worrying subject since already in 2015 Paris agreement temperature achieved 1.5ºC. Last summer’s August (2018), which was the warmest in Europe, is the result of greenhouse gases emissions increase. This heat caused damaging fires all around the world, from Greece (Athens) to Iberian Peninsula, to USA and Canada (WMO, 2018). And winters are getting more rigid , we can recount 2009’s and 2010’s winters in Europe which have been incomparable colder than the previous ones. Furthermore, the first decade of this century has been the one with more precipitation since 1901. These natural disasters are having massive impacts in human life, for instance, from 2005 to 2014 they have caused around 840 thousand deaths (IFRC, 2015).
According to the United Nations Environment Program (UNEP) environment degradation was the cause of 12.6 million deaths in 2012, which means 23% of total number of deaths around world (UNEP, 2016; WHO, 2016). The majority of deaths are caused by diseases linked to environment degradation, amongst the most communes: Diarrhea that accounted for roughly 530,000 deaths a year; Malaria that caused around 438,000 deaths on 2015 and still accounts 3.2 billion people worldwide on risk of it (Unicef, 2018a) ; exposure to indoor air pollution (e.g. pneumonia, pulmonary disease) that every year cause around 2million deaths (Unicef, 2018b). These diseases are mainly associated with the lack of potable water and hygiene, air pollution and the use of solid fuels for cooking, and the deficiencies concerning water waste and land’s management (OCDE, 2012).
Air pollution represents the highest cause of death; the United Nations Environment Programme estimates that every year 7 million people worldwide die because of exposition to poor quality air (garbage, industries, transportation, wildfires) (OCDE,
7
2012). The second cause of deaths is the lack of potable water, since around world every year it causes 3.5 million deaths. This data is even more astonishing if we consider that in the era of water shortage just 20% of produced wastewater worldwide is treated (UNEP, 2016).
Climate change has an armful impact on human life also because it is accelerating land destruction, every year 12 million hectares of productive farm land gets either degraded or deserted in a world with more than 7 billion people and with an expected population of 11 billion by 2100 (UN, 2015; WMO, 2010).
Future tendencies in Climate Change
If climate changes maintain the current path it is expected to decrease water availability which will lead to millions of people facing water stress. With less water it will increase drought in mid and semi-arid low latitudes. Increase of wildfires, more accentuated species migrations and increase of risk of extinctions and some resultant extinctions. In agriculture it is expected to present a decrease of productivity in cereals.. We, as human beings will face increase of morbidity and mortality as result of mainly heat waves, floods, droughts and diseases as well (OCDE, 2012).
Achieving environmental goals
Governments are well aware of the importance and the impacts of climate change and in 2015’s Paris Agreement countries agreed to change the path of climate change, keeping the increase in global average surface temperature of Earth below 2 °C above pre-industrial levels (OCDE, 2017). However, according to 2015 OCDE report Investing
8
in Climate, Investing in Growth the national commitments of countries participating to
the Paris Agreement even fully implemented, will not be enough leading to an increase of the global average temperatures of 3 degrees Celsius. If countries will not change their rate of emissions cause by fossil energy in the next 15 to 30 years, it will be impossible to achieve the goal of Paris Agreement (OCDE, 2017).
A solution proposed by the OECD, Organisation for Economic Co-operation and Development, is that could take advantage of the currently low real interest rates , and allocate their investments to low carbon infrastructures with low impact on GHG emissions. In fact, it is important that leading economies start adopting low-carbon practices since just G20 are responsible for 80% of the world’s emissions.
Risk Management tools
Origins of Risks
Kaplan and Garrick (1981) gave examples of different kinds of risk as business risk, social risk, economic risk and military risk. According to the authors risk englobes the uncertainty and the damage that can be faced. A risk is associated with an uncertainty in the outcome that negatively affects the output. A risk can be independent or correlated to other risks. If the risk is linked to other risks, it is defined as a systemic risk an example could be the price of product and concerning production. On the opposite, if the risk is not correlated and independent from others risks it is called idiosyncratic risk and an example could be an injury of a farmer or employee (OCDE, 2009).
Risks can be classified by their probability of occurrence and magnitude of their loss. Concerning the probability of occurrence, risks can be classified as systematic if
9
they occur more than once. In this way it can be estimated their probability of occurrence and if they affect overall market of the farmers subjected to the same conditions. An example could be the variance in productivity according to weather events as drought and floods. On opposite non-systematic risks are irregular and for these risks it is not possible to estimate a probability., Moreover they are tied to specific regions and thus, do not affect overall market of farmers. However, this risk can be reduced when the farmer diversify his portfolio (Daniel and Featherstone, 2001; OCDE, 2009).
Risks faced in Agriculture
According with Musser and Patrick (2001) there are five more important sources of risk, the first one is production risk and it englobes the variation in production in crops and livestock caused by weather diseases and pests, thus exact quantity and quality of output is not known in the beginning of process. The second is the market risk, that englobes variation of prices commodities and this way interferes with hedging strategies. The third one is the financial risk which englobes the ability to pay bills and maintain production until receive the income, thus survive bankruptcy. The fourth one is the legal and environmental risk that considers the possibility of lawsuits started by a range of individuals or other businesses and also the changes in laws by responsible entities that will imply changes in agricultural practices. The fifth one is related with the resources risk due to the uncertainty in the event of employee’s or his family’s illness, divorce, death or others. Additionally, Moschini and Henessy (2001) talks about sources of uncertainty instead of risk and also refers technological uncertainty when evolution in production could make past investments outdated.
10
Between the above risks mentioned, common literature suggests that the most important risks in agriculture are production and market risks. Price risk is most of the times systematic because it alters the price change for all farmers in market. On the opposite production risk is most the times idiosyncratic in situations of hail, rain, floods, drought and others. However it can become systemic when catastrophic events affect all region (OECD, 2009).
Strategies to reduce risks
Managing risk in agriculture is complex and englobes three main phases. The first one deals with the quantification of the impact of the risk and its variability either from year to year or within different farmers. The second phase is to study the best risk management tool to deal with risk faced. It is important as well to study the relation towards risk faced by farmer, since not all farmers have the same behavior against risk, or at least they have different degrees of it. The last phase is to elect the best strategy to improve the risk management.
Concerning the quantification of risk and its variation, the most important risks are production and market (price). Price is more known throughout the markets and thus there are less information asymmetry and can be reduced with futures, forwards or options. However, production risk is more difficult to measure and it leads to existence of asymmetry information and adverse selection due to the existence of high and low risk agents which is private information and is difficult for agencies to get that type of information (Prescott and Townsend, 1984; OECD, 2009). Depending on their degrees of damage, risks can be classified as normal, market and catastrophic risk. A normal risk implies low costs, but it is frequent and can be diversified by farmer with different
11
allocation of land, diversification of crops or activities and preventions measures as irrigation. A market risk implies higher costs, middle frequent and require use of market instruments which englobe insurance and futures markets, however not all risks can be insurable because of lack of information and information asymmetry. Catastrophic risks are the ones less frequent but cause higher damage and government may interfere with ex ante or ex post measures. Regarding the study the best risk management tools for normal risk have already been stated above. In case of market and catastrophic risk as the costs are significantly higher it involves additional strategies which are beyond the control of the farmers (OECD, 2009).
Common strategies to reduce risk at farmer level are allocation of land, production diversification, change of techniques and inputs (OECD, 2009).
Concerning market instruments to reduce risk, the two most common are insurance, futures and forward contracts. Forward contract consist in an agreement about price and quantity between farmer and buyer. In this case, the farmer is protected against the quantity and price he hedged and if he hedges all the quantity he knows he will sell all the quantity for that price. A future contract is a standardized forward traded not just between a farmer and a seller but in an organized exchange such as the Chicago Board of Trade (CBT). Buyers will assume long position while the seller will assume short position. The delivery of the commodity do not have to be realized (Bodie et al., 2014). An insurance contract can transfer risk of extreme weather events on crops and usually these contracts depend on government support through subsidies since it has high transaction costs (Barnett and Mahul, 2007). With insurance farmers pay every year a premium and it gives the right to receive protection in case of losses associated with risk
12
farmer took, for example if he subscribed insurance against hail in case of occurrence and cause high costs farmer will receive indemnity (OECD, 2009).
In case of occurrence of catastrophic events, that usually are systemic, affecting a huge number of individuals. From an economic outlook it happens when government aid is needed and activated. This aid is divided in ex ante and ex post measures (OECD, 2009). As ex post measures, governments in OECD countries, implement a tax system smoothing that states that the poorest farmers pay at a lower rate and it permits that all farmers pay according to the income of that year, which means that for example if one year a climate disaster affected production of farmers this year they do not pay taxes and they would pay in the next year. It can as well permit that farmers pay a rate every year of the average income. In this case they do the average income for years and then it is settled the tax rate (OECD, 2009, 2010). Governments also offer countercyclical programs which are based on usually prices indicators, so in years with high prices these programs offer lower support and vice versa, however sometimes despite government effort it does not target farmers with low income (OECD, 2011). Following years 2005 some countries provided ad hoc measures, preferential credits and debt restructuring. European union have taken programmes to compensate farmers for high input costs that were faced during and after financial crisis of 2008, mainly fuel costs (OECD, 2011). As
ex ante, in New Zealand and other OECD countries there are fund stipulated to research
and control in pests, diseases and border control, this means that in case of significant losses to farmers in these situations they are refunded as well (OECD, 2007).
Lastly, in EU, in order to manage agricultural risks, Measure 17 of the Rural Development Programmes (RDPs) was created in the year 2013 under the following legislation, Articles 36 – 39 of Regulation (EU) No 1305/2013 (FEGA, 2018). Consulting
13
Article 37 of Regulation (EU) No 1305/2013, it is a stipulated financial aid for crops, animals and plant insurance premiums as a support to farmers in case of economic losses caused by crops, animal and plant diseases, infestation and environmental incident. Eligible farmers just receive support in case previous causes destroy more than 30% of average annual production in the past 3 years or in the 5 years after excluding higher and lower year. Farmers support represents 65% of insurance premium cost. Article 38 of the same regulation, provides financial support for mutual funds support in case of economic losses suffered by the farmers with same causes of the previous article. Finally, Article 39 refers to Income Stabilization tool and supports farmer, again, in same conditions of previous articles.
Common Agricultural Policy
Brief History of CAP creation
In 1957 six countries (Belgium, France, Germany, Italy, Luxembourg, Netherlands) with Treaty of Rome created European Economic Community- EEC, that in future would become the European Union (EU). These countries wanted to avoid and prevent permanently situations of hunger and starvation in future similar as faced in post war period. Despite the recognition of the importance of creating an agriculture policy at an EU level that would provide food at affordable prices and fair income to farmers, CAP was created later in 1962. By affordable prices it now represents around 15% of an average family income what 50 years ago was double (European Commission, 2012).
In the beginning CAP was working as market support, it was decided to determine common prices to EU products and that would start effectively in 1967. The establishment of the prices of the dairy and livestock within the EU involved settling the price at a level
14
above “price fork”- it is the range between upper and lower value. In case of cereals they were between price fork levels, yet closer with upper level This had a consequences on the EU exportation and importation level since, in general, European products were more expensive than world average (Ackrill, 2000). This resulted in Member State measures such as high taxes in importations from countries outside CAP and granting of subsidies to EU exportations in order to avoid wastage of products produced (Ackrill, 2000).
CAP Reforms
According to Hill (2012) the CAP had mainly 4 reformers until now. During the 70s decade, in response to the minimums prices required in market, it was observed that there was a surplus in the supply side of the market because Europeans farmers were producing more than what was needed (European Commission, 2012). All this ended up in causing the EU budgetary crisis of 1982 and originated the first CAP reform 1982-1988. The first CAP reform decreased support prices created quota limits on dairy products in 1984 (European Commission, 2012). On other side, an increased support on sectors with higher demand as cereals was implemented. (Hill, 2012).
The second CAP reform took place between 1988 and 1991, because of the inefficiency of the first reform in surplus control, second reform focused in extension to all CMOs, Common organisation of the markets of Maximum Guaranteed Quantities (MGQs), thus excess of production would face a decrease in price support price in order to reduce budgetary costs. At same time during this period, a structural reform was created in order to increase support to rural areas to create jobs in that area and permit environment protection.
15
The third CAP reform was conducted during 1991 to 1997 and in the background a continuous increase in surplus of beef, milk powder, tobacco, wine and cereals took place. Also, there was that time concern with impact of agriculture on environment what lead to Rio Earth Summit, in 1992 focused an importance on sustainable development, CAP did as well a reform to farmers aware about the climate change and its consequences in future. The message was clear that it was required to produce more but in a more sustainable way, as well. And in 1992 under MacSharry Reform, direct payments to farmer increased it was announced the new payments to farmers by hectare, in case of crops production, and per head of animals, in case of animal production, to change the mechanisms that depend on increasing market prices. In 1994 it was established the General Agreement on Tariffs and Trade (GATT) agreement which would limit subsidized agricultural EU exports, ‘tariffication’ of non-European commodities and restriction of quantities of each commodity that would be imported, which means that the tools to make price of EU commodities high were limited now. Price support tool of CAP was reaching its end. (European Commission, 2012).
The fourth CAP reform took place between 1997 and 2012 according with Hill (2012) however European Parliament (2018a) considers three reforms in the same period. The main changes included the enlargement of countries mainly in central and Eastern Europe and the changing the majority of premiums to single farm payment in 2003. It was faced as well additional lowering in the prices of surplus products, mainly beef and cereals. Quotas were retained in dairy products even though it was faced by further lowering of prices, compensated with direct payments.
Under the Agenda 2000 reform the socio-structural measures was reinforced with a creation of a new development policy known as ‘second pillar’, that brought a voluntary
16
modulation whereby MS could swift up to 20% of CAP direct payments to the new pillar that intend to support rural development (Hill, 2012; European Parliament, 2018a). Under the June 2003 reforms, EU focused to ensure a more equitable support because a reduction in CAP fist pillar was made in order to allocate more funds to rural development policy from 2007 to 2013, period in which budget froze. The most important change was, however, the introduction of Single Payments Scheme (SPS) that englobes Single Farm Payment (SFP) and Single Area Payment (SAP) and the annual payments to farmers directed by country-responsible authorities, yet fully funded by EU, it is based on their entitlement in the period of 2000 to 2002. These payments could be based in income they received in past ‘historic model’ (the one most EU-15 elected) or at an average rate per hectare calculated to the region ‘regional model’ or even a mixture of both models ‘hybrids‘. Additionally these models could change from ‘historic’ to ‘regional’ and thus were ‘dynamic’ and some continued to be being ‘static’. In case of farmers from MS which joined EU after this reform receive sum specified in Accession Agreements that details amounts to per agricultural hectare. This reform had as consequence in the 21 Common Market Organization (CMO) with different regulations and separated by groups of agricultural commodities which were responsible for certifying that farmers received the highest price for their products that in other situation they wouldn’t. This reform made that these 21 CMO merged into 1 in 2007 (Hill, 2012; European Parliament, 2018a).
The 2009 ‘Health Check’ was mainly, the consolidation of the 2003 reform, reinforcing of the rural development measures with funds from Pillar I and elimination of some existent payments linked with production (European Parliament, 2018a).
17
Under the 2013 reform direct payments were substituted with 7 components: 1) Basic direct payment; 2) a greening payment to conservation of public goods; 3) creation of support to young farmers 4) Farmers may receive additional support for the first hectares of land, as a redistributive component; 5) Additional support in case of areas with natural limitations; 6) Additional support linked with production; 7) In case of small farmers, a simplified system for them. In this new CAP Pillar I funds direct payments and market measures with European Agricultural Guidance and Guarantee Fund (EAGGF). Inter Pillar flexibility was improved and from 2015 until now its possible funds transfer between pillars, from first to second up to 15% and from second to first up to 25%. Additionally in CMO, as a preventive measures, reserves were created and the consolidation of single CMO tools to be used in situation of sector crises or market disruption were also introduced (European Parliament, 2018a).
Present CAP instruments
CAP is nowadays implemented through the use of Pilar I and Pillar II. Pilar I englobes direct payments to farmers and markets support, as stated above.
Pillar II englobes support of agriculture and rural development and environment sustainability. Contrary to Pillar I, Pillar II is co-financed by EU funds and either national, regional or local funds. In order to address rural development it is important to define what is rural. According with OECD method to classify rural areas population density is the key definitor. Thus, geographical areas are classified in three different types: Predominantly rural (PR) if more than 50% live in rural communes with less than 150 residents per km2 ; Intermediate Regions (IR) if 15%-50% of residents live in rural region and Predominant Urban (PU) if less than 15% residents live in rural region. Rural areas PR represent more than half of area of EU, however these areas have a small share of
18
economic activity, around 12% of gross value added. These areas are mostly isolated from city centers and badly connected to the last ones. And this low connection to major center of population make economic obstacles to local business and agriculture industry because main market is distant and transport is costly. Then rural areas can be very different, as there are three main types: 1) the ones with pressure of modern life in rural society, the main tradeoff here is how to better keep these areas intact in an environmental point of view but provide as well recreation and leisure to residents; 2) Areas in rural decline that are facing declining in population, getting more isolated, reduction of rural services. In these areas it becomes fundamental to invest for the encouragement of farmers and local economy, facilities and infrastructures; 3) Very disadvantaged areas, usually located in mountains, hills or isolated. There are areas extremely dependent in agriculture and defectively populated. In these cases it is permanently required funding to local farmers, services and the remaining businesses. (Hill, 2012).
In order to support these areas previously mentioned, the rural public expenditures are divided in main three categories: Support to agriculture adjustment; Development of more activities in rural areas and Agri-environmental schemes. In case of support to agriculture adjustment these expenditures include grants to farmers to improve their equipment to better deal with technical circumstances presented. In case of expenditures for the development of more activities and non-agricultural, in rural areas it englobes outflows in non-agricultural activities as tourism, manufacture, services that create job and income to residents. Lastly in Agri-environmental schemes that usually are payments to farmers and creation of jobs. Farmers receive to not cultivate all lands and leave some marginal to promote local wildlife existence as maintenance of the species' existence. In these cases rural jobs are created to keep fields in that biological conditions (Hill, 2012).
19
The importance of CAP
To understand the importance of CAP it permits that 500 million people have access to safety and good quality food and assures animal welfare, represents the highest percentage of EU budget-45% that is divided in agricultural and rural development and converted to euros it is around 55 billion (European Commission, 2012).
As far as direct payments are concerned, it is known that they are very important to small farmers. But to study its importance to overall farmers in EU it was collected data from Farm Accountancy Data Network (FADN) in year of 2016 and results are in appendix Table I. In the first column there are a sample of farmers to each 28-EU MS, in second column family farm income expressed per family labor unit, in third column subsidies and taxes from current productive activity in the accounting year, in last column there are the result of subtraction of subsidies and taxes to family farm income. To the majority (13 countries it is possible observe that the result is negative, so there a high dependence do that sample of farmers in that country. Then from 15 MS not all have family farm income net of subsidies and taxes above its minimum wage.
EU Dairy Market
Dairy sector represents 15% by value of EU agricultural output, which is a major player in the world dairy market and leads the exportation of many dairy products. As a part of the geographically analysis, most MS producers that account up to 70% of production are Germany, France, United Kingdom, Poland, Netherlands and Italy (European Commission, 2018a). In this range of countries, the percentage of products
20
obtained (1 000 t) from cows in all milks is above 90% in all countries except Italy where it is around 86% (Eurostat, 2018).
In EU there was a long period of steady fall in prices of dairy products until 2010. However, between 2010 and 2014 the market price of dairy products rose substantially. This was a period of increase in demand and in order to satisfy the demand, production was increased as well, this stimulated the increase in milk price in that period (European Commission, 2018b). Moreover , the EU dairy products demand decreased which lead to a sharp fall in prices in 2016, as demonstrated in Figure 1 in appendix.
As an important commodity, milk is englobed in CMO in accordance with the Regulation (EU) No 1308/2013. In order to establish stability in this market there are numerous market tools managing it, such as public intervention, private storage, exceptional measures, milk quotas, Aid schemes and Direct payments and rural development programmes (European Commission, 2018c).
In case of public intervention instrument, butter and skimmed milk powder (SMP) are bought into public storage, usually this action takes place between 1st March and 30th September. If market conditions allow, the butter and SMP are sold back to market. This measure was created on November 2016 as an incentive in order to make a price recovery (European Commission, 2018c).
Private storage is granted by the commission to supports the private storage of some dairy products: Butter, Skim Milk Powder (SMP) and Cheeses with Protected Designation of Origin. It permits to take out some products from the market, however this way goods are retained with private owner. This measure exists since 2014 and permits private operators to keep the store until end of the contract period, meanwhile they can
21
receive grants for the storage costs for between 90 to 210 days (European Commission, 2018c).
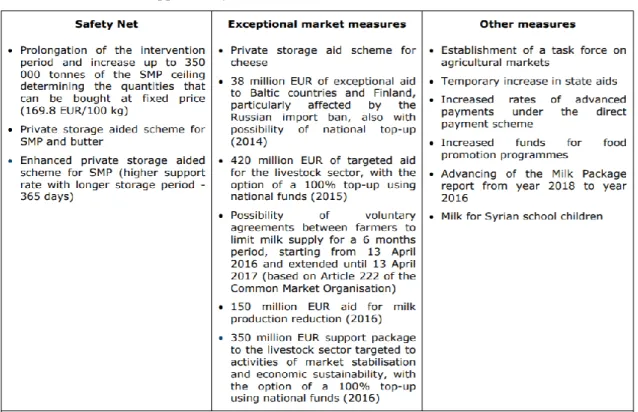
Regarding Exceptional measures, ad hoc measures were created englobing a package of 948 Million of EUR between 2014 and 2016, as represented in Table 2 on appendix. According to Regulation (EU) No 1308/2013 measures were introduced against: market disturbance (Article 219); animal diseases and lack of consumer confidence (Article 220); specific problems (Article 221) and severe imbalance in market (Article 222). The measures introduced with Regulation (EU) No 1308/2013 incentivized creation of packages of aid for milk production reduction. This measures arose in response to the Russian Ban, since 2013 Russia decreased the EU agri-food importations significantly from 11.8 billion EUR to 6 billion EUR in 2017 (European Commission, 2018d).
In case of Milk quotas, they were introduced in 1984 but in 2015 they were abolished after a period of 31 years under the quotas. The main reason for its abolishment were the considerable increase in consumption of dairy market. For example in last 5 years of quotas EU dairy exports increased 45% in volume and 95% in value. In the future it is aimed to resolve problems of surplus production, since now this sector is following a market-oriented policy (European Commission, 2018f).
Concerning Aid scheme that intends to support the supply of milk products under School Milk Scheme that englobes a EU aid of 18.15€ aid per 100kg and can additionally be supplemented at national level (European Commission, 2018c).
Lastly, in what concerns to Direct payments are direct grants that farmers receive to safeguard a safety income. They act as a basic income support and are decoupled from
22
the production, thus stabilizes the farmers income that is subject to volatility of sales of the products in market (European Commission, 2018g).
Methodology
The methodology of this work project will be to study whether the risk management tools at farmer level and additionally the exceptional measures introduced by the Commission in response to falling prices in dairy sector accomplished their objectives in efficient way. Thus, I tried to study the if the following variables have or have not any impact on milk price and its contribution to price variability:
Regression used was the following:
𝑀𝑖𝑙𝑘𝑃𝑡= 𝛼 + 𝛽1𝑀𝑖𝑙𝑘𝑃𝑡−1 + 𝛽2𝐹𝑢𝑒𝑙𝑃𝑡 + 𝛽3𝐹𝑒𝑟𝑡𝑖𝑙𝑖𝑧𝑒𝑟𝑡 + 𝛽4𝑅𝑢𝑠𝑠𝑖𝑎𝑡 +
𝛽5𝐶ℎ𝑖𝑛𝑎𝑊𝑀𝑃𝑡 + 𝛽6𝐸𝑈𝑝𝑟𝑜𝑑𝑢𝑐𝑡 + 𝛽7𝑊𝐺𝐷𝑃𝑡 + 𝛽8𝑀𝑖𝑙𝑘𝑆𝑡 + 𝛽9𝐸𝑀𝑡 + 𝑒𝑡
The following variables were used, whose source is attachedTable 3 on appendix:
• 𝑀𝑖𝑙𝑘𝑃𝑡−1 that represents the cows raw milk of EU in past month in EUR, I decided to use this variable as a proxy of dairy products price since milk cows raw price are the major component of EU dairy market, as presented at EU Historical Production;
• 𝑀𝑖𝑙𝑘𝑆𝑡 represents milk subsidies on milk products in EU in million EUR, this are direct payments to farmers under Pillar I of CAP and it should contribute to a decrease in prices;
• 𝑅𝑢𝑠𝑠𝑖𝑎𝑡 represents Russia demand for EU dairy products in million tons. • 𝐶ℎ𝑖𝑛𝑎𝑊𝑀𝑃𝑡 represents China demand for Whole Milk Powder in million tons. • 𝐸𝑈𝑝𝑟𝑜𝑑𝑢𝑐𝑡 represents EU production of milk in million tons. Before 2014 it was
23
• 𝑊𝐺𝐷𝑃𝑡 represents World GDP in million US$.
• 𝐹𝑢𝑒𝑙𝑃𝑡 represents Eurozone weighted average agriculture Fuel prices, in EUR. • 𝑀𝑖𝑙𝑘𝑆𝑡 represents milk subsidies on milk products in EU in million EUR, this are
direct payments to farmers under Pillar I of CP;
• 𝐹𝑒𝑟𝑡𝑖𝑙𝑖𝑧𝑒𝑟𝑡 represents Urea fertilizer prices available in world bank. It was choose urea since it is the most important straight nitrogen global fertilizer and it use has been increasing in Europe. Moreover, most of nitrogen consumption increase in last 30 years was made with Urea (Fertilizers Europe, 2009).
• 𝐸𝑀𝑡 that represents exceptional measures triggered by Commission in 2014, 2015 and 2016 and values are in million EUR and this variable should contribute to a decrease in prices.
Methodology Shortcomings
The first shortcoming is the fact that variables of regression have different available data. 𝐹𝑀𝑖𝑙𝑘𝑃𝑡 𝑎𝑛𝑑 𝐹𝑒𝑟𝑡𝑖𝑙𝑖𝑧𝑒𝑟𝑡 are variables with monthly data while the
remaining ones,𝑀𝑖𝑙𝑘𝑆𝑡, 𝑅𝑢𝑠𝑠𝑖𝑎𝑡, 𝐶ℎ𝑖𝑛𝑎𝑊𝑀𝑃𝑡, 𝛽6𝐸𝑈𝑃𝑅𝑂𝐷𝑈𝐶𝑡,𝑊𝐺𝐷𝑃 and 𝐸𝑀𝑡, are
variables with only annual data. And 𝐹𝑈𝐸𝐿𝑃𝑡 has weekly data. In order to have a longer time series these were converted from annual and weekly ranges into monthly by interpolating these data with EVIEWS Software. The second shortcoming is the seasonality effect that some variables might have and EVIEWS does not demonstrate it since it was done by data interpolation. For example, Annual exportations to China and Russia could be higher in some specific months and similarly EU production milk theoretically have higher or lower production depending upon the weather, for example if winter is colder, it delays grass development of cows and consequently decreases the
24
milk collection (European Commission, 2018h). The last and third limitation appears with fact that the production subsidies and Exceptional market measures take longer than intended period, due to EU bureaucracy, since EU support will take time to reach respective pay agencies of each MS and finally the intended farmers (European Commission, 2017).
Results
Results of the variation in regression above are shown in Table 4, Table 5 and Table 6 on appendix.
As regards to regression without 𝐸𝑀𝑡 it is a 10 year monthly regression that starts
in December 2007 and ends on December 2017. The main observations are that fuel costs, EU subsidies and even china demand contributed to increase in milk price and thus dairy market. On other side, Eurozone production and fertilizer prices contributed to lowering the prices. Russia demand and World GDP were not statistically significant. The main justification for the increase in the prices due to subsidies and the risk management tools at farmer level, were the fact that production incentive (the part of milk subsidies decoupled with production) made farmers produce even more while demand was increasing, this is seen from the data that the demand has been rising over the years that reinforces our belief that the price will followed the increase in demand. Considering fuel prices as a cost, it contributed to increase in prices, as it acts as an input and with emerging of 2007 financial crises it was observed that a very significant increase in prices took place and affected the EU farmers, even though farmer fuel is less expensive than other fuel for the cars and other means of transportation, as it can be observed at weekly Oil Bulletin of European Commission website (2018i). In case of China demand, more
25
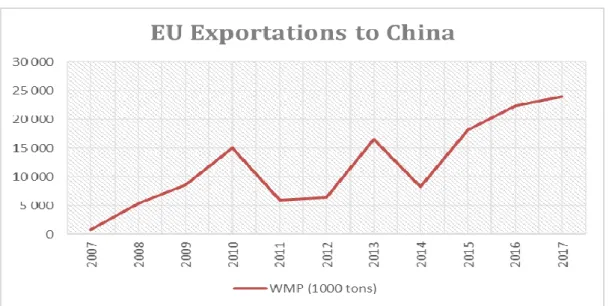
precisely for the Whole Powder Milk, it unexpectedly contributed to increase in the prices. One possible reason is if we observe EU exportations during this 10y period it has increased during most of the years, except from 2010 until 2011 and 2013 to 2014 as it can be demonstrated in below:
Figure 2: EU Exportations of Whole Milk Powder to China
Source: Agriculture and rural development, EU Milk Market Observatory.
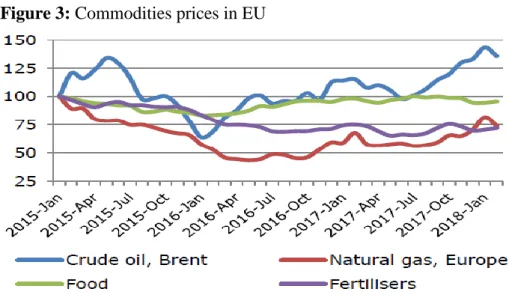
The main explanation for the decrease of dairy prices due to EU productions is linked with significant increase of milk production since milk quotas were abolished in the end of 2015, and significant production increase has been observed since 2010 already. More production in this case, when the demand curve does not follow this increase leads to the decrease in the prices. As regards to fertilizer prices it contributed to a decrease in price because fertilizer is a cost for farmers and through past years it has been decreasing, as demonstrated in Figure 3, appendix.
Considering regression without 𝑀𝑖𝑙𝑘𝑆𝑡, it is a 3y monthly regression starting on January 2014 and ending in December 2016. In this regression neither fuel nor the fertilizer prices were incorporated as in previous regression these variables were incorporated and clearly had impact on milk prices decrease and my aim with second
26
regression is to study if 𝐸𝑀𝑡 counterbalanced the Russia Ban in some way. China demand
and European production were not significant. However Exceptional Measures, Russia ban and World GDP all contributed to price decrease. The Russian ban contributed to a decrease in the prices because as regards to it, it affected the milk prices because a very significant decrease in overall dairy market demand was observed as demonstrated bellow: Figure 4: EU Exportations of Dairy products to Russia.
Source: Agriculture and rural development, EU Milk Market Observatory.
With regards to Exceptional measures it was expected that it contributed to an increase in milk price, however according to the results in table IV it contributed to a decrease. One possible explanation is the fact that farmers did not decrease milk production as was accorded and also even if they did, the amount of Exceptional measures did not cover the market downward trend in prices.
In what concerns to results of regression with 𝑀𝑖𝑙𝑘𝑆𝑡 𝑎𝑛𝑑 𝐸𝑀𝑡, are demonstrated in Table 6 on appendix. Both measures had the same impact in milk prices as above discussed. In case of exceptional measures it had a negative impact, thus contributed to a decrease in milk prices. On opposite, and similarly as regression subsidies had a positive impact in milk price, thus contributed to a increase in milk price.
27
Conclusion
We are living in period with erratic climate change events with the most drastic consequences. Millions of people are dying, and many are in risk of it because of this global climatic change. However the objectives and its solutions that have arisen in conventions like the Paris Agreement 2015 do not seem efficient since OECD reports state that in next 15 to 30 years the objectives won’t be achieved. Future consequences of climate change would be even more drastic, resulting either in deforestation or air pollution. The most developed countries are responsible for 80% air pollution. Moreover, some of them even left Paris Agreement showcasing their concerns about climate change, e.g.- USA case (Climate Analytics, 2018).
Risk is associated with an uncertainty in the outcome that negatively affects the output and in case of a sector like Agriculture due to climate change, those changes are even more evident. In order to mitigate that, the EU has been developing risk management tools and created Measure17, exceptional measures were adopted as well in some segment of the markets and the EU subsidies contribute as well towards the mitigation of those risks since savings from the most productive years can play an important role.
CAP has its history rooted in 1962 when it was created, it has already gone through several reforms in order to better adapt to either market or EU citizens needs. It played an important role during the crisis of dairy market since both subsidies to milk producers and exceptional measures as risk management tools were statistically significant in the regression analysis that was conducted, subsidies contributed to an increase in price, however because exceptional measures were implemented in a critical period, and response to Russian ban, and when prices were with a decreasing tendency, it contributed to a decrease in the prices.
28
References
Ackrill, R. (2000) The Common Agricultural Policy (England: Sheffield Academic iiPress.)
Barnett, B. J. and Mahul, O. (2007) "Weather index insurance for agriculture and rural iiareas in lower-income countries". In American Journal of Agricultural Economics,
ii89(5), pp. 1241–1247. doi: 10.1111/j.1467-8276.2007.01091.x.
Bodie, Z., Kane, A., Marcus, A. J. (2014) Investments. 10th edn. Edited by McGraw-Hill iiEducation. New York.
Burrel A., (2009) "The CAP: Looking Back, Looking Ahead", Journal of European iiIntegration, Vol.31, No.3, 271-289.
Climate Analytics (2018), Paris Agreement Ratification Tracker, Accessed on 4 iiDecember 2018 < https://climateanalytics.org/briefings/ratification-tracker/ >
Daniel, M and Featherstone, A. (2001) ‘Assessing Agricultural Risk Among States’, iiJournal of the ASFMRA. Available at: www.asfmra.org.
EASAC (2013) Trends in extreme weather events in Europe: implications for national iiand European Union adaption strategies, EASAC No. 22, ISBN: 978-3-8047-3239-1,
iiAvailable at: www.easac.eu.
ENRD, (2018) The LEADER approach, Accessed on 24 November 2018
ii<http://enrd.ec.europa.eu/enrd-static/leader/leader/leader-tool-kit/the-leader-iiapproach/en/the-leader-approach_en.html>
European Commission (2012) The common Agricultural Policy A story to be continued. iidoi:10.2762/35894
29
European Commission (2017) Managing risk in the dairy sector : how futures markets
iicould help. No. 11. Available at:
iihttps://ec.europa.eu/agriculture/sites/agriculture/files/markets-and-prices/market-iibriefs/pdf/11_en.pdf.
European Commission (2018a) Milk and Milk Products. Accessed 30 October 2018 < iihttps://ec.europa.eu/agriculture/milk_en >
European Commission (2018b) EU Prices of Cow's Raw Milk. Accessed 30 October 2018
ii<https://ec.europa.eu/agriculture/sites/agriculture/files/market-iiobservatory/milk/pdf/eu-raw-milk-prices_en.pdf >
European Commission (2018c) Policy instruments for the dairy sector. Accessed 30 iiOctober 2018 < https://ec.europa.eu/agriculture/milk/policy-instruments_en >
European Commission (2018d) Russian import ban on agricultural products. Accessed ii30 October 2018 < https://ec.europa.eu/agriculture/russian-import-ban_en >
European Commission (2018f) Press Release Database: Frequently Asked Questions: iiEnd of milk quotas . Accessed 30 October 2018 <
http://europa.eu/rapid/press-iirelease_MEMO-15-4697_en.htm>
European Commission (2018g) Direct Support . Accessed 30 October 2018 ii<https://ec.europa.eu/agriculture/direct-support_en>
European Commission (2018h) Short-term outlook for EU agricultural markets in 2018 iiand 2019. Available at:
https://ec.europa.eu/agriculture/sites/agriculture/files/markets-iiand-prices/short-term-outlook/pdf/agri_short_term_outlook_spring-2018_en.pdf.
Europan Commission (2018i) Weekly Oil Bulletin, Accessed 12 November 2018 < iihttps://ec.europa.eu/energy/en/data-analysis/weekly-oil-bulletin>
30
European Parliament (2018a), Fact Sheets on the European Union, Accessed 12 iiNovember 2018 <http://www.europarl.europa.eu/factsheets/en/sheet/107/the-common-iiagricultural-policy-instruments-and-reforms>
European Parliament (2018b), Fact Sheets on the European Union, Accessed 22 iiNovember 2018 <http://www.europarl.europa.eu/factsheets/en/sheet/110/second-pillar-iiof-the-cap-rural-development-policy>
Eurostat (2018) Milk collection (all milks) and dairy products obtained - annual data,
iiAccessed 2 December 2018 <
iihttp://appsso.eurostat.ec.europa.eu/nui/submitViewTableAction.do>
FEGA (2018), Rural Development (EAFRD) control measures 2014-2020, Accessed on ii24 November 2018 < https://www.fega.es/en/node/43287
Fertilizers Europe (2009), Forecast of food, farming and fertilizer use in the European iiUnion 2009-2019.
Hawkins, E., Ortega, P., Suckling, E., Schurer, A., Hegerl, G., Jones, P., Joshi, M., Osborn, T. J., Masson-Delmotte, V., Mignot, J., Thorne, P. and van Oldenborgh, G. J. ii(2017), Estimating changes in global temperature since the preindustrial period. iiBulletin of the American Meteorological Society, 98 (9). pp. 1841-1856. ISSN ii1520-0477 doi:https://doi.org/10.1175/bams-d-16-0007.1.
Hill, B., (2012), Understanding the Common Agricultural Policy (Oxford: Earthscan) IFRC (2015) World Disasters Report: Focus on local actor, the key to humanitarian iieffectiveness, ISBN: 978-92-9139-226-1. Available at: https://ifrc- iimedia.org/interactive/wp-content/uploads/2015/09/1293600-World-Disasters-Report-ii2015_en.pdf
31
Kaplan, S; Garrick, J. (1981) ‘On The Quantitative Definition of Risk’, Risk Analysis, ii1(I), pp. 11–27.
Local Action Groups (2018), EU Funds, Accessed on 24 November 2018 ii<https://eufunds.gov.mt/en/EU%20Funds%20Programmes/European%20Agriculturali ii%20Fund/Pages/LEADER/Local-Action-Groups.aspx >
Moschini G and Hennessy DA (2001) "Uncertainty, risk aversion, and risk management iifor agricultural producers". In Gardner and Rausser (2001) Iowa State University.
Musser, W.N. and G.F. Patrick (2001), “How much does risk really matter to farmers?”. iiIn A Comprehensive Assessment of the Role of Risk in U.S. Agriculture, Volume (23), ii537-556, Springer, Boston, MA.
OCDE (2009), ‘Managing Risk In Agriculture: A Holistic Approach’, OCDE Publishing, iiParis.
OCDE (2010) Food and Agriculture, Current Themes and Results. OCDE Publishing, iiParis.
OCDE (2011) ‘Risk Management in Agriculture : What Role for Governments ?’, OCDE iiPublishing, Paris.
OCDE (2012), OECD Environmental Outlook to 2050, The Consequences of Inaction, iiOCDE Publishing, Paris. Available at: https://doi.org/10.1787/9789264122246-en.
OECD (2018), Agri-environmental indicators, Accessed 14 October 2018, ii<http://www.oecd.org/tad/sustainable-agriculture/agri-environmentalindicators.htm>
OCDE (2017) Investing in Climate, Investing in Growth, OCDE Publishing, Paris. iiAvailable at: http://oe.cd/g20climate
32
OECD (2007) ‘Agricultural Policies in OECD Countries: Monitoring and Evaluation ii2007’, 195–202, ISBN 978-92-64-02746-6.
Prescott, E. C. and Townsend, R. M. (1984) "Pareto optima and competitive equilibria iiwith adverse selection and moral hazard". In Econometrica, 52(1), pp. 21–46. doi:
ii10.2307/1911459.
Regulation (EU) No 1305/2013 of the European Parliament and of the Council of 17 iiDecember 2013 on support for rural development by the European Agricultural Fund iifor Rural Development (EAFRD) and repealing Council Regulation (EC) No ii1698/2005. ELI: http://data.europa.eu/eli/reg/2013/1305/oj
Regulation (EU) No 1308/2013 of the European Parliament and of the Council of 17 iiDecember 2013 establishing a common organisation of the markets in agricultural iiproducts and repealing Council Regulations (EEC) No 922/72, (EEC) No 234/79, (EC) iiNo 1037/2001 and (EC) No 1234/2007. ELI: http://data.europa.eu/eli/reg/2013/1308/oj
UN, Department of Economic and Social Affairs, Population Division (2015). World iiPopulation Prospects: The 2015 Revision, Key Findings and Advance Tables. Working iiPaper No. ESA/P/WP.241.
UNEP (2016) Healthy Environment, Healthy People, Nairobi, Report Number: 23-27.
iiUnicef (2018a), Health, Malaria. Accessed 15 October 2018
ii<https://www.unicef.org/health/index_malaria.html>
Unicef (2018b), Health, Diarrhoea. Accessed 15 October 2018 ii<https://www.unicef.org/health/index_92007.html>
WMO (2010) The Global Climate 2001 – 2010, A Decade of Climate Extremes, WMO-iiNo.1119, ISBN: 978-92-63-11119-7, Geneva, Switzerland
33
WHO (2016) Preventing disease through healthy environments: a global assessment of iithe burden of disease from environmental risks, ISBN 978 92 4 156519 6, Available at:
iihttp://www.who.int/quantifying_ehimpacts/publications/preventing-disease/en/.
WMO (2018), Summer sees heat and extreme weather, Accessed 12 October 2018 ii<https://public.wmo.int/en/media/news/summer-sees-heat-and-extreme-weather>
WWF (2018), Amazon deforestation, Accessed 20 October 2018 ii<http://wwf.panda.org/our_work/forests/deforestation_fronts/deforestation_in_the_am azon/>
34
Appendix
Table 1. Farm Net Income and Current subsidies and taxes
Year Country (3 digits
FADN acronym)
Farm Net Income (SE420)
Balance current subsidies & taxes
(SE600) Output without subsidies 2016 (BEL) Belgium 57838 21340 36498 2016 (BGR) Bulgaria 6844 9954 -3110 2016 (CYP) Cyprus 7557 3951 3606
2016 (CZE) Czech Republic 37162 89078 -51916
2016 (DAN) Denmark 9480 32410 -22930 2016 (DEU) Germany 40462 36190 4272 2016 (ELL) Greece 10796 6124 4672 2016 (ESP) Spain 35160 12308 22852 2016 (EST) Estonia -1889 21299 -23188 2016 (FRA) France 25641 26354 -713 2016 (HRV) Croatia 7681 5233 2448 2016 (HUN) Hungary 20878 15981 4897 2016 (IRE) Ireland 24708 16748 7960 2016 (ITA) Italy 32940 7263 25677 2016 (LTU) Lithuania 10553 11222 -669 2016 (LUX) Luxembourg 36794 54572 -17778 2016 (LVA) Latvia 13761 16124 -2363 2016 (MLT) Malta 11083 2650 8433 2016 (NED) Netherlands 70703 14595 56108 2016 (OST) Austria 23933 19791 4142 2016 (POL) Poland 7723 5185 2538 2016 (POR) Portugal 15999 7726 8273 2016 (ROU) Romania 5102 2107 2995 2016 (SUO) Finland 12802 48387 -35585 2016 (SVE) Sweden 24646 40591 -15945 2016 (SVK) Slovakia 85528 155418 -69890 2016 (SVN) Slovenia 4814 6593 -1779
35 Table 2. Measures to support dairy sector.
Source: (European Commission, 2017) p.17
36 Figure 3: Commodities prices in EU
Source: (European Commission, 2018h), page 3.
Table 3. Variables description and source information.
Variable Sample Description Source
MilkP 2008.01-2017.12 Cows row milk price
Regulation (EU) No 2017/1185 Article 12(a) - Annex II.4(a)
MilkS 2008.01-2017.12 EU subsidies in milk products EUROSTAT
EUPRODUC 2008.01-2017.12 EU production of milk in
million tons. EUROSTAT
FUELP 2008.01-2017.12 Eurozone weighted average
agriculture Fuel prices
Oil Bulletin Prices History
Fertilizer
(Urea) 2008.01-2017.12 Urea fertilizer World Bank
Russia 2008.01-2017.12 Exportations to Russia of dairy
products. EU Commission
ChinaWMP 2008.01-2017.12 Exportations to China of
Whole Milk Powder. EU Commission
WGDP 2008.01-2017.12 World GDP in million US$ World Bank
EM 2014.01-2016.12 Exceptional Measures in dairy
37 Table 4. Regression Results (1)
Note: The number of columns represents number of regressions. It was used LS-Least
Squares method. And regarding coefficient covariance method was used Newey-West.
Asterisks *** ** * represent significance level at 1%, 5% and 10%.
(1) (2) (3) Milkpt-1 0.929542*** (0.037122) 0.930308*** (0.036333) 0.923036*** (0.034125) logFuelPt 0.1555649** (0.046978) 0.154147** (0.047187) 0.156761** (0.046813) logFertilizert (0.019114) -0.025670 (0.019606) -0.028972 -0.034876* (0.014912) logSubsidiest 0.029350** (0.013672) 0.034969** (0.015019) 0.034876** (0.014912) D(EUproduc)t -3.23E-06** (1.15E-06) -3.06E-06** (1.04E-06) -2.85E-06** (1.10E-06) D(ChinaWMP)t 0.001127** (0.000444) 0.001078** (0.000419) 0.001087** (0.000414) WGDPt -0.239515 (0.182108) -0.208539 (0.196875) Russiat -4.13E-06 (7.88E-06) n 120 75 120 R2 0.963893 0.963713 0.963108 Adjusted R2 0.961290 0.961445 0.961149 F-statistic 370.3970 424.9286 491.6619
38 Table 5. Regression Results (2)
Note: The number of columns represents number of regressions. It was used LS-Least
Squares method. And regarding coefficient covariance method was used Newey-West.
Asterisks *** ** * represent significance level at 1%, 5% and 10%.
(1) (2) (3) Milkpt-1 1.006190*** (0.084069) 0.991244*** (0.089813) 0.911646*** (0.091688) D(logEM)t -5.539838*** (1.765107) -5.176755*** (1.866404) -3.629290* (2.016229) D(logRussia)t -0.858613*** (0.278602) -0.802519** (0.293852) -0.564631* (0.314949) WGDPt -7.641756** (3.739088) logEUproduct 0.608607 (0.524454) logFuelPt 0.060171 (0.094139) 0.001294 (0.001294) n 35 35 35 R2 0.928388 0.929067 0.930714 Adjusted R2 0.918839 0.919609 0.921476 F-statistic 97.23046 98.23338 100.7465
39 Table 6. Regression Results (3)
Note: The number of columns represents number of regressions. It was used LS-Least
Squares method. And regarding coefficient covariance method was used Newey-West.
Asterisks *** ** * represent significance level at 1%, 5% and 10%.
(1) (2) (3) Milkpt-1 0.885632*** (0.103349) 0.911670*** (0.091692) 1.009309*** (0.086287) D(logSubsidies)t 0.103076 (0.073657) 0.116646* (0.065057) 0.209041*** (0.040247) D(logEM)t -0.097436 (0.072720) -0.116889** (0.059048) -0.219390*** (0.022127) WGDPt -8.227295* (4.270943) -0.204559** (0.100084) logFuelPt 0.060171 (0.094139) n 35 35 35 R2 0.931611 0.930714 0.923658 Adjusted R2 0.919820 0.921476 0.916270 F-statistic 78.49468 78.26662 76.56957