Equity Valuation
A valuation of the
pharmaceutical company
Novartis AG
Ana Catarina Coelho
152417025
Dissertation written under the supervision of José Carlos Tudela
Martins
Dissertation submitted in partial fulfilment of requirements for the MSc in
Finance, at the Universidade Católica Portuguesa, 5
thof April 2019.
2 | P a g e
Abstract
Equity Valuation: A valuation of the pharmaceutical company Novartis AG Author: Ana Catarina Filipe de Sousa Coelho
This dissertation valuates Novartis AG, a Swiss pharmaceutical company operating globally, listed both in SIX and NYSE.
The purpose of this valuation is to provide readers a recent considerate investment recommendation based on the forecasted market share price of Novartis. Examining and understanding the pharmaceutical sector and Novartis’s financial information led to conducting a valuation using the DCF and reaching a target share price of USD 99.75, indicating Novartis’s worth at 31st December of 2019. To complement this decision, this
dissertation included the Relative approach using the ratios EV/EBITDA and
EV/Revenues. Due to the inconsistency of results found, the DCF was the chosen model to value the company.
Regarding these inferences, the conducted sensitivity analysis and both approaches, it decided a BUY recommendation is the right choice.
Keywords: Equity Valuation, Discounted Cash Flows, Novartis, Pharmaceutical Industry
Abstrato
Equity Valuation: A valuation of the pharmaceutical company Novartis AG Autor: Ana Catarina Filipe de Sousa Coelho
Esta dissertação avalia a Novartis AG, uma empresa farmacêutica suíça que opera globalmente e quotada em bolsa, tanto no SIX como no NYSE.
O objectivo desta avaliação é providenciar aos leitores uma recente e pensada
recomendação de investimento, baseada na estimação do preço de mercado da acção da Novartis. Ao examinar, compreendendo o sector farmaceutico e a informação financeira da Novartis, foi tomada a decisão de conduzir a avaliação através do DCF, chegando então a um preço de mercado de USD 99.75, indicando então o valor da Novartis no dia 31 de Dezembro de 2019.
De maneira, a complementar esta decisão, nesta dissertação está também incluida a realização da avaliação através de rácios, utilizando o EV/EBITDA e o EV/Revenues. Pela inconclusão dos dados a que se chegou com esta abordagem, o DCF foi o modelo escolhido para avaliar a empresa.
Tendo em conta estas condições, uma análise de sensibilidade e ambas as abordagens, foi dada como a escolha certa, uma recomendação de compra da acção.
Palavras-Chave: Avaliação do Capital Próprio, Fluxo de Caixa Descontados, Novartis, Indústria Farmacêutica
3 | P a g e
Acknowledgements
My last Master’s task has come to an end and there are some people that I want to thank for staying beside me along this journey.
I want to extend my sincere gratitude to Dr. Tudela Martins, my dissertation’s supervisor and professor in my master’s course Firm Valuation. That was the course that made me want to follow a path in a dissertation on Equity Valuation.
His kindness on advising me, professionalism, presence and patience during this dissertation helped me excel further in many areas and I appreciate it deeply.
My parents, Luís and Filomena, that have been present and my best friends, along all years all my life. I could not have finished or started this without you and your motivation in everything in my life.
My grandparents, Solange, Glória, Joaquim and Ernesto that make me smile every day, proudly.
My boyfriend, Manel, for supporting and motivate me, making me laugh and showing me his love every time when I needed to find the bright side of the picture.
And in addition to this, my dear friends, that brought me a smile and a word of
encouragement that I needed to hear in order to continue, Melany, Cátia, André, Miguel and Catarina.
4 | P a g e
Index
1. Literature Review ... 6
1.1. Discounted Cashflow Valuation ... 6
1.1.1. Dividend Discount Model (DDMs) ... 7
1.1.2. Free Cash Flow to the Firm (FCFF) and Free Cash Flow to the Equity (FCFE) 7 1.1.3. APV ... 9
1.2. Relative Valuation ... 9
1.3. Contingent Claim Valuation ... 10
1.4. Valuation Model’s Choice ... 11
2. Industry Overview: The Pharmaceutical Industry ... 11
3. Company Overview: Novartis AG ... 14
4. Novartis’s Historical Performance ... 16
4.1. Debt/Equity Ratio (D/E) and Net Debt ... 17
4.2. Revenues ... 18
4.3. Operating Income (EBIT) ... 20
4.4. Net Income ... 20
4.5. ROIC and Return on Research Capital Ratio (RRCR) ... 21
5. Company Valuation ... 23 5.1. Chosen Model ... 23 5.2. Assumptions ... 23 5.3. Novartis’s 2019-2028 Forecast ... 25 5.4. WACC ... 31 5.4.1. Cost of debt ... 31
5.4.2. Market Value of Debt and Market Value of Equity ... 32
5.4.3. Cost of equity ... 33
5.5. Enterprise Value of Novartis ... 34
6. Relative Valuation ... 37
6.1. EV/EBITDA and EV/Revenues ... 38
6.2. Forward Multiples ... 40
7. Investment Banking Report’s Comparison ... 41
8. Final Conclusions ... 43
9. Appendices ... 44
5 | P a g e
Appendix 2. Forecasted Financial Statements ... 46
Appendix 3. Economic, Technological and Social Analysis ... 47
Economic Analysis ... 47
Technological Analysis ... 47
Social Analysis ... 48
Appendix 4. Novartis's blockbusters Cosentyx and Entresto growth ... 48
Appendix 6. Strategic Business Analysis: SWOT Analysis ... 50
Appendix 7. Historical EBIT and EBIT Margin ... 53
Appendix 8. R&D/Total Revenues of Novartis and Peers ... 53
Appendix 9. EBITDA and EBITDA’s Margin ... 53
Appendix 10. NOPLAT ... 54
Appendix 12: Novartis Total Revenues from 2013 to 2028 ... 57
Appendix 13. Forecasted Operational Income (EBIT) ... 57
Appendix 14. CAPEX and Depreciations: Historical and Forecasts ... 58
Appendix 15. Net Working Capital: Historical and Forecasted ... 59
Appendix 16. Valuation using DCF ... 59
Appendix 17. Cash and Cash Equivalents: Historical and Forecasted ... 60
Appendix 18. Novartis’s Peer Group ... 60
Appendix 19. Share Price Evolution ... 61
6 | P a g e
1. Literature Review
How to value a firm is at the heart of most financing and investment decisions. The estimate of a firm’s value is frequently a task for investment analysts when deciding on different aspects of the firm like capital budgeting, mergers and acquisition or for example, going public. (Bancel and Mittoo, 2014)
Hence why the Equity Valuation subject is based on questioning the worth and value of a company. At the fast pace of today’s world, valuation is a financial and analytical tool that managers should master more than ever (Luehrman, 2016) and as this dissertation’s goal is to value the company Novartis, even though it should reach a target price and a market recommendation, it should be more than just a number reached, according to Oscar Wilde most know “the price of everything, but the value of nothing”.
Valuation has a key role in many financial areas like corporate finance, mergers & acquisitions and portfolio management but it is important to say that it does not work as a linear exercise. The preconceptions and biases that an analyst brings to the process will find its way into the value and in various cases it will make the process more realistic and suited to each situation. (Damodaran, 2002)
There are different approaches when doing valuation, that make very different assumptions about the fundamentals that determine the value of a company, but they do share some common characteristics, advantages and disadvantages. We can classify the methods in 3 broad ones. The first, discounted cashflow valuation, relates the value of an asset to the present value of expected future cashflows on that asset. The second, relative valuation, estimates the value of an asset by looking at the pricing of 'comparable' assets relative to a common variable like earnings, cashflows, book value or sales. The final approach, contingent claim valuation, uses option pricing models to measure the value of assets that share option characteristics. (Damodaran, 2006)
1.1. Discounted Cashflow Valuation
It is considered that the discounted cash flow valuation is the foundation on which all other valuation approaches are built, as it is needed to understand the fundamentals of this approach to do the relative valuation correctly as well as it is needed to begin first the discounted cash flows analysis (DCF) to be able to apply the option pricing models that fulfil the contingent approach.(Damodaran, 2002)
7 | P a g e
In equity valuation, the analyst should define which specific cash flow stream will be valued and afterwards forecast those. There is two kinds of cash flows streams - free cash flow and dividends which both are associated to different discounted cash flow valuation models and discount rates .(Jerald E. Pinto et al., 2010)
To start the discounted cash flow analysis there are four general stages:
1) Selecting the DFC model: it requires to be chosen a specific cash flow stream 2) Forecast the cash flows
3) Choose a discounted rate methodology 4) Estimate the discounted rate
When having a perception that dividends are an appropriate definition of cash flows, the model used is called the Dividend Discount Model (DDMs).
1.1.1. Dividend Discount Model (DDMs)
This model defines cash flows as the distribution to shareholders that is authorized by a company’s board of directors, meaning, dividends. The basic argument for using this definition of cash flow is that an investor when buying stocks, usually expects to get two types of cashflows - dividends during the period she holds the stock and an expected price at the end of the holding period. Subsequently, since this expected price is drew by future dividends, the value of a stock is the present value of dividends through infinity. (Damodaran, 2002)
However, there are disadvantages when using the DDMs as dividend policy practices are different in different points worldwide and change throughout time. In this model, dividends are the only access to the company’s true value and will be taken as truthful information. In addition to these facts, if dividends are not one of the sources of value creation, this model will not reach its objective. (Jerald E. Pinto et al., 2010)
This model works best for companies that appear to have history in maintaining a policy of paying out most of the cash flows left over after debt payments and reinvestment needs – as dividends.(Damodaran, 2002)
1.1.2. Free Cash Flow to the Firm (FCFF) and Free Cash Flow to the Equity (FCFE)
In another perspective, the returns are defined as free cash flow. According to (Jerald E. Pinto et al., 2010), the concept of free cash flow responds to the reality that, for a going
8 | P a g e concern, some of the cash flow from operations is not “ free ” but rather needs to be committed to reinvestment and new investment in assets.
Cash flows are categorized as Free Cash Flow to the Firm (FCFF) and Free Cash Flow to the Equity (FCFE) and depending on whether the analyst is using the FCFF or the FCFE in the DCF valuation, it shall be used respectively, the cost of capital or the cost of equity of a valued company, as discount rate. Moreover, with the FCFF approach it will be reached the enterprise value, on contrary, when using FCFE it will be equity value of the company.(Janiszewski, 2011)
Free cash flows to firm are the cash flows that are available to all providers of the company’s capital, both creditors and shareholders, after covering capital expenditures and working capital needs. Therefore, FCFF are projected on an unlevered basis, before subtracting interest expenses. It reflects the cash generated by company’s all assets, independently of how the assets are financed (capital structure of the company).(Janiszewski, 2011)
FCFF= EBIT (1-Tax rate) + Depreciation - CAPEX - Changes in Working Capital
Free cash flows to equity are the cash flows leftover after meeting all financial obligations, including debt payments and after covering capital expenditures and working capital needs(Janiszewski, 2011)
FCFE = Net Income + Depreciation – CAPEX - Changes in Working Capital - (Debt Repayments - New Debt Issued)
The two approaches (FCFF and FCFE), however, should theoretically yield the same estimates if all inputs reflect identical assumptions when valuing the equity of the company.
An analyst may prefer to use one approach rather than the other concerning the characteristics of the company being valued as for a company’s with high leverage or with a historical background of leverage changes it is preferable to use the FCFF as its growth rate will be more stable than the FCFE growth rate and therefore not be prone to error.
9 | P a g e 1.1.3. APV
Still in terms of discounted cash flow models, there are alternatives to models who use the WACC as a discount rate: the adjusted present value (APV). APV discounts the same cashflows as the enterprise DCF model but uses the unlevered cost of equity as the discount rate (without the tax benefit of debt). It then separately values the cash flow tax benefits of debt and adds them to determine the total enterprise value.
APV will not be used to value Novartis because this company’s debt-to equity ratio is not expected to change significantly. In companies where this scenario is expected or verified, this discounted cash flow method is suited as WACC-based models can yield true results but appears to be more difficult to apply in these situations. (Koller, Goedhart and Wessels, 2000)
1.2. Relative Valuation
This kind of valuation represents also a very known approach when it comes to valuing companies. The underlying concept of this kind of valuation is that similar assets or services should sell at similar prices and therefore relative valuation involves a group of comparison like an industry group.
This method it is typically implemented using price multiples or enterprise value multiples and these will be used for complementary information and under the assumption that the comparison asset or company is fairly value as this method does not specify intrinsic value. Price multiples are ratios that combine the stock’ s market price to some measure of value per share. Enterprise value multiples, by contrast, relate the total market value of all sources of a company’ s capital to a measure of fundamental value for the entire company
Having the advantage of being simply applicable, related to market prices, grounded in a sound economic principle (that similar assets should sell at similar prices) and widely recognized by investors (Jerald E. Pinto et al., 2010), this approach also has its drawbacks. When taking the Relative Approach, the value of an asset is derived from the pricing of 'comparable' assets, standardized using a common variable such as earnings, cashflows, book value or revenues (Damodaran, 2002) considering that the market is reliable in terms of comparison. Another factor that might disrupt the truthfulness of the results comes from the fact that the peers selected are not suited or that the prices paid for these companies on their shares of stock were not representative.
10 | P a g e
Since Novartis AG is a pharmaceutical company, to do its valuation it should be taken into consideration the industry and models most suited for. So, to choose multiples to evaluate the company, it was considered the ones that are related to R&D costs and the company’s ability to manage high levels of debt and profitability as the pharmaceutical industry demands.
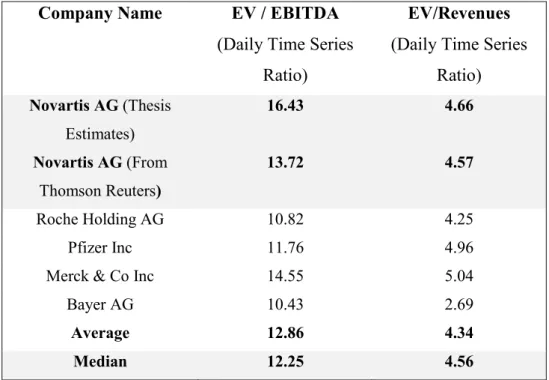
Novartis will be examined using the Return on Research Capital Ratio (RRCR), Return on Invested Capital (ROIC) and valued using the Enterprise Multiples, EV/EBITDA and EV/Revenues.
1.3. Contingent Claim Valuation
An analysis of projects in a dynamic environment is often more complex than the standard DCF approaches may suggest, since they implicitly assume a static view of investment decisions and projected cash flow scenarios. The Contingent Claim Valuation or also known as The Real Options approach is more dynamic than the traditional approaches since it is capable of incorporating not only the value of flexibility and growth opportunities but also of competitive strategies in an uncertain environment.(Smit and Trigeorgis, 2003)
Some experts believe that there are two main methods when valuing pharmaceutical projects – discounted cash flow (DCF) analysis and real options valuation (ROV). For projects with strong market potential and therefore little risk of being terminated for economic reasons, the DCF will be understated because published success rates are too low for these projects, so this kind of valuation would need adjustments that tend to rely heavily on management intuition. ROV provides a more reliable method, being better suited to project valuation both in the pharmaceutical industry and in other R&D driven industries with staged investments that depend on periodic reevaluation of the project. (Pyles, 2014) as the value of many strategic investments does not derive so much from direct cash inflows, as it does from the options to invest in future growth. Strategic plans often encompass projects which, if measured by cash flows alone, typically would appear to have a negative net present value (NPV), when in fact they may have a positive total strategic value.(Smit and Trigeorgis, 2003)
This opportunity to invest can be seen as a call option, involving the right to acquire an asset for a specified price (investment expenditure) at some future time, the underlying asset may be a package consisting of the project plus the value of other embedded
11 | P a g e
corporate real options and the techniques derived from option pricing can help quantify management’s ability to adapt its future plans to capitalize on favorable investment opportunities or to respond to undesirable developments in a dynamic environment by cutting losses.(Smit and Trigeorgis, 2003)
1.4. Valuation Model’s Choice
However, how does one select a valuation model? According to (Jerald E. Pinto et al., 2010), when selecting this, there are three broad criteria required:
- To be consistent with the characteristics of the company being valued. - To be appropriate given the availability and quality of data.
- To be consistent with the purpose of valuation, including the analyst’s perspective.
The Real Options Valuation might be potentially good in the pharmaceutical industry however is challenged by the complex implementation and trouble to correctly realize it when the access to information on the projects and drugs in development are not obtainable, which was the case.
R&D expenses have the struggle that although they are expensed in the period in which they occur, the value of the assets does not show up immediately as part of the total assets. This makes it hard and uncertain to measure the capital and profitability ratios of companies in the biotechnology and pharmaceutical industry that spend millions of dollars on research and investigation and need to wait long periods of time of FDA approval, while reporting large losses when the product isn’t ready to sell. However, this can be opposed – there is not one “right” method as it should be a combination of factors. In the end of my research, I decided the best way to evaluate to Novartis would be to use the Discounted Cash Flow Model completed by my industry and company’s assumptions and the multiples EV/EBITDA and EV/Revenues.
2. Industry Overview: The Pharmaceutical Industry
Before analyzing this industry, it should be given a definition of what it consists of: the pharmaceutical industry comprises all the companies that manufacture, discover, develop and market medicaments and treatments.
Pharma companies are valued and examined in a different way than most. Their big capital expenditures on Research and Development shouldn’t be treated like a regular
12 | P a g e
company, since this department is the heart of these companies. Additionally, nowadays, there are many trends to reflect when investing and evaluating companies in this industry. These companies, as stated before, invest heavily in R&D to develop new treatments in different medicine specialties since new drugs are generally more effective than older ones and as the industry continues to be hurt by the perception that rising product prices hurt costumers, this is the pattern to survive the competitive industry they’re in. (Argus Research, 2018)
As in any other competitive industry, there are leading companies and projections on whether these companies have what it takes to stay in the lead. In the pharmaceutical industry, at the moment and since 2017, Novartis, Pfizer, Roche, Johnson & Johnson and Sanofi are considered the Top 5 and are estimated to stay this way.
According to (Evaluate Pharma, 2018), this is the Worldwide Market Share of the most important competitors in this business, in 2017 and the estimations for 2024.
Company WW Market Share Rank
2017 2024 Change (+/-)
1. Novartis 2. Pfizer 3. Roche
4. Johnson & Johnson 5. Sanofi 6. GlaxoSmithKline 7. Merck & Co 8. Abbvie 9. AstraZeneca 10. Bristol-Myers Squibb 11. Amgen 12. Novo Nordisk 13. Celgene 14. Eli Lilly 15. Bayer 5.3% 5.8% 5.3% 4.4% 4.3% 3.6% 4.5% 3.5% 2.5% 2.4% 2.8% 2.2% 1.6% 2.3% 2.2% 4.4% 4.3% 4.2% 3.9% 3.7% 3.2% 3.2% 3.1% 2.6% 2.4% 2.1% 2.0% 2.0% 1.8% 1.6% +1 -1 +0 +1 +1 +1 -3 +0 +2 +2 -1 +4 +8 -1 +0
Table 1: Worldwide Prescription Drug Sales in 2024: Top 15 Companies
It can be observed that Novartis, Pfizer and Roche are the all very similar, but Pfizer is leading at the moment. Something that is projected to change in 2024, with Novartis evolving to nº1 in terms of market share.
On the other hand, it can be seen a decline in all the companies’ market share, in 2024. According to (Evaluate Pharma, 2018), this is caused by the expectation that
13 | P a g e
biotechnology products will represent 31 % of the market in 2024, an significant increase since its 25% in 2017. Likewise, within the world’s top 100 products, these will represent 52% of sales, versus 49% in 2017.
The increase and decrease of pharmaceutical prices are also a polemic discussion now more than ever as Mr. Trump released his Drug Pricing Blueprint. President Trump’s blueprint will seek to encourage innovation, while also promoting price competition and addressing foreign freeloading. As its stated that “excessively high drug prices, foreign freeloading, and a system rigged to reward list price increases, are burdening the American people” (Services, 2018)
Novartis, like all branded pharmaceutical companies, European or US based, face various threats including drug trial failures, big periods of approval by FDA, pricing pressure from the industry and political pressure in the costs of drugs (Novartis AG and Xnys, 2019) so Mr. Trump’s decisions is definitely an effect factor.
Mr. Trump’s speech on lowering drug prices didn’t specify many topics other than confirming that he was making an announcement about reducing the middleman profits and that prices of drugs should be much higher outside the US. Nevertheless, these statements aren’t found applicable as we see Big Pharma/Biotech companies’ competitive advantage supported by strong pricing power given by their patent protected drugs and also based on the 2019 U.S. government budget proposal and the Council of Economic Advisors we expect only minor negative distress to branded drug prices(Novartis AG and Xnys, 2019)
So far since the drug pricing blueprint announcement, FDA has approved more generic drugs in July of 2018 than any month in history and big pharmaceutical companies such as Novartis, Merck and Pfizer have announced that they aren’t increasing drug prices for the rest of 2018. However, these are major companies that already have instituted their annual prices increases so many specialists defend that patients will not sense savings from these prices restrictions and these deviations will account for a minimal portion of the company’s revenues. (Samantha DiGrande, 2018)
Furthermore, there is a new trend in the pharmaceutical industry that is the technological sector entrance in this industry.
The world has understood the benefits and quickness that comes with med-tech devices being used for medical proposes. (Argus Research, 2018) then soon the big pharma companies will want to adapt to these projects and changes to yield better health results for patients, from their drug R&D to how doctors diagnose and treat diseases. According
14 | P a g e
to (Deloitte, 2017), artificial intelligence, real-world evidence, robotic and cognitive automation will have the potential to improve study design, physician and patient recruitment and in-trial decision making, which will increase the efficiency of repetitive tasks.
Patent protection is also a common aspect in this industry as without them, innovative products will not generate high returns due to “copy-cats” or generics. These are protected for up to 20 years as according to (Koller, Goedhart and Wessels, 2000) the business can charge a price premium during this period and even afterwards as the holder still may enjoy some price “stickiness”.
According to global news and consulting firms as PwC and Arthur D Little, there are specify key drivers to consider in the evolution towards the pharma industry in 2020. (Jan, 2016) (Jan, 2016)(PwC, 2020). This analysis can be read on Appendix 3.
3. Company Overview: Novartis AG
Novartis AG is a publicly traded Swiss holding pharmaceutical company with a goal to reach global scale, discover and develop innovative products along with answering to all new opportunities and risks that the pharma industry has to offer. Novartis’s strategy is very focused in the benefits that Research and Development brings. Showing a solid record of innovation developments, having 16 major approvals as well as six FDA breakthrough therapy designations and 16 major submissions in 2017 alone (Novartis AG, 2018d)
The Company's range of products includes innovative pharmaceuticals and oncology medicines, generic and biosimilar medicines, and eye care devices. The company has three business segments focused on areas of healthcare, those being the Innovative Medicines Division, Sandoz and Alcon.
- The Innovative Medicines Division that is divided in two business units: Novartis Pharmaceuticals and Novartis Oncology
- The Sandoz Division that manufactures generic pharmaceuticals and biosimilars - The Alcon Division that is involved in surgical and vision care products and
15 | P a g e
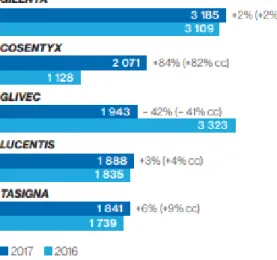
Novartis stands out for its portfolio of blockbusters in the Innovative Medicines Division, which include Gilenya used in multiple sclerosis, the drug Entresto for heart failure, the immunology drug Cosentyx and Afinitor, and Tasigna for cancer in the Oncology Unit of this division.
The Innovative Medicines Division is the largest contributor among the divisions of Novartis representing 67% of Group Net Sales and reported consolidated net sales of USD 34.9 billion. This division’s portfolio includes more than 60 key marketed products, many of which are leaders in their respective therapeutic areas.(Novartis AG, 2018c) Sandoz comes right after accounting for 19% of Group Net Sales, reporting for USD 9.9 billion in 2018 and Alcon represents 14% of the company’s Net Sales, accounting for USD 7.1 billion.
At the moment, Novartis appears to be taking a strategic step to transform the Sandoz Division towards more differentiated products and agreeing to sell selected fractions of the division, namely the Sandoz US dermatology business and generic US oral portfolio, reshaping the portfolio in order to compete in a more challenging environment.
Novartis’s decision to spin off its eye-care division, Alcon, is expected to bring changes but not negative ones as the spin-off is in line with the company’ strategy to focus more on human prescription drugs. This has been shown over the years, with the divestitures of the vaccine, animal health, and consumer healthcare businesses, being in the best interest of shareholders.
Figure 1: Top 5 Products from the Innovative Medicines Division. Source: Novartis 2017 Annual Report
16 | P a g e
Alcon, however, continues to show solid sales growth as a result of improved operations and costumers’ relationships, both in the Surgical division and Vision Care division, both sales’ increasing around 7% and 3%, respectively.
Vision Care will be the one division maintained in the company as the Alcon Ophthalmology Pharmaceuticals portfolio will remain with Novartis, strengthening its leading ophthalmology pharmaceuticals business. In addition, Alcon’s results reflect the second consecutive years of net sales growth.
Regardless of this decision or the recent patent loss on Gleevec/Glivec, a product used in the Oncology Unit, Novartis is considered and well-positioned operating company that should translate its strong pipeline of new products and clear innovative mindset into steady growth. (Novartis AG and Xnys, 2019).
Novartis is pursuing new indications and building out the data profile for Cosentyx,
Entresto and Gilenya. It is expected that Cosentyx will be Novartis' largest drug next
year, the confidence invested has been from 100 studies and an extensive phase III clinical trial program, including three approved indications and a potential fourth.(Communications, 2019). These products growth can be checked in Appendix 4. Diversity is also present in Novartis, its products are sold in about 155 countries, the company reached nearly 1 billion people globally in 2017 and there are about 126 000 employees of 145 different nationalities. Its products are sold globally, in Europe where its headcounters are based, the United States, Asia, Australia, Africa, Canada and Latin America.(Information, National and Scotland, 2017). (Appendix 5)
Complementing the overlook of the industry that Novartis is inserted, it was conducted a SWOT Analysis for future assistance in the forecasts computed for the company’s valuation, inserted in Appendix 6. This analysis was based on the information from Morgan Stanley Wealth Management (Novartis AG and Xnys, 2019), the 2017 and 2018’s Annual Reports and information contained in the Industry Overview.
4. Novartis’s Historical Performance
To reach the target price that will represent Novartis’s valuation in the market, the historical performance of the company was analyzed considering the pharmaceutical industry and the market today as a way to predict Novartis’s future performance and results.
17 | P a g e
To do so, it was used the latest annual report from 2017 and 2018 and the previous 6 year’s financial statements. To evaluate its historical performance, it was computed the company’s Net Debt and consequently the Debt/Equity ratio, the evolution from 2013 to 2018 in the its Revenues, EBITDA and EBITDA’s Margin (inserted in Appendix 9), EBIT (Appendix 7), Net Income and Share Price (Appendix 19)
Following this, it was computed the company’s NOPLAT (in Appendix 10) and ROIC.
4.1.Debt/Equity Ratio (D/E) and Net Debt
The D/E ratio quantifies a company's financial leverage and is calculated by dividing a company's total liabilities by its shareholders' equity. This ratio was computed both in book value and market values.
Concerning the market value of debt and market value of equity, explained in later chapters of this dissertation, Novartis’s D/E rounds precisely 11%. This market approach, which it will be the one considered in the valuation, reflects that the company maintains a relative stable target level in their capital structure considering the industry which is in. This ratio, however, appears higher when computed with the accounting numbers provided by the company. The historical book value D/E ratio has ranged between 24% and 41% in 2013-2018 increasing every year, however, has stabilized in the last couple years between 39% / 41%, allowing an average of 32%.
2013 2014 2015 2016 2017 2018 Average Median
24.2% 28.8% 28.5% 31.8% 38.5% 40.9% 32.1% 30.3%
Figure 2: Historical Book Value D/E Source: Dissertation computations
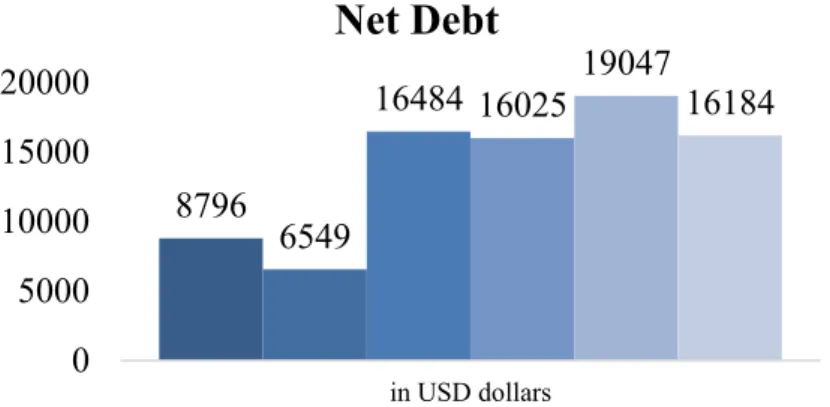
As for the book value computation of the company’s Net Debt it was summed the non-current debt and subtracted the Cash and Equivalents and the Current Investments and Financial instruments from the Current Debt. Net Debt has been increasing since 2013 until 2017. However, 2018 has seen changes, net debt decreased to USD 16.2 billion compared to USD 19.0 billion at December 31 of 2017, due to an increase in cash and cash equivalents.
18 | P a g e
Graph 1: Net Debt from 2013 to 2018
4.2. Revenues
Novartis made substantial progress in 2017 and 2018. Alcon returned to growth, launched important new products, and benefited from efficiency gains delivered by Novartis Business Services and the recently established global drug development and production organizations. Despite navigating the final year of the Gleevec/Glivec patent expiration, the Group net sales grew by 2% in constant currencies (cc) and 5% in 2017 and 2018, respectively, presenting growth increase.
This performance is being driven by recently launched products such as Cosentyx and
Entresto. Cosentyx, on their treatment for psoriasis and other autoimmune diseases,
reached multi-blockbuster status and grew strongly across all indications, with sales rising 37% to USD 2.8 billion and expecting to maintain strong access in US. As for Entresto, the product for heart failure, was able to double its sales from USD 507 million to 1 billion. In addition to this, Novartis has 10 potential blockbuster launches planned in the next 2 years, 4 being in 2019 and being in 2020.
Sandoz is expanding access to biosimilars, and Novartis has currently a leading portfolio with five biosimilars now on the market. However, Sandoz net sales were down 2% due to fierce price competition in the US and generic competition.
Alcon made significant progress on its turnaround, returning to growth and building momentum toward the end of the year, supported by the launch of innovative new products and continued double-digit growth in sales of their Dailies Total contact lenses.
Table 2: Historical Revenues by Business Division
8796 6549 16484 16025 19047 16184 0 5000 10000 15000 20000 in USD dollars
Net Debt
2013 2014 2015 2016 2017 201819 | P a g e
Novartis was recognized in sustainability rankings, including Fortune magazine’s “Change the World” list (at Nº 4) and “World’s Most Admired Companies” list for the pharmaceutical industry (at Nº. 2). Fourth in the 2017 Dow Jones Sustainability Index (DJSI) World, and we re-entered the DJSI Europe Index for the first time in four years. It was again recognized as one of the world’s most sustainable companies by Corporate Knights, and one of 73 companies worldwide to make Carbon Disclosure Project (CDP)’s Water A List. (Novartis AG, 2018b).
It’s important to state that 2015 was a year of big changes for Novartis, in which they discontinued a lot of operations, in terms of Vaccines, Consumer Health and Animal Health, which account for the sudden decrease on Revenues that can be observed.
In USD billions 2013 2014 2015 2016 2017 2018 Innovative Medicines 32 416 32 053 30 582 33 186 32 946 35 633 Sandoz 9 453 9 848 9 285 10 248 10 178 10 036 Alcon 10 546 10 876 9 857 5 812 6 774 7 153 Corporate -325 -358 -284 -728 -789 -922 Other revenue 911 1 215 947 918 1 026 1 266
Sales to discontinued segments 72 239 26
Total Revenues 53073 53873 50413 49436 50135 53166 0,00% 1,51% -6,42% -1,94% 1,41% -7,00% -6,00% -5,00% -4,00% -3,00% -2,00% -1,00% 0,00% 1,00% 2,00% 2013 2014 2015 2016 2017 Revenue Growth 53073 53873 50413 49436 50135 53166 47000 48000 49000 50000 51000 52000 53000 54000 55000 2013 2014 2015 2016 2017 2018 Revenues
20 | P a g e 4.3. Operating Income (EBIT)
Operating income in 2017 was USD 8.6 billion (+4% from 2016),largely driven by sales’ increase, productivity improvements and lower amortization, which were partly offset by generic competition and higher marketing investments. However, this variable in 2018 shown a decrease of 5%, accounting for USD 8.2 billion, mainly due to the impacts from M&A transactions, higher restructuring and net impairment charges, and growth investments, partly offset by higher sales. (in Appendix 7)
4.4. Net Income
Net Income is the company’s earnings, the Revenues adjusted for all the expenses incurred while doing business.(Bollinger, no date).
2017, at USD 7.7 billion and a 15% increase, was benefiting from growth in operating income and income from associated companies (higher income from the stake in GSK Consumer Healthcare Holdings Ltd).
However, 2018 brings even better results, and Novartis this year reached about USD 12.6 million, still mainly because of the benefits that come from the divestment of the stake in GSK Consumer.
Table 3: Historical Net Income
2015 accounts for the year with the highest net income for Novartis for the fact the year benefitted from the USD 10.8 billion net income from discontinued operations, which included USD 12.7 billion of exceptional pre-tax divestment gains and the operational results of the divested businesses. 2016, however, accounts for the lowest net income values mainly due to the exceptional divestment gains included in the net income from
9292 10280 17794 6698 7703 12614 988 7514 -11096 1005 4911 -15000 -10000 -5000 0 5000 10000 15000 20000 2013 2014 2015 2016 2017 2018
Net Income
21 | P a g e
the discontinued operations of the prior year. Since 2016 that the company has seen a growth in this matter every year afterwards.
4.5. ROIC and Return on Research Capital Ratio (RRCR)
One of the key ingredients of corporate value is the company’s return on invested
capital. It measures how profitable is a company with the amount that has been invested.
This ratio analyses the performance better than ROE or ROA because it focuses solely on a company’s operations, in addition to this ROIC also differs by industry. The pharmaceutical industry relies on sustainable competitive advantages such as patents and brands and therefore tend to have high median ROIC.(Koller, Goedhart and Wessels, 2000).
This measure was taken from Thomson Reuters Eikon, which is calculated as income after tax for the fiscal year divided by the same period average total long-term capital and is expressed as a percentage. Total long-term capital was represented by the sum of total equity, total long term debt, deferred income tax and total other liabilities.
From the table below, it can be seen that the company’s ROIC has decrease from 2014 to 2016 However, since 2016 that the company has seen this measure increase, being 2018 the year that accounts for the highest ratio yet.
Although it looks to be a low ROIC for a pharmaceutical company, Novartis appears in line with its closer peers with exception to Roche Holding AG which accounts for 2x its ROIC.
According to (Koller, Goedhart and Wessels, 2000), the combination of growth and return on invested capital (ROIC), relative to its cost, is what drives value. Which means that, a company will create value only if its ROIC is greater than its cost of capital (the
2013 2014 2015 2016 2017 2018 Novartis AG 9.3% 10.8% 6.8% 6.2% 7.0% 11.20% Roche AG 26.2% 20.1% 18.1% 19.2% 17.0% 20.80% Pfizer Inc 7.5% 6.2% 4.9% 5.2% 8.5% 7.7% Merck & Co 5.3% 14.5% 5.5% 4.9% 6.8% 9.6% Bayer AG - 7.3% 7.3% 6.4% 5.3% 2.1%
Table 4: Novartis and Peers’ ROIC. Source: Thomson Reuters Eikon
22 | P a g e
opportunity cost for its investors) which it did happen, as Novartis's cost of capital accounted for 5.03% and in 2017 and 2018, ROIC was 7% and 11,30%, correspondingly. In addition to this, given that there are industries known for higher expenditure on R&D, like tech or pharmaceutical, it was considered important to see R&D’s evolution in Novartis.
Using the R&D/Revenues, which provides knowledge on what % of Revenues are allocated to R&D expenditures, it was achievable to see that Novartis has 16.3% of their Revenues allocated to R&D expenditures. Taking the Thomson Reuters Eikon data, it was possible to observe that this percentage is slightly below the industry average and median, 18.6% and 18%, respectively. (in Appendix 8). This measure presents normal values within its peers, being Pfizer the most similar company.
As it can be seen, R&D expenditure is important to pharmaceuticals in the competition for innovative products and their expensive development. Therefore, it was considered Return on Research Capital (RRCR) would be a relevant metric to take in consideration. As R&D involves a lot of spending and payoff that are hard to measure, this ratio measure how much of the Revenues are a result of the expenditure made on R&D. RRCR is computed as it follows:
Return on Research Capital = Current year’s Gross Profit / Previous year’s R&D
Expenditure
in USD millions 2025E 2026E 2027E 2028E
Gross Profit 40907 41255 41461 41667
Research & Development 10423 10632 10844 11061
RRCR 4.00 3.96 3.90 3.84
With the estimates of R&D and Gross Profit for 2019-2028, it was computed the RRCR ratio. Which according to historical and estimated values, for every USD 1 Novartis spent
in USD millions 2013 2014 2015 2016 2017 2018 2019E 2020E 2021E 2022E 2023E 2024E
Gross Profit 36494 36528 33009 31916 32960 34759 36268 37371 38316 39215 39882 40532
Research &Development 9071 9086 8935 9039 8972 9074 9255 9441 9629 9822 10018 10219
RRCR 4.03 3.63 3.57 3.65 3.87 4.00 4.04 4.06 4.07 4.06 4.05
Table 5: Historical and Forecasted RRCR Source: Dissertation estimates
23 | P a g e
on R&D, they achieved a return of USD 4 in gross profit, thought out all years. However, this computation assumes a one-year average investment cycle for R&D and since it was not possible to have access to the % of R&D made into profit, this ratio only gives the investors a view of what R&D might bring to the table.
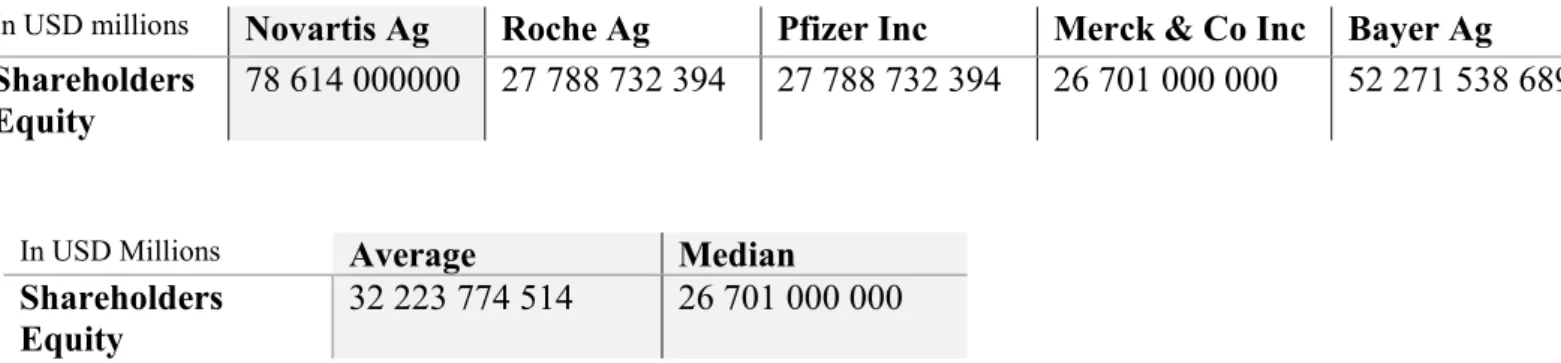
However, the fact that Novartis’s ROIC appears to be twice as high as the estimated WACC proves that the company is value generating. In addition to this, according to (Damodaran, 2009), the value of the research assets augments the value of the assets and consequently the book value of equity. Here is where Novartis significantly makes a difference in comparison to its peers, presenting a value of shareholder’s equity quite above the average and median of industry and for this reason reflecting its competitive advantage.
In USD Millions Average Median
Shareholders Equity
32 223 774 514 26 701 000 000
Table 6: Novartis and Peers' Shareholders Equity Source: Thomson Reuters Eikon
5. Company Valuation
5.1. Chosen Model
Now that are known the industry and the company’s conditions as well as the methods available to do a valuation, it was chosen to firstly start by using the Discounted Cash
Flow Model as the company is considered to have a stable capital structure, avoiding the
errors that can happen when companies are expecting to change in the future.
This model will aim to predict the future performance of Novartis for the next 9 years and will have into account quantitative and qualitative assumptions.
5.2. Assumptions
Currency and Inflation: Novartis is a Swiss multinational pharmaceutical company and
although it would be expected the company to report in Swiss Franc (CHF), the financial In USD millions Novartis Ag Roche Ag Pfizer Inc Merck & Co Inc Bayer Ag
Shareholders Equity
24 | P a g e
statements and annual reports are reported in dollars (USD). Minding this, all computations and values thought out this dissertation are in USD or converted to USD and in constant currencies just like the company reported in their annual reports.
Growth rates: When treating capital expenses such as R&D as operating expenses, it’s
lost the most potent tool for not only estimating growth but also for checking for internal consistency. When confronted with this situation according to (Damodaran, 2009) its best for analysts to not rely so much on the fundamentals and base their decisions on the type of company. This will be taken into account when making decisions about growth. To do so, own judgments on future growth based on history, investor’s presentations, trustworthy reports about the company itself, its peers and the industry nowadays and in the future will be used to make decisions.
Taxes: An 14% effective cash tax rate was used, in-line with the average of the historical
rates applied from 2013 to 2018. Novartis’s majority of sales are both inSwitzerland, the company’s headcounters, and in its subsidiary in the US. Seeing that the swiss corporate effective tax rate of 2018 is 17,77% and the taxes on income earned in the US subsidiary is 10,33%, it was also acceptable to consider 14% as an effective tax rate as the average of rates of both places amounts for 14,05%.
The tax rate in 2018 was 8.8% compared to the prior 14,4%, due to the impact on taxes of the divestment of the 36.5% stake in the GSK consumer healthcare joint venture. However, according to (Novartis AG, 2018a), when excluding this impact, the tax rate in 2018 would’ve been 14,4% in line with the prior year, as the benefit from satisfactory profits mixed was offset by the effect from the discontinuation of the recognition of the income from associated companies related to the GSK joint venture. This tax rate will remain constant during the forecast period since there are no events expected to change this assumption.
Innovative Medicines Division: This division in Novartis will continue to increase
meaningfully in line with 2018 in revenues due to all the conditions mention above.
Entresto is now a blockbuster, Cosentyx and Gleevec/Glivec are expected to increase in
25 | P a g e Generics: It will be followed the company’s Investors Relation report that it will be
assumed no Gilenya generics will enter in 2019. (Novartis AG, 2019).
R&D Benefits
The Revenues forecast section will consider the R&D benefits as accounting numbers presented on publicly traded companies do not typically represent the fair value of R&D investments (Deloitte and Thomson Reuters, 2010).A pharmaceutical company can have loads of drugs in its development pipeline but that does not mean it should be included in the valuation. For this reason, I assumed that any investment on a drug that it’s still in discover/pre-clinical stage is assigned to be a zero-market value. So, to every product that today is believed to grow because of the R&D effort put in before and is today a blockbuster will have a rate that will benefit in terms of sales and should show its market potential, this will be followed by the information available by the company, market research reports and my own best judgment on the industry. This goes especially to specific drugs in the Innovative Medicines Division stated before.
EBITDA
Given the stable values from 2013 to 2018, it is assumed that from 2019 to 2024, this measure will grow at the average growth rate of the 4 last years (2.42%) and afterwards will slow down its pace and grow at 1.40% until 2028.
5.3. Novartis’s 2019-2028 Forecast
In order to ultimately reach the value of the company and fill the company’s business plan, it was begun the forecast of financial statements to deliver the information compulsory to compute the DCF and the selected multiples.
Forecasting Revenues
Since the information for revenues on the pharma industry and Novartis are accounted annually, this will be the way it will be forecasted in this dissertation.
According to the Media Presentation of Q4 and FY 2017 Results and Q4 and FY 2018 Results on Novartis it was possible to assume prospective for the 2019 and subsequently. The Global Head Drug Development & CMO of Novartis, Vas Narasimhan, presented the future direction of Novartis and these guidelines will be in mind for the forecasts as
26 | P a g e
Novartis has a good history of accomplishment and over perform their operational and financial targets.
Barring unforeseen events and the industry overview stated before, group sales are expected to grow low to mid-single digit which I preview to be about 4% in 2019. Given the large increase in 2018 (6%) and the changes in the industry, I decided to take a conservative approach and follow the company’s guidelines but apply my judgement on the fact technology will have positive and negative impacts on total revenues. However, forecasting the company as a whole and not take into account each of the division’s growth rate would not lead to a credible valuation so this dissertation considers the general information given from Van Narasimhan.
The expectations on Novartis becoming the top pharmaceutical company in the world is in line with the news and ideas that the company’s management is planning, as its focus in expanding its innovative medicines business solely.
The company announced the agreement to acquire Endocyre, a company specializing in prostate cancer therapies, valued at approximately USD 2.1 bn, expanding their nuclear medicines platform. This news revised upwards its guidance for full-year sales, expected to contribute to groups sales in 2021 (Novartis AG, 2018e) and Novartis’s management said Endocyte acquisition would strengthen its capabilities in radiopharmaceuticals, which it expected to be a “key growth driver” for its business.(Financial Times, 2018) Similar to the outlook for 2018, Novartis expects group core operating income to grow by a mid to high-single digit rate, which my prediction would be about 6.94%.
As previously mentioned, Novartis AG is divided in 4 segments that have different importance in the company’s results and revenues as well as different growth prospective and target markets. (Miller, 2018) (forecasts in Appendix 11)
- Innovative Medicines Division is expected to grow mid-single digit, about 6% in 2018. Taken that the majority of revenues come from this division throughout all historical years and that there are products in this division expected to outperform1,
this is a very positive factor for Novartis.
- Sandoz generics business is expected to slightly decline due to US pricing pressure, just in line with the prior year which it will account for a decrease of 1%.
This division is expected to continue to invest in development of biotechnology-based medicines intended to sales as “biosimilar versions” and also as other
27 | P a g e
differentiated and “harder to make” generic products, which I believe will increase the division’s growth in the consecutive years.
- Alcon’s eye care business is predicted to grow low at a mid-single digit pace which I predicted to be similar to last year, about 5%.
Novartis’s Total Revenues (in Appendix 12) also include a % of “Corporate Activities” and a % of “Other Revenues”. Corporate Activities comprises other items of income and expense that are not attributable to specific segments, as for example, some revenues from intellectual property rights and some expenses associated to post-employment benefits, environmental remediation liabilities, charitable activities, donations and sponsorships. These were forecasted as an average of the last 3 years, since these have been increasing since 2016.
As for the Other Revenues, these incorporate an early release of deferred income associated with collaboration agreements. Novartis maintains stable values ranging from USD 911 M to USD 1226 M, therefore this section was estimated computing the average of the last 3 years, every year, using the same reasoning from above.
All of the growth rates applied and mentioned above are in line with the Worldwide Prescription Drug Sales rate for 2018-2024, that being 6,4%.
According to Evaluate Pharma’s World Preview 2017, Outlook to 2022, Novartis is predicted to return to the top spot with expected sales of $49.8bn in 2022, compared with $49.7bn for Pfizer and $49.6bn for Roche. This prediction is only considered to change if it happened a big profile failure change in their rankings.(Lervolino and Urquhart, 2017).
In this year’s Evaluate Pharma’s World Preview 2018, Outlook to 2024, Novartis is forecasted to be nº 1 in 2024 with $53.2 bn total worldwide prescription sales and in terms of Innovation, it’s expected to reach the highest value pipeline (NPV) at $22.9 bn in that same year. (Lervolino & Urquhart, 2017) However, given the conditions in the industry and the outlook for the company, I expect Novartis to exceed these projected numbers, reaching USD 61 996.30 bn in total sales for 2024 and NPV at $23.5bn in that same year, given the company’s wide-ranging portfolio of innovative medicines, therapeutic areas and additionally the fact that not only Novartis has at the moment 3 drugs among the world’s top 50 selling drugs but in 2024 is forecasted to have around 10 products with sales over $1bn and an extra 12 products with sales over $0.5bn by 2024. (Evaluate Pharma, 2018)
28 | P a g e
As discussed in the Company and Pharmaceutical Industry Overview, I expect that the viewpoint for this industry in the near and long-term future to be positive even being a highly competitive sector. Due to my optimistic perspective and to Novartis’s increasing sales and lead trends, for 2019 and the during the next 9 years I believe it will show its improved results. I expect the company’s total revenues growth to increase 3.67% in 2019, 3.05% in 2020, 2.53% in 2021, 2.36% in 2022, 1,71% in 2023, 1.64% in 2024, 0.93% in 2025, 0.85% in 2026, 0.50% in 2027 and 0.50% in 2028 reaching for its best results yet.
Forecasting Operating Expenses and Operating Income (EBIT)
According to Novartis, Operating expenses includes Cost of goods sold, Research & Development, Selling General & Administration, Other income and Other expense. (in Appendix 13)
Other income and Other expense include reversals and charges related to the impairment of property, plant and equipment and as it was chosen that property, plant and equipment is driven by revenues, this dissertation will consider the forecast of other income and other expense as well driven by revenues.
In addition to this, Cost of goods sold and the Selling General & Administration section, that includes Marketing and Sales, were assumed to be driven by revenues as well.
Forecasting R&D
Forecasting R&D and adding its profits correctly to be valuation it was tricky as in pharmaceutical companies, this concept is the heart of the business.
R&D is essentially an investment and it should not be seen only as an expense. It was used a rate of 2% throughout time, based on the historical fraction of investment in R&D that the company appears to have. I estimate that the company will then reach its highest spending in R&D at USD 11 061 M in 2028, as it can be observed in Appendix 13. My estimates appear to be in line with (Evaluate Pharma, 2018) as Evaluate Pharma predicts Novartis will spend about 2% per year until 2024, being one of the Top 10 Companies investing in R&D as nº 3 on the list, being overtaken by Roche (nº1) and Johnson &Johnson (nº2)
29 | P a g e Forecasting Depreciation and CAPEX
Depreciation occurs when the value of the asset has been used up, usually this includes the property, plant and equipment (PP&E).
CAPEX combines all the capital expenditures of the company and it was assumed that the true proxy for this would be the sum of Novartis’s purchase of PP&E and intangible assets.
As the company moves towards steady state, CAPEX will gradually meet Depreciation because in this condition the company is not expected to grow significantly and begins to invest less to support growth and more to replace its assets.
Since 2015 that depreciation has been increasing, so for this section’s forecast it was decided that from 2018 onwards it would grow at the average of last 4 years’ growth rates, at a reasonable growth rate of 7%. As for the CAPEX, a similar approach was given, as the purchase of PP&E and intangible assets were stable at a recurring amount, it was forecasted as the average of the last 3 years for the next periods. As a consequence, the CAPEX/ Depreciation ratio is 1.17. (in Appendix 14)
Forecasting Net Working Capital
Net Working Capital is defined as the difference between Current Assets and Currents Liabilities of the current period, less the different between these two sections at the previous period.
Novartis’s Current Assets were defined as the sum of the Inventory, Trade Receivables, Income Tax Receivables, and Other Currents Assets.
Novartis’s Current Liabilities were defined as the sum of the Trade payables, Current income tax liabilities and Provisions and other current liabilities
Each component was forecasted accordingly (in Appendix 15), “Trade Payables” was estimated according to the Inventory. “Current income tax liabilities” estimates were the average of the last 3 years, every year as this section was mainly constant thought out time.
“Provisions and other current liabilities” were assumed to maintained constant for the next 6 years, in which was applied the average of the last 5 years, every year.
In terms of Current Assets, “Inventory” was forecasted in function of their Cost of Sales. “Trades Receivables” and “Income Tax Receivables” were estimated based on Revenues.
30 | P a g e
Since “Other current assets” is a section that remains constant during the historical years, it was projected an average of the last 5 years.
Cash and Equivalents were backed out of the formula, as this section was assumed to be an investment for treasury bills, short term government securities or commercial paper. According to Damodaran, this section earns a fair return and for valuation purposes it should not be included in measures of working capital (Damodaran, no date)
Net Working Capital, according to this dissertation’s assumptions, is expected to decrease and maintain constant values after 2019. Working Capital changes from 2023 onwards are smaller, consistent with the assumption that current assets are balanced by current liabilities which a steady-state scenario implies.(Mario Massari, Gianfranco Gianfrate, 2016)
Forecasting Deferred Taxes, Inventories and Accounts payable
For Deferred Taxes Assets, since its tied with operations so it will grow with Revenues. Deferred Taxes Liabilities. Inventories and Accounts payable were driven by the Cost of Goods Sold
Forecasting Interest Expense and Interest Income
These sections were forecasted according to (Koller, Goedhart and Wessels, 2000) as interest expense (or income) is tied directly to the liability (or asset) that generates the expense (or income). Hence, the appropriate driver for interest expense is total debt. Total debt, however, is a function of interest expense, and this circularity leads to implementation problems. To avoid the complexity of this feedback effect, interest expense is forecasted as function of the prior year’s total debt which it was done to simplify the model and minimize implementation error.
Forecasting interest income was computed with the same reasoning, forecasted based on the asset generating the income.
Interest Expense’s forecasting were then based on the company’s Prior Year Total Debt balances, as it was used the forecast ratio: interest expense t / total debt t-1. Novartis has presented thought out the period considered (2013-2018) constant levels of debt, which I considered to continue in my forecasted period. From 2019 to 2028, I considered it the average of the last 6 years, every year.
Interest Income of the company were based on the company’s Prior Year Cash Excess, as it was used the forecast ratio: interest income t / excess cash t-1. Minding this, excess
31 | P a g e
cash was computed as Current Assets minus Current Liabilities, plus Cash and Cash Equivalents.
5.4. WACC
With regard to reach the present value of operations, one would discount each period’s forecast of free cash flow and when doing so, make sure to discount taking into account the risk faced by all investors of the company. That’s where the Weighted Average of Cost of Capital (WACC) sets in, WACC is the rate of return required by the company’s debt and equity investors from investing and therefore the appropriate discount rate for the free cash flow.(Koller, Goedhart and Wessels, 2000)
WACC based models as the enterprise DCF and profitability/excess returns models, work its best when it is expected that the company’s capital structure is not changing significantly, as it is the case for Novartis based on its historical values and prospective. The WACC formula uses market values of debt (D) and equity (E), multiplied by each of their costs (k). The cost of debt is lowered by the marginal tax rate, it appears defined as it follows:
5.4.1. Cost of debt
According to (Damodaran, 2015), the cost of debt is the rate at which you can borrow at
currently, as it will reflect not only your default risk but also the level of interest rates in the market. We can reach this cost through two approaches: the yield to maturity on the
outstanding long-term bonds from the company and use it as the interest rate or based on the rating of the company, estimating a default spread based upon the rating. Both of these will be computed, compared and taken into account.
To compute the cost of debt through the 1st stated approach, it was calculated the weighted
average yield of Novartis’s 23 bonds presented on Thomson Reuters Eikon.
As the company reports in USD but appears to have the YTM of the bonds outstanding in the headcounters’ currency (CHF), in order to compute the credit spread that characterizes the company’s risk it will be subtracted to this weighted average, the risk free rate on the currency of the company’s bonds (CHF). It was then used the 10 years
32 | P a g e
Switzerland Government Bond (-0.312%) as the rate’s maturity was chosen accordingly to the average maturity of Novartis’s bonds.
Next, to arrive at the cost of debt, it was summed the risk-free rate of the currency on the company’s reports (USD) and the credit spread. With the same reasoning, it was used the 10 years US Government Bond (2.64%)
Cost of Debt = Risk Free Rate + Credit Spread = 2.64% + 0.47% = 3.11%
Although this dissertation will use the cost of debt computed using the company’s bonds yields, it was compared how much the 2nd approach yield similar values.
According to Aswath Damodaran (Damodaran, 2019c), when the data to fulfill the computations in the 1st approach isn’t available, one should look up the rating of the company and estimate the default spread upon the rating. Thereupon, it was used the author’s file on Ratings and Coverage Ratios.(Damodaran, 2019c)(Damodaran, 2019b) As for the end of 2018, Moody’s Investor Service rated Novartis as AA. This fact would add up to a spread of 1%, which summed to the US Risk Free Rate (2.64%) would yield a cost of debt of 3.64%, considered very similar to the dissertation’s cost of debt. After deducting the taxes afterwards at a tax rate of 14%, it was given a cost of debt of 2.67%.
When examining the cost of debt of pharmaceuticals, according to Damodaran’s study of 237 companies in this sector it should be around 5,43% and about 4,07% after taxes, which Novartis appears to be lower. This study analyzes US companies and consequently can be unrelated to be considered, however, due to the fact that Novartis has 34% of revenues from the US it was taken into account the difference from its American competitors.
5.4.2. Market Value of Debt and Market Value of Equity
In order to estimate the market value of equity, one should multiply the number of shares outstanding for the current stock price of Novartis, which is fairly easy to obtain and reflects the market-wide and firm specific changes. (Damodaran, 2002)
33 | P a g e
To compute this value, it was used the access to Thomson Reuters, and it was reached a
market value of equity of 2 311 171 429 shares outstanding x 87.38 CHF2 = USD 208 826 208 324.
Likewise, according to (Damodaran, 2002), the challenging part is obtaining the market value of debt as usually companies do not have all their debt in the form of bonds outstanding trading in the market.
Novartis appears to have most of their debt publicly traded with exception to one bank loan that will be evaluated and then added to the market value of the bonds outstanding. To get this, one multiplied the amount issued of each bond by its last price.
Market Value of Bonds = CHF 21 311 057 867.47
As for the loan, it was computed the net present value of the loan and its YTM was assumed to be equal to YTM of a bond with the same currency and maturity.
Market Value of Bank Loan = CHF 1 601 923 076.92
The company’s debt added up to USD 23 162 961 567 when converted to US dollars
Total Market Debt= USD 23 162 961 567 5.4.3. Cost of equity
To reach the cost of equity, it will be used the Capital Asset Pricing Model (CAPM), in which needs to be considered the risk-free rate, the beta of the company and the market risk premium as the formulas is given by:
Cost of Equity = Risk Free Rate + Beta (Market’s Rate of Return – Risk Free Rate)
5.4.3.1. Risk Free Rate
The risk free rate is the starting point for both your cost of equity and cost of debt. If you define it, as I do, as the rate of return you would expect to make on an investment with guaranteed returns, an investment can be risk free only if the entity making the guarantee is default free and if you are not exposed to reinvestment risk.(Damodaran, 2016)
It was considered the US Government Bond of 10 years (2.64%) as the risk-free rate as it was taken into account the fact that all computations and values in this dissertation were in US dollars.
34 | P a g e 5.4.3.2. Beta and Market Risk Premium
For the Market Risk Premium, the New York Stock Exchange (NYSE) was the chosen index to proxy the market that Novartis is inserted. This decision was tricky as Novartis is both quoted in SIX index and in the NYSE, however, considering that Novartis is a European company exposed to US market risk given the similar % of sales both in Europe (36%) and the US (34%) and since this dissertation is reported in US dollars , these facts weighted more than the circumstance that the company has its headcounters in Switzerland. This index’s rate of return is 10.43%
The company’s beta measures its market or systematic risk, which in theory is the sensitivity of its returns to the returns on the market portfolio of risky assets (Jerald E. Pinto et al., 2010). So, to arrive at the beta that measure Novartis exposure, it was ran a linear regression with the company’s stocks monthly prices (31/01/2013 to 31/01/2019) as the dependent variable (y) and the NYSE prices as the dependent variable (x) resulting in a 0.0031beta. This, however, according to (Jerald E. Pinto et al., 2010), is the raw beta that in order to predict the future should be adjusted using the formula introduced by Blume (1971):
Adjusted beta = (2/3) * Unadjusted beta + (1/3) The adjustment results in a 0.34 beta which was used in the valuation.
5.5. Enterprise Value of Novartis
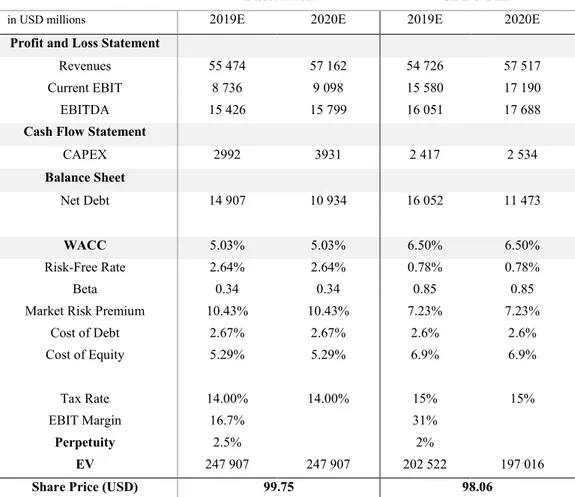
When all the above parameters are estimated, it is possible to compute the weighted average cost of capital which reached 5.03%.
Next, with this rate and using the FCFF approach, it is found an Enterprise Value of USD 247 518.06 bn. (in Appendix 16).
The enterprise value reflects the cash generated by company’s all assets, independently of how these assets are financed (capital structure of the company). (Janiszewski, 2011) However, this does not reflect the company’s true value for shareholders after all debts have been paid off, that is Equity Value.
In order to obtain Equity Value, one should sum two main components: Enterprise Value and the Terminal Value which is the sum of the cash flows multiplied by the cumulative discount factor for each year of the financial projections plus lastly detract the company’s non-operating assets/liabilities. (Janiszewski, 2011)
Eventually as Novartis grows, there will come a period that it will grow at a rate less than or equal to the growth rate of the economy it operates in. This stable growth can be