1
The Value of Social Networks
Pedro Miguel Gonçalves Rosa
Dissertation submitted in partial fulfillment of the requirements for the degree of IMSc in Business Administration at Católica-Lisbon School of Business & Economics
ADVISORS: Ana Isabel Almeida Costa June 2014
2
Abstract
Nowadays the growth of social networks is becoming more significant. Few are those who place themselves outside of this phenomenon as each passing year more and more people are involved through these online platforms. Social networks also significantly change the relationship client company. With social networks, consumer power is significantly increased and companies are now more than ever obliged to deal with consumer feedback. However social networks have also opened the door to other possibilities for companies to communicate, it is easier now to reach the end consumer due to the widespread use of networks. Social networks have become the only way for small businesses and startups manage to communicate with their customers.
However the link between social networks and return was never clear and with platforms, like Facebook, cutting down the distribution of organic content it is imperative to have a mechanism or method that enables companies can assess the value of a campaign facebook .
From this research is intended to obtain a method of analysis and to show it can be applied not only to a better understanding of the value of networks but also the management of day in the pages.
3
Sumário
Nos dias que correr o crescimento das redes sociais é cada vez mais significativo. Poucos são os que se colocam à margem deste fenómeno pois a cada ano que passa mais e mais pessoas estão envolvidas através destas plataformas online. As redes sociais alteração também significativamente a relação empresa cliente. Com as redes sociais o poder dos consumidores se aumentou significativamente e as empresas vêm se agora mais do que nunca na obrigação de lidar com o feedback dos consumidores. No entanto as redes sociais também abriram a porta a outras possibilidades para as empresas comunicarem, é mais fácil agora chegar ao consumidor final devido à massificação das redes. As redes sociais passaram a ser assim a única maneira de negócios pequenos e startups conseguirem comunicar com os seus clientes.
No entanto a ligação entre redes sociais e retorno nunca foi clara e com plataformas, como o facebook, a cortar cada vês mais da distribuição de conteúdo orgânico é imperativo ter um mecanismo ou um método que permita às empresas conseguirem avaliar o valor de uma campanha no facebook.
A partir desta pesquisa pretende-se obter esse método de análise e mostrar com este pode ser aplicado não só para a melhor compreensão do valor das redes mas também à gestão do dia nas páginas.
4
Acknowledgements
Foremost, I would like to thank to Doura Ana Isabel Costa, my academic adviser, for her amazing help, support, and guidance through all process of the making this dissertation. I would like to thank my academic adviser not only for her knowledge input but also for making me believe that it was possible to make something different. Without her effort and dedication this thesis would probably be of much lower value and for all that I am gratefully. I would like to thank my friend Abal for showing me Social Network Analysis and introduce me to sociometry and area that I am now completely in love with. Without his help this thesis would be completely different since social network analysis is the base of my dissertation. I would like to give special thank to my friend and business associate Hugo Almeida by his support and for holding the majority of the work at our company when I was ending this dissertation.
Additionally I would like to thank my family and friends for giving me the best support encouragement t ever. Without then I wouldn’t be possible.
Finally I would like to thanks the company I had worked with. Their cooperation during this process was crucial.
5
Table of Contents
Abstract ... 2 Sumário ... 3 Acknowledgements ... 4 Chapter 1: Introduction ... 71.1 Background and problem statement ... 7
1.2 Aims and scope ... 8
1.3 Methodology ... 9
1.4 Managerial and academic relevance... 10
1.5 Dissertation outline ... 10
Chapter 2: Literature Review ... 12
2.1 Marketing Metrics ... 12
2.2 Digital marketing ... 13
2.2.1 Word of Mouth ... 15
2.2.2 Viral Marketing ... 16
2.2.3 Social Media Marketing ... 17
2.3 Social Networks ... 19
2.3.1 Facebook ... 20
2.3.2 Twitter ... 21
2.3.3 Youtube ... 22
2.4 Social Network Analysis ... 22
2.5 Literature review conclusion ... 26
Chapter 3: Methodology introduction ... 27
3.1 Research purpose ... 27
3.2 Preliminary Method ... 27
3.3 Software for SNA ... 27
3.3.1 NodeXL ... 27
3.3.2 Twitter data ... 30
3.3.3 Youtube data ... 30
3.3.4 Facebook data ... 31
3.3.5 Gephi ... 32
3.4 Social Networks features... 33
3.4.1 Youtube Social Networks ... 34
6
3.4.3 Twitter Social Networks ... 37
3.5 Research Design ... 38
3.6 Data Collection Method ... 40
Chapter 4: Results and discussion ... 42
4.1 Phase 1: Campaign retrospective ... 42
4.1.1 Twitter Campaign ... 42
4.1.2 First Network Extraction ... 43
4.1.3 Calculating the influence impact ... 47
4.1.4 Calculating the Customer influence value ... 50
4.2 Second Network Extraction ... 52
4.2.2. The WOM impact ... 53
4.3 Phase 2: Controlled Campaign ... 54
4.3.1 Facebook campaign ... 54
4.3.2 Campaign results ... 56
4.5 Impact on the network value ... 57
Chapter 5: Conclusions and implications ... 59
5.1 Main Conclusions ... 59
5.2 Limitations ... 60
5.3 Further research ... 60
References ... 61
Annex 1 Path length 1 ... 64
Annex 2 Path length 2 ... 64
Annex 3 Influence effect 1.1 ... 64
Annex 4 Influence effect 1.2 ... 65
Annex 5 Influence effect 2.1 ... 65
Annex 6 Influence effect 2.2 ... 65
7
Chapter 1: Introduction
1.1 Background and problem statement
Firms in consumer markets increasingly recognize the need to be present in social networked media. Nielsen’s annual report (Nielsen, 2013)specifically highlights the 24% growth in Social Network (SN) use observed in 2012 in the U.S., which is mainly attributed to an increased access through mobile devices. This represents a SN penetration rate of about 15%, with 14% of regular SN users purchasing products after seeing a social ad recommendation (that is, shares and likes). Nevertheless, there is still a lot of skepticism and debate around the real business value of social networked media presence.
Philipe Kotler, in his book Principles of Marketing (Kotler & Armstrong, 2009), divides the marketing process in four different functions - analysis, planning, implementation and control. This process starts by analyzing the company’s internal and external environment. Once this information is gathered, it is possible to make an accurate plan and develop a suitable marketing strategy. The developed plan will then be implemented and subsequently evaluated. In particular, the control function of a marketing process is defined as “the process of measuring and evaluating the results of marketing strategies” (Kotler & Armstrong, 2009). Such function is thus what enables marketing managers to learn from the outcomes of past decisions and adapt and optimize their offers for the future, thereby closing the gap between what has happened and what should have happened.
To be able to evaluate the impact of marketing strategies on revenues and profits, companies first need to set performance goals and identify measures of goal achievement. Such measures are known as key performance indicators or marketing performance metrics (Strauss, Frost, & Ansary, 2014)As earlier stated, social networked media have today an undeniably strong impact on both companies and consumers’ everyday activities, making it a perfect communication channel for marketers to leverage. However, the stronger the trend of social media marketing grows, the higher the need of marketers to device means of monitoring and leveraging it. Yet, there is a considerable lack of suitable marketing metrics to determine a company’s Return-On-Investment (ROI) on SN marketing activities (Kumar, Bhaskaran, Mirchandani, & Shah, 2013) beyond the mere measure of “shares” and “likes”.
8 Consequently, questions like “What is actually the dollar value of a Like?” or “What will be the final return of a Share?” are acutely present in the mind of all social media marketers and community managers, and remain very hard to answer.
Kumar and co-authors (Kumar et al.) have recently presented a metrics’ approach enabling marketers to calculate the ROI of a SN campaign. This approach entails 3 sequential stages – identification of target SN community, assessment of the diffusion potential of the targeted SN for a given campaign, and campaign implementation –, and makes use of two distinct phenomena that are inherent to SN behavior – the organic diffusion of Word-of-Mouth (WOM) amongst users (triggered by specific promotional activities), and the role played by network community influencers, or opinion leaders, in this type of information diffusion process. Although this study makes a very important contribution to the assessment of social media ROI, some of the relevant metrics identified (e.g., the Customer Influence Effect) are hard to generalize beyond the particular network used. Another limitation is that the methods used to gather network and user information effectively restrict the analysis to a small part of the network, thereby not being able to leverage the information provided by other possible connections between different types of users (influencers or not). To this effect, another recent study conducted by Liu-Thompkins (Liu-Thompkins) on the virality of YouTube videos and optimization of diffusion seeding strategies, shows that the quality of the promotional message and, most importantly, the level of reciprocal influence and shared interests of community users is crucial for the virality of a campaign. Such findings call for a more extensive use of social-capital theory (Liu-Thompkins, 2012)and social network analysis concepts and metrics in the assessment and the optimization of social network marketing activities.
1.2 Aims and scope
- To identify and describe a set of metrics that can be used to evaluate and compare the marketing communication value of different social networks;
- To propose a straightforward and accessible process of assessing the spreading potential, or virality, of a SN for a given social marketing campaign;
- To identify the strategic marketing communications’ decisions that can be supported by the proposed metrics and SN assessment.
9 The approach proposed entails a simplification of the collection and analysis of existing SN assessment metrics (Kumar et al., 2013), as well as an easy technical procedure involving an open source software – Gephi -, which is able to not only capture a controlled network, but also extract the full community of its users and their inter-relationships. This approach is based on Social Network Analysis developments (Hubbell, 1965) enabling the extraction and analysis of entire SN, the mapping of its information flows and the identification of influential network users.
The scope of this dissertation is, for practical reasons, focused on Social Networks currently active in the Portuguese B2C market, and on a few social networked media, namely Facebook, Twitter and Youtube, for which data is freely available for further analysis.
1.3 Methodology
This dissertation starts by reviewing existing literature on social media metrics and social media ROI estimation, as well as the state of the art on other relevant marketing metrics. This has the aim of organizing a complete list of indicators that can later be used or adapted to the central part of the project. It is also important to better understand the potential use of the network analysis software in the marketing area, so that it can be correctly applied.
Next, an extensive analysis of Facebook, Twitter and YouTube communities was done in order to better understand what types of relevant marketing data could be extracted from these social networks, and identify which data was available for all users (and hence was of public access) and which data was only available to companies. Subsequently, a case company was selected with the purpose of conducting a case study that served the development and validation of the proposed approach. Then, the community networks for this company were extracted and analyzed, to understand their shape and dynamics as well as identify influential users and engaged users.
This last step envolved the use of the following software programs to extract the data from the social network under study: Gephi, Node XL Graphs, Netvizz, UCINET 6. This part of the research will have 2 phases. The 1st part will be the analysis of a network before and after a campaign in social networks making it possible understand how the value of the network changes. This 1st campaign was made by the company and
10 the research had not control over it. In the second part the network of the same company will be reanalyzed but by a control campaign with complete access to the data. The objective of this part is to understand what can be the maximum WOM effect that a social network campaign can have.
1.4 Managerial and academic relevance
Managerial Relevance:
Overall, this dissertation will contribute to develop further the research of Kumar and create a new method for analyzing social networks that facilitates the measurement of Return on Investment for the companies. The project’s main input is to assist and monitor on social media strategies. Also helping the companies to understand their communities and comprehend the spreading of information through the network. It will therefore facilitate strategic planning, by enabling firms to make better digital marketing decisions and creating more efficient and effective campaigns in social media.
Academic Relevance:
In a more academic context, this project will facilitate the understating of a social network behavior, comprehending the limits of the network and its information flow since it proposes a new method of analysis. This thesis will also contribute to the development of studies related to social networks. It is expected that at the end of this dissertation, readers will have a clearer overview about what can be done with social network analysis and how this methods can be applied in real companies. The implications of the project can be useful in the study of social networks, providing a mechanism that facilitated the conversion between effect and returns. It makes easier to compare impacts that certain effect may have on the network.
1.5 Dissertation outline
Chapter 2 presents a literature review on the topic of interest, where, a brief analysis about the metrics used in e-marking in particular social networks is done. In this chapter was also debated the more important metrics of social network analysis. Chapter 3 presents the research methodology used, where it is clearly established the method
11 design. In addition, in this section was analyzed all the different types of networks applying the metric from chapter 2. Chapter 4 provides the results on the application of the method to the real campaign, showing the difference in the ROI. Chapter 5 finalizes the dissertation by drawing the main conclusion as well as limitations associated with the research, and also gives some indication for future research on this topic.
12
Chapter 2: Literature Review
2.1 Marketing Metrics
One of the top concerns of marketing managers today is the ability to measure the effectiveness of a their activities (Morgan, Clark, & Gooner, 2002). Keeping track of marketing performance has never been more of an issue than today, with the global retraction of economy and the growing businesses’ need for cost rationalization. It is therefore increasingly important to understand the relationship between marketing activities and value creation for organizations, as this leads to more efficient and effective marketing management decisions.
Measuring marketing performance was never an easy task, both in academic and practical terms (Seggie, Cavusgil, & Phelan, 2007). During the past 40 years, many were those who state that marketing effectiveness is hard to determine, the main reasons for this being that:
• Intangible outcomes of marketing activities, like brand equity (Barwise & Farley, 2004) and customer loyalty, are hard to ascertain;
• Marketing effects on company revenue are spread out in time, so calculating future impacts is always a very uncertain activity, since models relies greatly on a priori assumptions (Barwise & Farley, 2004).
Despite the associated difficulties, the need for some kind of key marketing performance metrics is so high that some argue that “the use of imperfect measures is better than none” (Sheth & Sisodia, 1995). Consequently, some measures of marketing performance have been developed over time to overcome this challenge.
Some authors suggest (Hanneman, 2014) a division of strategic marketing metrics into four big groups: financial, quantitative, and qualitative and hybrids. Financial measures, such as ROI (Return on Investment) and CLV (Customer Life-Time Value), can be used to evaluate the monetary outcome of a marketing action. On the other hand, quantitative measures, such as Market Share and Customer Satisfaction Index, also generate a quantitative outcome, albeit not in monetary terms. There is also been an effort to express qualitative measures, such as perceived quality and brand awareness, in more measurable and hence more accountable and actionable indicators. Finally, hybrid measures are a combination of several of the above (Hanneman, 2014).
13 ROI is a well know business metric that is defined as the total financial outcome of a business activity divided by the total investment. This indicator shows clearly what the gain of a company’s activity is when compared to the investment made. Lenskold has (Lenskold, 2002)developed a metric that enables the incorporation of specific marketing activity measures, like CLV and Total Customer Value (TCV), into the calculation of ROI. This type of metrics clearly expresses the financial impact of a marketing campaign on company performance.
At a more tactical level, Classic Advertising Metrics (Table 2.1) have been proposed to help marketers evaluate the impact of their traditional media ad campaigns (e.g. on TV or radio) on target audiences (Kotler & Armstrong, 2009).
Table 2.1 – Classic Advertising Metrics base in (Kotler & Armstrong, 2009), (Kaushik, 2009) and (Strauss et al., 2014)
Effective Reach
% of the target audience that has been exposed to the ad placed in a given medium.
Effective Frequency
Number of times a member of the target audience has been exposed to the ad placed in a given medium.
Impressions The number of individuals that are exposed to the ad placed in a given medium. Gross Impressions Total audience for the ads placed in a given medium.
CPM Cost of reaching 1000 people of a medium.
RTM % of the target segment that is part of the medium audience. CPRP Cost to reach a % of the target segment with a given medium.
However, and even though the capital investments on advertising are typically straightforward to quantify, the determination of the returns of all the direct effects of a marketing campaign remains a tricky issue (D'Esopo & Almquist, 2007). This complexity is even more compounded when trying to account for the indirect effects of a marketing message on financial performance, because the impacts of word of mouth, message virality or brand loyalty on sales are much harder to ascertain.
14 With the global Internet and ICT adoption occurring in the 21st century, marketers were required to adopt their practices to the digital lifestyle of their customers. Moreover, the internet proved to be very valuable for marketing practice, by bringing about a new set of tools and channels with which to communicate with and sell to customers. Digital marketing is essentially a form of direct marketing created in the digital age, which entails “the company efforts to market products and services and build customer relationships over the internet.” (Kotler & Armstrong, 2009).
The Internet is being increasingly used by marketers for several reasons, such as to (Grifoni, D’Andrea, & Ferri, 2012):
1) Quickly distribute products 2) Reach new markets
3) Conduct marketing research 4) Serve customers better
5) Handle customer problems, concerns and complaints
6) Communicate more efficiently upstream and downstream the value chain, particularly with suppliers and customers
Indeed, web-based technology constitutes a very powerful way to communicate to customers, not only because of its reach, depth and interactivity, but also because it enables the tracking of interactions and consumption-related behaviour (Kaushik, 2009). In this way, digital marketing can also generate lot of quantitative data that allows companies to better analyse and control the impact of promotional campaigns. In view of this, several marketing metrics are being developed and employed in the online world, a summary of which is presented in Table 2.2 (Farris et al., 2010; Lalwani et al., 2012; Kaushik, 2009).
Table 2.2 – Summary of the most relevant digital marketing metrics today (Farris et al., 2010; Lalwani et al., 2012; Kaushik, 2009).
Number of visits Total number of entries in a website for a given period
Unique visitors Number of individuals who entered the website in a given period
Page Views Number of times a webpage is loaded
New and Returning Visitors
The number of individuals that enter for the 1st time in the site and the number of individuals that returns to the website.
15
Time on page and Time on site
Time an individual spends on a page and the time spend on the site
Bounce Rate Percentage of individuals that leave the web site after seeing the 1st page.
Exit Rate Percentage of individuals that leave the web site in a certain page
Conversion Rate Percentage of unique user that achieve a certain goal on a page.
Click-Through Rate
Percentage of individuals that when exposed to certain advertisement click on it.
These metrics are nevertheless quite limited when it comes to assess the impact of social media activities on brand value, sales and profits, since such media are able to generate value for businesses mainly through their ability to generate and amplify digital word-of-mouth.
2.2.1 Word of Mouth
Word-of-Mouth or Word-of-Mouth Influence is a personal communication about a product or service taking place between buyers and neighbours, friends, family members and associates (Kotler & Armstrong, 2009). In other words, it is the passing of information between a non-commercial communicator and receiver (Dichter, 1966). Digital WOM, in turn, refers to all WOM being mediated by digital technology. Digital WOM is a very powerful communication tool, since it contributes to overcome the consumer resistance with a lower cost and faster impact, especially due to the effect of the Internet (Trusov, Bucklin, & Pauwels, 2009). It is particularly effective not only on the long term, but also on the short one due to its inherent virality and higher ability to generate a big buzz effect, when compared with company-driven marketing communications (Villanueva, Yoo, & Hanssens, 2008). Therefore, it has become a crucial element on the determination of the global impact of today’s marketing campaigns, irrespectively of whether traditional offline or digital media are the main communication media employed.
Word-of-mouth phenomena have direct effects on customer equity, particularly when they are able to generate new customers for a brand. Such effects occur due to a combination of several factors (Villanueva et al., 2008):
16 1- The customer brings along a stream of future cash flows to the company due to
repeated purchases over time, triggered by transmitting and receiving positive WOM. This effect is usually accounted for in the calculation of CLV, and needs to adjust by the appropriated discount rate.
2- It is also important to take in consideration the value generated by the customer’s after purchase and consumption, which can be positive or negative, depending on the signal of the WOM he or she will be transmitting to others.
3- A new costumer can improve the acquisition process of a firm indirectly. This happens because personal influences have a big impact on consumer choice, especially on expensive and risky products (Kotler & Armstrong, 2009).
These effects can be significant to the point that some companies forgo advertising activities and rely solely on WOM to acquire customers.
2.2.2 Viral Marketing
Viral marketing is a marketing technique that uses digital media in general, and social networks in particular, to spread marketing messages, by encouraging consumer to consumer WOM communications (Kiss & Bichler, 2008). In fact, it can be seen as a special case of digital WOM, one in which peer-to-peer communications spread and get amplified in a very quick way, similar to what occurs biological viruses (Grifoni et al., 2012). Although viral marketing has the potential to be a very effective marketing tactic, there is still a great lack of Seed strategy is the understanding about the main drives of success of a viral marketing campaigns (Ferguson, 2008). This is mainly due to the fact that viral marketing outcomes are affected by several external factors, which are hence very difficult to control by firms (Liu-Thompkins, 2012). Nevertheless, this does not mean that companies cannot maximize the probabilities of success by carefully crafting their seed campaigns (Watts, Peretti, & Frumin, 2007). base of a viral campaign and it involves choosing the first-generation consumers or channels to spread a viral message to (Liu-Thompkins, 2012).
A viral marketing strategy entails four critical aspects (Liu-Thompkins, 2012):
1- Seed network size: The number of seed users is always an important decision to make, because of cost-benefit trade-offs. Seeds can be the subscribers of video
17 channel, the fans of a social network’s page, its followers, among others. Seeds reflect thus the size of the network targeted.
2- Tie strength: It is very important to take the strength of the connections between the content creator (typically the brand) and seed consumers into account. This can be given by the percentage of customers connected with a video channel as friends, or in case of Facebook, the percentage of customers following a particular page. Following a page is a way to guaranty that the user always receives the content made by the company, so the tie strength between the two is higher.
3- Seed influence: This represents the level of influence each seed has on the consumers, being defined as average of the number of consumers connected to the seeds. This can be, for instance, the average number of social network friends page followers have.
4- Seed homogeneity: This stands for the degree of homogeneity inside a network. Homogeneity refers to the number of subscriptions/ liked pages every user has in common with other users. If two users have a lot of pages in common, the probability of a message passing easily from one to another is higher (Liu-Thompkins, 2012).
2.2.3 Social Media Marketing
Social media marketing refers to the use of social media channels, like social networks, wikis, blogs and other online communities, to conduct marketing, PR and customer service activities (Barker, Bormann, Neher, Neher, & Barker, 2012). Social media channels are thus a collective group of web platforms, the content of which is primarily organically generated by its users. This implies that marketing content can be created by both firms and its customers when such media are employed (Barker et al., 2012). A recent study (Nielsen, 2012) shows that US social network users have increased by 24% since 2011, namely due an increased access via mobile devices. This represents a usage rate of around 15% of the US population. However, only about 14% of social media users purchase the products after seeing a related social ad (Nielsen, 2012), which implies that the full power of social media marketing is still far from being harnessed by firms. Social media can play several important functions in marketing communication activities(Barker et al., 2012), such as:
18 1. Create buzz by spreading a message from user to user (i.e., peer-to-peer communication), in this way enabling companies to reach larger audiences faster and with lower costs (Barker et al., 2012).
2. Trigger conversation. One of the functions of social media is to create interaction between users and between users and brands. It is a form of user narrowcasting that is not limited by the physical presence of the sender and the receivers, since they are all interacting with each other.
The following metrics have been suggested to evaluate the impact of social media on marketing activities (Kaushik, 2009):
• Conversation Rate – the average number of comments (or any kind of replay) per post (the content made by the page or channel). This measures the verbal interaction between users and the page.
• Applause Rate – the average number of likes (or any kind of applause) per post. This measures the primary engagement between users and the page.
• Amplification Rate – the average shares/ retweets (or any kind of amplification mechanism a social network has) per post. This is a measure of digital WOM, since after doing a share the followers are using their own network of contacts to amplify the message.
Additional metrics have been developed to enable the setting of key performance indicators for social media marketing campaigns. These are (Expresso, 2014):
• Share of voice - Share of mentions a company has relatively to its competitors, generated by anyone in a network.
• Audience engagement - The level of engagement of a specific community, calculated by dividing the sum of user interactions by the size of a specific audience.
• Active advocates - The percentage of individuals that generate positive messages about the company in a given period of time, being calculated by dividing the number of active advocates by the total number of advocates (actives and passives).
19 • Advocate impact - The percentage of direct and indirect impact that advocates
have on conversations, being calculated as the percentage of advocate-driven conversations on the total volume of advocate comments.
2.3 Social Networks
Social networks are a recent hot topic in marketing. Sociologists, however, have been studying this phenomenon for decades, trying to understand how and why people interact with each other in networks.
Social networks are groups of people organized in a social structured with dyadic ties between each other (Wasserman & Faust, 1994). The concept of social groups was first presented by Ferdinand and Tonnies (Ferdinand, 1887), who defined the concept of community as a group of people linked by values and beliefs. In early studies about social classes (Bourdieu & Wacquant, 1992),in particular regarding the concept of habitus, it is referred that “the identification of a social group depends not only of its self attributes while a class but also on the integration of the members between themselves as well as the integration with the other social groups”. This adds a new side to the social discussion, by focusing on interactions as a central component of a group’s social characterization (da Costa & Casanova, 1996).
With the increase of Internet use, there was a significant change in the way people interact with each other. One of the first things to change was the time people spend online interacting with each other (Anderson & Tracey, 2001). The impact of the Internet on society is so significant that it has changed completely the way people interact with each other, by replacing spatial communications by digital networks. Because of this, there was also transformation of sociability in complex societies (NodeXL, 2014).
The Internet is thought to have a positive effect on both social interactions (since it facilitates the connections between the individuals), as well as on exposure to other sources of information, online and offline (NodeXL, 2014). Several sociological studies show that people develop social meaning and relationships on the basis of personal affinities more than spatial ones (NodeXL, 2014). So there is a clear relation between this idea, of affinities, and the article about spreading of viral content, since the most important variable is the users’ homogeneity (Liu-Thompkins, 2012). Homogeneity is itself a variable that shows that is the degree of affinity between two individuals.
20
2.3.1 Facebook
Facebook is a free, online social networking service provider allowing its users to create their own profiles, share information with others, express preferences, chat with other people and, last but not least, interact with companies and brands. It functions on the basis of News feed box where users receive the news about their friends and the other pages they have connected with in some way. It is also the biggest of its kind, with currently around 1.1 billion users worldwide (Reports, 2013). This company has been growing at a staggering 20% per year, especially because of the increase of users in Asia. Facebook returns come mainly from advertising, since the platform allows the companies to promote their pages, boost their content and create ads (O'Dell, 2010). In Portugal Facebook reached 4 millions of users in 2014(Expresso, 2014).
There are 3 main tools provided by Facebook that can interest companies (Lalwani et al., 2012):
• Fan pages: companies can create their own page in Facebook, which network users can then subscribe and in this way continuously receive information from the company. This also enables companies to create virtual segmented communities around their brand and represents a free communication channel to customers.
• Posts: posting is a great tool to create activity on the fan page and build a community. Companies can also pay for a post to be promoted across the network, thereby increasing their number of fans.
• Advertising: companies can advertise through Facebook, which also sells information about its users (demographics, online behavior) back to companies. This information can be then used to design and target highly viral marketing campaigns.
Facebook allows page managers to extract insights about page performance for free. This includes reports about some important metrics (MarketingMagazine, 2012):
• Total Likes: a measure of the number of people who have subscribed a page and the percentage growth of the page.
21 • Friends of fans: the number of social friends that the page’s fans have, which
stands for the maximum potential reach of the page.
• People talking about this: the number of persons that talk about the business on the Facebook page during a week. Takes all the likes, comments, shares, people that responded to events, page mentions and tagged photos into account.
• Weekly total reach: indicates the number of persons who actually saw any content associated with the page in a given week.
2.3.2 Twitter
Twitter is a free, online social network service based on microblogging. It has nowadays over 500 millions of users worldwide (Lunder, 2012), albeit not all are active users. These were just under 200 million in February 2013. Twitter is still growing in the US at a 13% rate per year (Nielsen, 2013). It has a huge potential in terms of viral marketing, due to its immense reach. This is mainly because of its retweet feature that lets users forward posts from other users (Lalwani et al., 2012). Twitter is also a free information network, since all the posts and comments can be seen by all other users. This means that it does not require a follower/ fan/ friend relationship to access the information of the user. This social network provides the following tools with interest for marketing activities (Twitter, 2014):
• Profile pages: an important communication tool that allows businesses to have their own profile and communicate about products and services to their groups of followers.
• Promoted tweets: this tool makes the internal search engine of twitter pick selected posts in the search results of some specific type of user.
• Promoted Accounts: these are users who have been identified by the platform as potential influencers. This is a very important tool for viral marketing activities. • Promoted trends: these are posts placed on the hottest topics, which increases
their potential of exposure to the target audience.
• Analytics: a set of network analysis metrcis provided by the platform that show information about the activity of a Twitter page.
22
2.3.3 Youtube
Youtube is a video sharing network created in 2005 and owned by Google since 2006. It is currently the biggest online video sharing platform in the world. It is estimated that every minute, 72 hours of video are uploaded to the network. This leads to a total of 4 billion hours of content viewed every month (Lalwani et al., 2012). This platform has a great potential for online marketing, since it is a way to put video on the web. So it is something comparable to television advertising, but on the internet. There is also the possibility to contract product placement on the big channels and pay for content inclusion in videos. Another potential of this network is the capacity to generate organically viral content.
This social network provides the following tools with interest for marketing activities (Youtube):
• Profile page: it is possible for companies to make a page profile and let users subscribe to it, so whenever a company puts a new video on its channels, this will be announced to all of its subscribers’ network.
• Paid Ads: Youtube’s business model is essentially based on advertising revenues obtained from showing short ads for companies before broadcasting a video (Youtube).
• Analysis: Youtube provided page owner’s access to statistics about their audience that can be relevant in the planning og future campaigns.
It is also important to refer the possibility of accounting for the impact of social networks on the traffic generated to business websites. Social networks are great tools to create traffic and all related information can be monitored through web analytics platforms, such as Google analytics (Google). This makes it possible to know how many people enter the web site through youtube, facebook, twitter, among others (Google).
2.4 Social Network Analysis
Social network analysis is a method of analysing social relationships in a group, in order to understand the informal connections taking place between its members (Ehrlich & Carboni, 2005) The premise for this analysis is that social life is created by interactions
23 and the patterns produced through these interactions (Wellman & Marin, 2009). The primary concepts in this type of analysis are nodes (the members of a network) and ties (the relationships established between these members) (Wasserman & Faust, 1994). Social networks are usually represented graphically on a social network diagram, where nodes are presented as points and ties are presented as lines connecting the points (Pinheiro, 2011). Network analysts started to introduce the methods of sociometry already back in 1951 (Moreno, 1951). With the advances of the computer technology, it became possible for researchers to use much complex mathematical models and test their social interaction models in larger groups (Ehrlich & Carboni, 2005). Nowadays, with the massification of online social networks, the potential for extract even more quantitative information about social network behaviour has basically exploded.
There are a lot of different metrics regarding social network analysis. The network size is a primary measure of social networks. It represents the number of nodes in a network, by order words the number in a network (Li, Samutachak, & Bhubate, 2012).
The Relationship strength is the strength of the tie between two nodes. It measures the strength of the connection between 2 users. This is mainly divided in 3 other measures: the frequency of interaction, the quantity of interaction and the intensity of relationships (Li et al., 2012). Other indicator for a strength of tie can be: Reciprocity in interaction or flow/ The type of interaction/ The structure of the nodes (number o mutual friends) . (cheliotis, 2010) Important concepts regarding tie strength:
• Homophily is the tendency of nodes ( people) to form ties with nodes that share similar characteristics (McPherson, Smith-Lovin, & Cook, 2001) this leads the nodes to form groups tendentiously more homogenous, this groups are called clusters. The homophily is the number of subs user j and k have in common. Homophily measure was developed from the idea of an affiliate network from social-network analysis (Wasserman & Faust, 1994)
• Transitivity is a property of ties that represents the individual assumption of considering a friend of a friend also his friend. This usally appends with individuals that have strong ties. (Flynn, Reagans, & Guillory, 2010)Bridged are
24 ties that connect across groups, this promotes inter-group communication but they are usually related with weak ties. (cheliotis, 2010)
• Reciprocity is a measure of symmetry. It indicates if the relationship of two nodes is reciprocal (Li, 2012).
The diameter is a measure of speed of information that has in consideration the network size. It indicates the distance between two nodes in the network. As the diameter increase the more difficult it is for a note to receive information from the other. This means that it measures the total distance between the two further notes, diameter can also be explained by the maximum path distance a message has to travel to reach all the other users in a network. It is calculate by measuring the longest shortest path between two notes and it is a useful measure of reach (cheliotis, 2010).
The average path length is an average distance between a node and all other nodes. It is also a measure of speed that bases on the concept of path length. Path length from user A to user B is the number of users a message has to jump before after leaving user A until it reaches user B. Theoretically, in a network, the minimum value of average path length is 1, when all the users are connected to each other but to have every user connected to other users is utopian and so possible minimum is 2 when at least on user is connected to all network (Fronczak, Fronczak, & Hołyst, 2004).As a measure of seep of information it says how much time in average a message has to travel between leaving the send until it reaches the receiver.
The density is also an indicator of network speed but it differs from the others sine it doesn’t directly measure the travelling time of a message. It indicates the proportion of ties compared to the maximum number of ties the network can have. In other words it is a proportion of number of connections present in the network relative to the total number of possible connection that group can have. It measures the density of connections in a network. Networks with more connections, regarding their network sizes, are denser than networks with fewer connections. As the network increase their size it is harder to maintaining higher levels of density. It stills a good indicator for comparing networks against each other (cheliotis, 2010).
The degree is another important metric. It is the number of relations that a node has. In other words the number of connections a user has with other users. This is a primary measure of power in the network since users with a lot of connections have more power and because of that it can be use to find opinion leaders and other kinds of influences.
25 Degree can be divided in outdegree and indegree. Outdegree measures the number of ties directed out of the node and it is demoted as , this represents the number of relationship forming events initiated by the note. Indegree measures the number of tires directed to the node and it is demoted as , this represents the number of events initiated by actors adjacent to the node. When the indegree is equal to the outdegree the graph is called balanced digraph. (Satyanarayana, 2009).
The clustering coefficient of a node is the density across the neighborhood of a specific node. It is the density of the users adjacent to specific users. The clustering coefficient of a network is the average of each node. It is calculated by the coefficient between The number of ties of the neighborhood, excluding the ties with the center node, divided by the total number of possible ties. The mathematical formula is:
where
The network average clustering coefficient is the calculated by the following formula:
This clustering techniques represents to how connect are the neighbors to each other in a network. (Watts & Strogatz, 1998). The cluster algorithms is a method that tries to maximize the number of ties that join the same cluster, therefore minimizing the social distance of the nodes (cheliotis, 2010).
The centrality of a node measures its relative importance within a network. It measures the relative importance a user has in the network (Newman, 2010). It accounts for the influence a user as in the others and it is a base measure for calculating the influence value. A user with a higher centrality is a user with more influence in the network. Although there are a lot of centrality measures this review is only going to discuss the more important ones.
The Centrality Betweeness can be considers a measure of information control. It represents the number of shortest paths that pass thought the node divided by the total number of shortest paths of the network. This is important to understand the position of the notes and it is crucial for information transfer. (Li, 2012).
26 The Centrality Closeness is a measure indicates how long on average will it take (in terms of persons) to reach other nodes from a starting node. This basically makes an average of all the shorts paths to all the other nodes in the network. When the centrality between is low it means that the speed of diffusion is high. (cheliotis, 2010) . Nodes locates on the centre of the network have usually a high speed of diffusion. The centrality Degree indicates the counting of the relative share of contacts of a node. In other words it measures the degree of connectedness of a node. (Li et al., 2012).
Eigenvectors centrality is a measure of influence that bases the value of each note, not only on the influence the node has but on the influence its neighbours have (Hanneman, 2014). In order words the influence of a user with low influence that is connected with a lot of users with high influence has more influence in the network them a user with low influence that is connected with users with also low influence. This metric is the base of Hubbell’s influence the primary influence measure use by Kumar (Kumar et al., 2013). Hubbell’s influence similar to eigenvector measures centrality calculating the influence of a user base on the influence of the people he connects with (Hubbell, 1965). Hubbell influence has in consideration the eigenvector score of the users, the path length matrix and an attenuation factor.
2.5 Literature review conclusion
After analysing the more important metrics considering e-marketing and social media marketing it is easy to understand that the majority of this metrics can’t be applied when analysing social networks in depth. This chapter show the necessity of a new method of analysis and presents social network analysis as this method. With these insights it is possible to evaluate social networks based on the users and their integrations. The metrics presented in this chapter will be the base variable used in the following chapters. They are going to be used in particular on calculating the value of influence of the users and the ROI of social networks.
27
Chapter 3: Methodology introduction
In order to achieve the aims of this dissertation, an empirical study was conducted using social network analysis software that permits the extraction of data from social networks. This chapter describes in details the methodological approach employed.
3.1 Research purpose
The purpose of this research is explanatory since it tries to help answering a very define problem. “How much is the value a social network?” The research attempt to propose a method that facilitates the calculation of social network value looking further in to the research of Kumar and social network analysis.
3.2 Preliminary Method
The objective of this research is to develop an improved understanding of Kumar’s Social Network ROI (Kumar et al., 2013) in particular the way users influence each other. This will help companies to better grasp what should be the expected impact of WOM on a Social networks campaign, and how does this affect the social network value. It is possible to show how a company can measure their impact on the network through the use of Social network analysis metrics. But in order to accomplish these objectives it is necessary to have a group of metrics that can effectively measure the connections between the different users of the network (Kumar et al., 2013). This data is not easy to reach since none of the social networks give this information on their standard analytical reports. So it is crucial to use other programs that allow for the extraction of the visible part of the network in order for it to be fully analysed.
3.3 Software for SNA
In order to collect the data from the Social Networks it was decided to use specialized software on the subject of social network analysis. For data extraction, NodeXL (NodeXL, 2014) was used, and data analysis, Gephi(Gephi, 2014) was subsequently employed.
3.3.1 NodeXL
NodeXL is an excel template enables the extraction of data from Twitter, Youtube and Facebook. The software has been developed in an open source platform with major contribution from the Social Media Research Foundation and Microsoft Research External
28 Projects Groups. The information is converted in edges and vertices (another denomination for ties and nodes), to be subsequently converted in to a graphic representation of a Social Network. Although the program has already an analysis toolkit, it is only used in this dissertation network data extraction data since there is another software available which is more powerful for network data analysis. NodeXL extracts different data regarding the time of network and the type of ties the users have.
NodeXL can accurately extract networks of a Twitter user (network of users that follow and are followed by the user), a Youtube user (network of channels this user subscribes) and also Facebook page user (the network of a user that is connected to a given page). Although the software can extract different networks, the possibilities of extractions are to a certain extent limited by network privacy standards. For example a Twitter extraction can have a lot of more data than a Facebook extraction, since Twitter privacy standards are not as strict as Facebook’s.
The first level of interaction in a network corresponds to an area where nodes are directly linked to a centre, the user (e.g. user’s Facebook friends), while the second level of
interaction corresponds to users that are linked to users in the first level (e.g., the friends of friends of Facebook user).
Figure 3.1 depicts an extraction example of a network from a small content channel on Youtube. For comparison purposes, the same network centre and the same maximum of number of nodes were used. This is a very simple network where the users are clearly showed as circles (nodes), whereas connections between the users are depicted by lines (ties). The big node in the middle of the network is the network centre, in other words, the user to which the extraction process has been applied.
The first level of extraction does not provide a lot of information useful for understanding the relationship between users and the network centre.
29 Networks can usually be extracted to a maximum of a second level of interaction (NodeXL, 2014). Figure 3.2 represents a one and a half level extraction for the same network depicted in the figure 3.1.
This type of extraction provided much more information, since it already takes in consideration the connection between the users of the network themselves. It also important to know that the one and a half level extraction only moderately increased extraction reach (NodeXL, 2014).
Figure 3.3 shows a second level extraction of the network earlier depicted. This type of network includes the subscriptions of the subscriptions (friends of the friends). The reach to this type of extractions is huge, since it reaches users that are not directly connected with the network centre.
Figure 3.1 second level extration Figure 3.2 half level extraction
30 The one and a half level network of Figure 3.2 is also represented in blue, but does take the semicircular shape as before, because networks are now spread across the map due to the inclusion of the other networks connected with the first ones. The grey circles are the nodes that are not connected with the network centre.
This type of second level data extraction provides much more information, but also increases greatly the complexity of the analysis.
3.3.2 Twitter data
The twitter’s data collection is usually made through a twitter user network extraction; this extraction had 2 aspects, the network of people following the user and the network of people/pages this user is following. In other words this means that the extracted network will have the full information about the in and out degree. Here, the network centre is clearly defined and all the users have some kind of connection to each other, even if not directly. The more important data that can be collect from Twitter is the content of the real message (tweet) sent by some user. In this way, a company can evaluate if the feedback is positive or negative, tally the number of followers a person has, to understand the impact of a message, tally the number of favourites to understand the engagement potential of a message, identify the user’s country to filter the data and understand the international spreading potential of the message, as well as follow the results of message spreading over time to see how it progresses. This enable making time frames across countries (Gephi, 2014).
3.3.3 Youtube data
Youtube extractions result mainly data collected from a Youtube user network. But it is important to notice that this network is not composed by the subscribers of a page (channels looking at the page) this network is base on the users/channel this page had subscribed (channels the page is looking at). In other words it represents a network of user channels.
31 This is a limitation: due to Youtube’s privacy policy, it is not possible to see the subscriber of a page. Yet, there is still a lot of potential in the analysis of this Figure 3.5 depicts a 1.5-extraction level of a Youtube users’ network. The network centre is depicted in green. It is possible to organize this network according to the attributes of the attributes of the nodes, for example videos made, subscribers, videos watched, among others. The size of Figure 3.5 represents the number of subscriber of the channel. So, even if an analysis starts on a very small channel, more relevant channels related to the user can be quickly found (Gephi, 2014).
3.3.4 Facebook data
NodeXL enables the extraction of two types of Facebook networks: to-user and user-to-post. Unlike a Twitter network, however, it is not possible to extract second level networks due to Facebook’s privacy policy. It is only possible to extract what is visible by the other users of the network, so if a user is not able to check some other person’s friends, the software will not be able to track this either. This raises an important issue in this type of analysis, which is the visibility of the user in a Facebook page. Usually, not all users are visible, not even for the page owner. If the users interact with the page they stay visible and the software can capture their data. But if a user just “likes” the page, this stays invisible for everyone else. This is, in fact, a limitation of Facebook networks. But since the majority of Facebook WOM mechanisms are interactions (likes, comments, shares), the extracted network is the only network that actually produces WOM. So this is the only network with relevance for the company anyway.
32 Facebook have two times of extraction with value for the company. The user-to-user
extraction is based on the interaction between users that occurred on a given page. As the Figure 3.6 shows, this is the best way to understand the influence between network users. This also allows making a segmentation based on users’ behaviour on a given page.
The other type of extraction is the user-to-post. This associates the users directly to the page. It links the users to the post they have interacted with by liking, sharing or commenting. This extraction is more focused on the day-to-day management of the page, since it provides useful information about which type of content is more important for each user. This type of extraction can be used to define what contents the page should or should not carry (Gephi, 2014).
Either type of extraction gives information about the number of post, likes and comments for each user, as well as gender and country. Another peculiarity of Facebook networks is that they do not have a defined centre, because it is omitted. Network centres are no longer important for Facebook pages’ networks, since all users are connected to the page and it is not possible to have a second level of network extraction.
3.3.5 Gephi
The most important software used in this dissertation is Gephi. The raw information gathered with the extractions programs has little value if not properly analyzed. Hence, the use of analysis software like Gephi is crucial. Gephi is a free, open source, interactive visualization and exploratory platform with the capability of analysing complex network systems (Gephi, 2014). The first important phase when analysing social networks is to have a clear idea about how the network looks like. When the network comes out of the extraction program it is just a group of circles, with no apparent order. This where Gephi comes in hand.
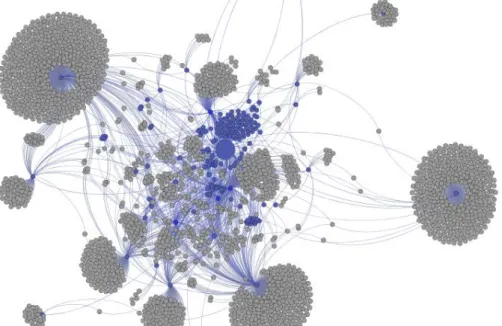
33 Figure 3.7 highlights the difference between a raw data network and one already organized by Gephi. On the left, it is hardly possible to identify any network because parts of the network are not visible. On the right, however, the existence of three major peripheral networks with almost no connection to each other is quite clear.
Gephi achieves this by applying different layouts to a network, in order to organize it in a way that is easier to visualise and interpret. Gephi enables one to rank the nodes by any numerical attribute they might have, making it easy to identify the core nodes of the network (Gephi, 2014).
Gephi analytics include all the major social network analysis measurements already discussed in chapter two: the average degree (out-degree vs. in-degree), network diameter, network density, clustering coefficient, centrality degree, among many others. It also enables a modularity process that clusters the nodes into groups based on the number of ties they have. Another of Gephi’s relevant features are the filters that enable the isolation
of a specific aspect of a network, in order to more accurately study it as metrics can be applied with the filter. Social networks can get really complex, especially when working with second level excitations. Filters are thus essential to clarify and uncovered the details of a network. Gaphy can also generate timelines, making it possible to see how the network has changed across the time (Gephi, 2014).
3.4 Social Networks features
At this point, it is important to select the Social Network (SN) that is more adequate to the dissertation objectives. In order to do so, it is important to understand how SNs differ and
34 what the limitations of each type of network are. Every network has its own shape and particularities, since they vary greatly in terms of privacy policy and in the way users interact with each other.
3.4.1 Youtube Social Networks
Youtube is a video sharing network, where the users take the form of channel, since everyone has the possibility to share a video through the platform. The majority of Youtube users (Youtube account owners) are what can be considered a passive channel. This means that although such users have the capability of creating content, they use their accounts mainly to see, comment and share the content made by other users. Another type of user is the active channel or the content creator user. Active users have some degree of similarity with television channels. There are already a lot of professional channels in the US, since Youtube pays active users a part of its advertising earnings, according to the number of views of content in these channels (SocialBlade, 2014).
One of the most important features of Youtube networks is the subscriptions. A channel subscription works similarly to a magazine subscription. This means that every user can subscribe the channel of another user. Thus every time the channel releases a new video, its subscribers are informed on the main page that a new video is now available for them to watch
Figure 3.8 depicts a 1.5 level extraction of the subscription network one of the biggest Youtube channels in Portugal, which has more than 110.000 subscribers.
This figure shows mainly the core of the community of content creators. Its network centre is represented in orange. Node size differences are related with the number is subscribers
35 in the channels. On the bottom left of the graph there are some channels with no ties to each other. This means that they are not connected to rest of users the network.
The big international channels, usually having some degree of connection to each other, but not to the rest of the network, are depicted in the centre, in red. Although the more interesting part is the blue network on the right, the whole pattern shows the existence of a tight community since all nodes are heavily inter-connected. So, it is fair to assume that there is considerable collaboration between the channels, as well as cross promoting. When filtering out the non-members of the community, a network density of 0,07 is obtained, which is quite a high value. Youtube channels have a pattern of network that differs greatly from channel to channel. One can see a very dense network, if the user was able to make successful and meaningful partnerships, or a much dispersed one, if the user did not build mutual subscription with other channels. Professional channels tend to have very dense networks of subscriptions, since cross promoting is essential for their growth. Figure 3.9 represents the extraction of a B2C company in YouTube. Its centre is depicted
in orange. Here, it is easy to see that the user has very few links with other users and clearly lacks ties to the community. YouTube channels of B2C companies typically display a very low number of subscribers, especially on the Portuguese market. Big companies like Coca-Cola Portugal, Sagres, Superbock, Meo or Vodafone Portugal typically have less than 2000 subscribers, whereas content
channels in the same market usually have more than 10000. This is due to the fact that they are mainly used as a database of commercial campaign videos. Youtube is a pure content network, therefore users subscribe pages that produce content. Another reason is that companies usually do not subscribe other channels. So even when a company develops content marketing activities, like in the case of Coca-Cola Portugal, they do not leverage cross-promotions since they do not link to content creation networks.
Youtube exhibits some limitations in terms of data extraction. Due to its privacy policy, it is not possible to understand how the networks of subscribers of a channel are organized. Understanding how information flows from user to user is essential to achieve the objectives of this dissertation, which rests on being able to calculate the level of homophily of a network and from that estimate its potential for amplifying WOM.
Figure 3.9 B2C company network on Youtube
36
3.4.2 Facebook Social Networks
Facebook is currently the more popular social network in Portugal (Expresso, 2014). As such, companies have much stronger presence on Facebook than either on Twitter or Youtube. Applying social network analysis to this network could have a big potential. However, Facebook has a strict privacy protection policy that limits the ability to extract data. Facebook networks should be denser that those from other social media.
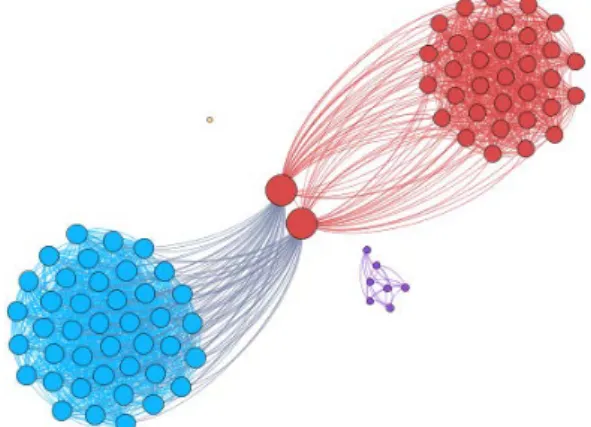
Figure 3.10 depicts the example of a Facebook group network, which highlights the high number of ties this type of network typically has. The density of this network is of 0.14, which is quite high. This is mainly due to the nature of the network extraction process. In Facebook extractions, unlike with other types of networks, users are linked by their interactions and not by friend relationship, since this data is private for the majority of the users. The higher densities observed in this case can also be partially explained by the nature of the network itself, since Facebook is mainly a network of personal contacts. Users thus have a stronger bound to each other than in a Youtube network, where relationships are established based on mere shared subscriptions.
Figure 10 results from running a modularity algorithm. Hence, it is possible to see the different groups on the network in different colours. This algorithm is based on connections between individuals and it works very well on Facebook networks because of its high network density, which is favourable to this process. Separate nodes are possible to obtain in Facebook networks. This implies that although users are connected to the page, they have no interaction to other network members.
37 In the case of Facebook networks, the centre is implicit rather than explicitly depicted in the map. This means that although users are all connected to it, they do not appear to have any ties to it.
This feature is worse in cases where brand pages are not properly managed by companies, such as the one show in Figure 3.11. Here, pages do not only have distinct groups, but also users that do not connect to other users, although they all connect to the same page. The facebook networks also lack an explicit centre and this will necessarily affect the accuracy of measures like density and diameter, since these are based on ties. With the absence of a centre, a lot of ties are then missing. There is a strong limitation for measures of network speed and the flow of information. In order to partially overcome this problem, it is however possible to create in the database a simulated network centre with all the actual ties. Nevertheless, Facebook networks have a great potential and therefore should always be taken in into account in social media network analysis, in spite of its particular challenges.
3.4.3 Twitter Social Networks
Twitter is what could be called a message network, since it is based on a kind of sms sent by a user to its network of followers. Twitter is an optimal network for social network analysis, since it is the only one where user information is publicly available. This makes it possible to calculate all the metrics presented in Chapter 2, as well as the level of homophily of a whole network, based on the pages the users subscribe, albeit with some caution. Twitter also enables the viewing of the content of users’ tweets, making it feasible to conduct content analysis and study the feedback of a network.
38 Figure 3.12 shows a second-level extraction of a company’s Twitter network for a limit of 5000 users.
Here it is possible to see that the shape of this type of networks is usually very different from those of Facebook or Youtube’s. For instance, the size is much bigger and it is possible to see very well defined networks, represented as groups in different colours. The network centre is depicted in orange and all its direct ties (followers of the page) are represented in red.
Twitter networks are typically very well defined. This means that their network densities are extremely low. It is also possible to see that the central page has a few big users, a couple of smaller users, and a lot of users with no networks. Here, it is no possible to visualize the full dimension of the network since the extraction was limited to 5000 nodes. Such networks enable companies to understand how many users have a connection to other users and also what are the users with higher potential impact on network centre.
Regretabbly, Twitter is limited in practice in what respects the amount of information that can be extracted. This SN has an hourly limit for data extraction, so to collected this amount of data may take more than just a couple of hours
3.5 Research Design
The research is going to be based on a company that operates in a purely digital environment, in this case an online booking company operating currently in the Portuguese market. This company has both a Twitter account and a Facebook page, making it possible to analyse both networks. This company was selected based on data accessibility, on its pure online activities and the size of its Facebook network. It is important to analyse a